Written by Vasilena Markova • September 27, 2023 • 12:58 pm • Internet

Round-Trip Time (RTT): What It Is and Why It Matters
Round-Trip Time (RTT) is a fundamental metric in the context of network performance, measuring the time it takes for data packets to complete a round trip from source to destination and back. Often expressed in milliseconds (ms), RTT serves as a critical indicator for evaluating the efficiency and reliability of network connections. In today’s article, we dive into the concept of RTT, exploring how it works, why it matters in our digital lives, the factors that influence it, and strategies to enhance it. Whether you’re a casual internet user seeking a smoother online experience or a network administrator aiming to optimize your digital infrastructure, understanding this metric is critical in today’s interconnected world.
Table of Contents
What is Round-Trip Time (RTT)?
Round-Trip Time is a network performance metric representing the time it takes for a data packet to travel from the source to the destination and back to the source. It is often measured in milliseconds (ms) and is a crucial parameter for determining the quality and efficiency of network connections.
To understand the concept of RTT, imagine sending a letter to a friend through the postal service. The time it takes for the letter to reach your friend and for your friend to send a reply back to you forms the Round-Trip Time for your communication. Similarly, in computer networks, data packets are like those letters, and RTT represents the time it takes for them to complete a round trip.
How Does it Work?
The concept of RTT can be best understood by considering the journey of data packets across a network. When you request information from a web server, for example, your device sends out a data packet holding your request. This packet travels through various network devices in between, such as routers and switches, before reaching the destination server. Once the server processes your request and prepares a response, it sends a data packet back to your device.
Round-Trip Time is determined by the time it takes for this data packet to travel from your device to the server (the outbound trip) and then back from the server to your device (the inbound trip). The total RTT is the sum of these two one-way trips.
Let’s break down the journey of a data packet into several steps so you can better understand the RTT:
- Sending the Packet: You initiate an action on your device that requires data transmission. For example, this could be sending an email, loading a webpage, or making a video call.
- Packet Travel: The data packet travels from your device to a server, typically passing through multiple network nodes and routers along the way. These middle points play a significant role in determining the RTT.
- Processing Time: The server receives the packet, processes the request, and sends a response back to your device. This processing time at both ends also contributes to the Round-Trip Time.
- Return Journey: The response packet makes its way back to your device through the same network infrastructure, facing potential delays on the route.
- Calculation: It is calculated by adding up the time taken for the packet to travel from your device to the server (the outbound trip) and the time it takes for the response to return (the inbound trip).
Experience Industry-Leading DNS Speed with ClouDNS!
Ready for ultra-fast DNS service? Click to register and see the difference!
Why does it matter?
At first look, Round-Trip Time (RTT) might seem like technical terminology, but its importance extends to various aspects of our digital lives. It matters for many reasons, which include the following:
- User Experience
For everyday internet users, RTT influences the sensed speed and responsiveness of online activities. Low Round-Trip Time values lead to a seamless experience, while high RTT can result in frustrating delays and lag during tasks like video streaming, online gaming, or live chats.
- Network Efficiency
Network administrators and service providers closely monitor RTT to assess network performance and troubleshoot issues. By identifying bottlenecks and areas with high RTT, they can optimize their infrastructure for better efficiency.
- Real-Time Applications
Applications that rely on real-time data transmission, such as VoIP calls, video conferencing, and online gaming, are highly sensitive to RTT. Low RTT is crucial for smooth, interruption-free interactions.
In cybersecurity, Round-Trip Time plays a role in detecting network anomalies and potential threats. Unusually high RTT values can be a sign of malicious activity or network congestion.
Factors Affecting Round-Trip Time (RTT)
Several factors can influence the metric, both positively and negatively. Therefore, understanding these factors is crucial, and it could be very beneficial for optimizing network performance:
- Distance: The physical distance between the source and destination plays a significant role. Longer distances result in higher RTT due to the time it takes for data to travel the network.
- Network Congestion: When a network experiences high volumes of traffic or congestion, data packets may be delayed as they wait for their turn to be processed. As a result, it can lead to packet delays and increased RTT.
- Routing: The path a packet takes through the network can significantly affect RTT. Efficient routing algorithms can reduce the time, while not-so-optimal routing choices can increase it.
- Packet Loss: Packet loss during transmission can occur due to various reasons, such as network errors or congestion. When lost, packets need to be retransmitted, which can seriously affect the Round-Trip Time.
- Transmission Medium: It is a critical factor influencing RTT, and its characteristics can vary widely based on the specific medium being used. Fiber optic cables generally offer low RTT due to the speed of light in the medium and low signal loss. In contrast, wireless mediums can introduce variable delays depending on environmental factors and network conditions.
How to improve it?
Improving Round-Trip Time (RTT) is a critical goal for network administrators and service providers looking to enhance user experiences and optimize their digital operations. While some factors affecting it are beyond our control, there are strategies and practices to optimize Round-Trip Time for a smoother online experience:
- Optimize Routing: Network administrators can optimize routing to reduce the number of hops data packets take to reach their destination. This can be achieved through efficient routing protocols and load balancing .
- Optimize Network Infrastructure: For businesses, investing in efficient network infrastructure, including high-performance routers and switches, can reduce internal network delays and improve RTT.
- Upgrade Hardware and Software: Keeping networking equipment and software up-to-date ensures that you benefit from the latest technologies and optimizations that can decrease RTT.
- Implement Caching: Caching frequently requested data closer to end-users can dramatically reduce the need for data to travel long distances. The result really helps with lowering RTT.
- Monitor and Troubleshoot: Regularly monitor your network for signs of congestion or packet loss. If issues arise, take steps to troubleshoot and resolve them promptly.
Discover ClouDNS Monitoring service!
Round-Trip Time (RTT) is the silent force that shapes our online experiences. From the seamless loading of web pages to the quality of our video calls, RTT plays a pivotal role in ensuring that digital interactions happen at the speed of thought. As we continue to rely on the Internet for work, entertainment, and communication, understanding and optimizing this metric will be crucial for both end-users and network administrators. By reducing it through strategies, we can have a faster, more responsive digital world where our online activities are limited only by our imagination, not by lag.

Hello! My name is Vasilena Markova. I am a Marketing Specialist at ClouDNS. I have a Bachelor’s Degree in Business Economics and am studying for my Master’s Degree in Cybersecurity Management. As a digital marketing enthusiast, I enjoy writing and expressing my interests. I am passionate about sharing knowledge, tips, and tricks to help others build a secure online presence. My absolute favorite thing to do is to travel and explore different cultures!

Related Posts

Ping Traffic Monitoring: Ensuring Network Health and Efficiency
March 28, 2024 • Monitoring
In an era where digital connectivity is the lifeline of businesses and individuals alike, maintaining optimal network performance is more ...
Leave a Reply Cancel reply
Your email address will not be published. Required fields are marked *
Recent Posts
- SERVFAIL Explained: How It Affects Your Internet Experience
- Understanding the HTTP status codes
- 10 Most used DIG commands
- What is DNS? How does Domain Name System work?
- Why does DNS use UDP?
- Cloud Computing
- DNS Records
- Domain names
- Load balancing
- SSL Certificates
- Web forwarding
- DNS Services
- Managed DNS
- Dynamic DNS
- Secondary DNS
- Reverse DNS
- DNS Failover
- Anycast DNS
- Email Forwarding
- Enterprise DNS
- Domain Names
Home > Learning Center > Round Trip Time (RTT)
Article's content
Round trip time (rtt), what is round trip time.
Round-trip time (RTT) is the duration, measured in milliseconds, from when a browser sends a request to when it receives a response from a server. It’s a key performance metric for web applications and one of the main factors, along with Time to First Byte (TTFB), when measuring page load time and network latency .
Using a Ping to Measure Round Trip Time
RTT is typically measured using a ping — a command-line tool that bounces a request off a server and calculates the time taken to reach a user device. Actual RTT may be higher than that measured by the ping due to server throttling and network congestion.

Example of a ping to google.com
Factors Influencing RTT
Actual round trip time can be influenced by:
- Distance – The length a signal has to travel correlates with the time taken for a request to reach a server and a response to reach a browser.
- Transmission medium – The medium used to route a signal (e.g., copper wire, fiber optic cables) can impact how quickly a request is received by a server and routed back to a user.
- Number of network hops – Intermediate routers or servers take time to process a signal, increasing RTT. The more hops a signal has to travel through, the higher the RTT.
- Traffic levels – RTT typically increases when a network is congested with high levels of traffic. Conversely, low traffic times can result in decreased RTT.
- Server response time – The time taken for a target server to respond to a request depends on its processing capacity, the number of requests being handled and the nature of the request (i.e., how much server-side work is required). A longer server response time increases RTT.
See how Imperva CDN can help you with website performance.
Reducing RTT Using a CDN
A CDN is a network of strategically placed servers, each holding a copy of a website’s content. It’s able to address the factors influencing RTT in the following ways:
- Points of Presence (PoPs) – A CDN maintains a network of geographically dispersed PoPs—data centers, each containing cached copies of site content, which are responsible for communicating with site visitors in their vicinity. They reduce the distance a signal has to travel and the number of network hops needed to reach a server.
- Web caching – A CDN caches HTML, media, and even dynamically generated content on a PoP in a user’s geographical vicinity. In many cases, a user’s request can be addressed by a local PoP and does not need to travel to an origin server, thereby reducing RTT.
- Load distribution – During high traffic times, CDNs route requests through backup servers with lower network congestion, speeding up server response time and reducing RTT.
- Scalability – A CDN service operates in the cloud, enabling high scalability and the ability to process a near limitless number of user requests. This eliminates the possibility of server side bottlenecks.

Using tier 1 access to reduce network hops
One of the original issues CDNs were designed to solve was how to reduce round trip time. By addressing the points outlined above, they have been largely successful, and it’s now reasonable to expect a decrease in your RTT of 50% or more after onboarding a CDN service.
Latest Blogs

Erez Hasson
Apr 16, 2024 4 min read

Grainne McKeever
Mar 13, 2024 2 min read

Mar 4, 2024 3 min read

Feb 26, 2024 3 min read

Jan 18, 2024 3 min read

Luke Richardson
Dec 27, 2023 6 min read

Dec 21, 2023 2 min read

Dec 7, 2023 6 min read
Latest Articles
- Network Management
172.1k Views
168.8k Views
154.6k Views
106.9k Views
101.8k Views
99.9k Views
59.7k Views
55.3k Views
2024 Bad Bot Report
Bad bots now represent almost one-third of all internet traffic
The State of API Security in 2024
Learn about the current API threat landscape and the key security insights for 2024
Protect Against Business Logic Abuse
Identify key capabilities to prevent attacks targeting your business logic
The State of Security Within eCommerce in 2022
Learn how automated threats and API attacks on retailers are increasing
Prevoty is now part of the Imperva Runtime Protection
Protection against zero-day attacks
No tuning, highly-accurate out-of-the-box
Effective against OWASP top 10 vulnerabilities
An Imperva security specialist will contact you shortly.
Top 3 US Retailer
Microsoft Teams performance optimization in eight steps
")
Author: Sandra Ruf Business Development Manager Rimscout – connect on LinkedIn
Microsoft Teams meetings have become part of many companies’ daily business, not only since the rise of hybrid work models. However, nothing disrupts the productivity of a meeting more than frozen videos or dropouts in the audio connection. Often, the fault can be traced to the user’s network.
In this blog article, you’ll learn in eight steps how to quickly identify and pinpoint Microsoft Team performance issues, so nothing can get in the way of a smooth meeting.
Need an expert to troubleshoot your performance issues? We can audit your network in preparation for a new service launch with our Cloud Readiness Assessment, or actively help you troubleshoot your team’s performance. Learn more about our assessment portfolio: Rimscout Network Assessment – Rimscout.
Specific network requirements for good audio and video performance
For a successful Microsoft Teams performance optimization, some terminology and requirements must first be clarified. People often generalize about poor or slow performance . How smoothly Microsoft Teams can be used overall is only minimally influenced by the network . What can be optimized, however, is the quality and stability of the audio and video connections . For this, you first need to look at the network protocols used. Audio, video or desktop sharing are fundamentally different in network behavior from conventional connections, such as access to files, SQL servers or websites.
Most services use the secure transmission of the Transmission Control Protocol (TCP) . The underlying IP stack ensures that lost data is recalled , the correct order of packets is maintained and the transmission is adapted to the available bandwidth. But especially this behavior causes problems for audio and video connections.
Microsoft specifies three essential conditions, which can be easily tracked in a Microsoft Teams Performance Monitoring, for a good audio and video quality:
Latency (RTT or round-trip time) below 100ms
For Microsoft Teams, the transmission time of a packet from the PC to the Microsoft server and back again should be under 100ms . If the latency occasionally exceeds this value, this doesn’t necessarily mean that stable audio and video performance is no longer possible. Especially for connections that are far apart , such as meetings between Germany and the USA, latencies in the range of 150ms to 200 ms are quite normal. However, if the latency exceeds 100ms more often or even permanently, then a degradation of the quality is to be expected and you can assume an ineffective network.
Less than 1% packet loss within a 15s interval
All data traffic (UDP, ICMP, http, etc.) is carried out using packets. Packet loss describes the number of lost packets in a measured period . For UDP connections and therefore for Microsoft Teams audio and video, excessive packet loss leads to stuttering or dropouts in audio and video quality. For other protocols, packets are retransmitted if lost. Here, packet loss becomes noticeable through longer loading times.
Packet inter-arrival jitter lower than 30ms in each 15s interval.
This value indicates the difference between the latencies of the packets . A high jitter means that the delivery time (latency) of the packets varies greatly. Microsoft Teams tries to compensate this with larger buffers and as a result delays the playback accordingly. This means that large variations have a decisive impact on audio and video playback.
In order for Microsoft Teams to be able to capture these key figures and react to them dynamically there is a need for transmission via UDP . When reverting to a TCP or HTTPS protocol, these values are no longer visible.
Proxy servers and SSL VPN connections as the biggest obstacles for Microsoft Teams
In addition to using a TCP protocol , SSL VPNs or cloud proxies can also degrade the quality of audio and video connectivity in Microsoft Teams.
SSL VPNs are systems that allow private data to be transported over public networks and are tunneled in TCP/IP. These are considered to be particularly strong in terms of data security and data protection . But this is exactly where the problem for good and stable audio and video performance lies. With a VPN tunnel, all of a user’s packets do not go directly to the destination in the cloud, but first via configured VPN servers . Often these are located at the site of a company, so that all packets pass through the company network and also through the internal firewall. The path of the packets is therefore extended, which also directly ensures high latency . For audio and video data traffic (UDP), a latency increase of 40ms, triggered by a VPN, can already be critical and cause initial Microsoft Team performance issues . For good audio and video quality, a local breakout should be used with priority so that the packets can take the shortest route. The situation is similar with (cloud) proxies . In general, a proxy is a system that is placed between a SaaS application or a data center and a client . Here, sensitive data can be protected by the proxy acting as a kind of intermediary for the server on which this data is located. All client requests are routed via the proxy to the actual destination. In this way, client and server do not communicate directly with each other and the service can check the transmitted data for malicious content. In this case there is no local breakout used and the result is a higher latency , which in turn is a barrier to good audio and video performance.
How to eliminate of Microsoft Teams performance issues in eight steps
But what can be done if the audio and video performance is no longer sufficient and your daily work routine is severely impaired?
Step 1: Network assessment and client deployment
In order to make a problem visible, a Microsoft Teams performance monitoring is essential. So it is advisable to do a network assessment with Rimscout . This involves selecting users at representative locations within the organization that are affected by acute Microsoft Teams performance problems. Rimscout clients are distributed to these locations and installed on the users’ devices. There, they collect various connection data in the background and test the performance at these locations . The collected data is continuously transferred to the Rimscout portal, where it can be viewed and analyzed. On the one hand, this makes it possible to determine whether some PCs are performing noticeably worse than others. On the other hand, possible causes can be investigated and ruled out so that the Microsoft Teams performance can be optimized.
Step 2: Monitor bandwidth utilization
Before going into further detail with the analysis of the test results, it should be clarified at the beginning if there is enough bandwidth available. Microsoft Teams needs a relatively large bandwidth for excellent performance. For stable audio or video connections, 100 kBit or 2 MBit are required. Compared to the bandwidth required by Outlook (4-8 kBit), Microsoft Teams needs up to 200 times as much continuous load for a good performance.
Step 3: Monitor UDP traffic
The most important indicator of good Microsoft Teams performance in Rimscout is the UDP test . This test determines the latency of UDP traffic to the Teams Media Relay . As specified in Microsoft’s terms and conditions, the measured latency should ideally be less than 100 ms . If the measured values deviate, the cause of the performance problems can usually be found in the network. The causes for this are numerous, but the following steps will help you to narrow them down step by step.

In the Rimscout portal, the measured latency of an affected client is displayed in the test results diagram. If the threshold of 100 ms is exceeded, Rimscout issues a visual warning for this test.
Step 4: Check the firewall configuration
If the UDP test does not return any values at all, the traffic is probably blocked . Microsoft Teams may still work in this case, but audio and video connections will then use TCP, which in turn may cause performance problems. Check the configuration of your firewall or proxy to see if UDP traffic to Microsoft Teams is blocked and change this setting if necessary.

When the Microsoft Teams UDP traffic is blocked, Rimscout no longer displays data for this client in the health overview. This is indicated by gray bars.
Step 5: Check DNS configuration
If the UDP traffic is not blocked but the measured latency is high, another cause may be an incorrect name resolution . Generally, Microsoft Teams determines its cloud peers by means of DNS queries. It becomes problematic when internal clients query the wrong DNS servers, for example on another continent. This problem often occurs with multinational companies .
The Teams Server Name contains a subword that indicates the location of the server, for example swedencentral. For the Exchange Online frontend servers, the IATA code is used analogously to indicate the location . In both cases the specified location should be at least on the same continent as the own client. But if a client from the USA is assigned a Teams server from Japan or Germany during name resolution, this is a clear cause for Microsoft Teams performance issues.
The IATA Airport Code is a code used to uniquely identify locations based on the marking of airports. For example, PAD in this case stands for the location of Paderborn, Germany

Under Clients you can see in the system profile that the user gets a response from the Teams frontend from India, although he works at a location in Germany.
Step 6: Check routing
If the name resolution from the previous step fits, but the latency is still noticeable, the path of the packets should be checked more closely . Microsoft requires short paths, which is why packets from the client to O365 services should use a local breakout if possible. Routing via deployed VPN solutions or (cloud) proxy servers increases latency and worsens the performance. One possible solution is to tunnel the required UDP packets past a VPN or proxy for a Microsoft Teams performance optimization.
Step 7: Check local system devices
Of course, Microsoft Teams performance issues can also have local causes . In Rimscout, the client data of each user can be read out individually to identify possible errors. First of all, the provider’s connection may be insufficient , which has a negative effect on the runtime of the packets. Problems in the local network due to defective cables , overloaded routers and switches or a poor wireless connection can also slow down the speed of all Internet connections. This slowdown is again first noticeable in the audio and video performance.

Rimscout-Portal-First-Hop-Network
In the Client section, the latencies to the first hops into the network are measured (default gateway and Internet provider). In addition, the CPU and RAM load are monitored alongside the WLAN strength.
Step 8: Eliminate the network as the cause
If all the previous steps do not lead to a Microsoft Teams performance optimization and the UDP test also delivers inconspicuous values, the cause may also lay outside the network . Audio and video connections in general place high requirements on the client. Too little RAM , weak CPUs or cheap webcams without any preprocessing of the image signal can also have a negative effect, just like bad or defective headsets . Screen sharing with very high resolutions, such as 4K monitors , also places challenges the client device, and may cause your Microsoft Teams performance issues.
Want to optimize your Microsoft Teams performance? Are you currently experiencing performance issues and need assistance? Our experts can help you not only with a Cloud Readiness Assessment before launching a new service. With a network assessment, we can also actively help you troubleshoot issues with Microsoft Teams, for example. Learn more about our assessment portfolio and request your personalized offer.
Share this blog post!
- Skip to main content
- Skip to search
- Skip to select language
- Sign up for free
Round Trip Time (RTT)
Round Trip Time (RTT) is the length time it takes for a data packet to be sent to a destination plus the time it takes for an acknowledgment of that packet to be received back at the origin. The RTT between a network and server can be determined by using the ping command.
This will output something like:
In the above example, the average round trip time is shown on the final line as 26.8ms.
- Time to First Byte (TTFB)
10 Key Metrics to Assess Microsoft Teams

Originally posted on gsx.com
This entry is part of our series on Microsoft Teams Performance monitoring . In this article, we will define the meaning of the top 10 compulsory Microsoft Teams metrics to measure the ability of your locations to provide a decent user experience before, during, and after any deployment. The following are the top Microsoft Teams metrics to focus on.
Get your guide and take the immediate steps to optimize the Microsoft Teams experience. Free to download!
Microsoft teams metrics, latency one-way or ping in millisecond and round-trip latency (in millisecond too).

- It measures the time taken to send a data packet from point A to B and come back. It is tied to the physical distance between the two points and the speed of transmission and the overhead taken by the routers in between.
- The latency impacts the smoothness of the conversation between two people
- Increased latency provides unnatural pauses during the conversation
- People also report that it feels like using a satellite phone
- In the end, it leads to having people talking at the same time
- Everybody has already experienced that
Packet Loss Rate
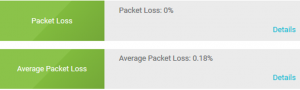
- Microsoft recommends keeping it at 1% during a 15-second call
- Inferior to 3% should provide a decent call quality
- Between 3 and 7%, there is a noticeable impact
- Over 7%, the call quality will be severely lacking
- It represents the amount of packet lost for 15 seconds (for example if 1000 packets are sent in 15 seconds and 50 are lost, it will generate a 5% packet loss).
- This measure is extremely important in VoIP as it used as one of the elements to determine the MOS that we will explain right after.
- A high packet loss will lead to a moment of silence during a call (if you have a period of sustained packet loss during a call) or to a degradation of the voice quality giving people ‘robot-voices.’
Packet Reorder Ratio
This statistic is now considered equally as important as packet loss, because packet reordering severely degrades the call quality. High rate flow network has a greater chance of packet reordering.
Packet reordering (when packets arrive in a different order than that in which they were sent) can be recognized as packet loss or as a congestion signal by most network protocol (like TCP). Therefore, they impact the Network MOS the same way as packet loss. On top of that, they can directly impact the packet sending rate which will also increase the round-trip time.
As a result, the call will be distorted and will cut out at times. The threshold where you need to be alerted is usually 0.05%.
Jitter (Also Called Packet Inter-Arrival Jitter: In Millisecond)

- Audio packets are sent at regular intervals on the network. But that doesn’t mean that they are received with the same regularity (usually because of network latency). That is why a buffer is needed, it waits for all the packets before reconstructing them in the correct order.
- The Jitter is the size of the buffer that is needed to store packets before reconstructing them in the correct order. It can be compared to an audio packet waiting room. The value of the Jitter is calculated over every period of 15 seconds.
- A low Jitter number means that the connection to the call is good and solid.
- A large Jitter buffer provides additional delay in calls. It is the sign of a congestion of the network.
- The shrink or the expansion of the buffer will provide audio distortion during the call like speeding or slowing down of the speech.
- As for packet loss, the Jitter value is used in the Network MOS determination.
The Network MOS: Network “Mean Opinion Score”

This concept needs a little bit more of an explanation.
The MOS is usually a score that is based on a questionnaire sent to the users, like the one you have after each call on Skype, Teams or WhatsApp: “Please rate the quality of the call from One to Five stars” (5 being excellent, 1 being poor).
That is why you can’t have a MOS superior to 5. The problem is that when you want to assess your environment or even during migration you don’t have any or enough feedback to get this score.
That is why Microsoft has worked with other network specialists on the definition of Network MOS metric that can predict what will be the value of the Wideband Listening Quality Mean Opinion Score (MOS-LQ).
To calculate that, multiple factors are considered such as the latency, the packet loss, Jitter, the codec used, etc.
As for the real MOS, the Network MOS ranges from 1 to 5. But because of the compulsory impact of the audio codec, the highest score is usually around 4.4.
How to Use the MOS Value?
The Network MOS is a perfect tool to identify if the network conditions are impacting the end-user audio quality experience. It can be used to identify a wide range of issues.
The first way to analyze it is to compare it with a previous average value in time to understand if you are dealing with a degradation of the audio quality or not.
Then, you can combine this information with the packet loss or Jitter to understand what is causing that degradation and in which location. And that is why you need to constantly measure this parameter from all your sensitive locations.
The best example of root cause is the LAN Congestion.
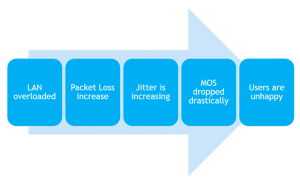
When your LAN starts to be overloaded, the rates of packet loss and amount of Jitter is increasing for all calls going through your LAN.
This will automatically be seen in the MOS score.
If you trend your MOS score you’ll be able to understand exactly at what time and where the LAN was congested, determining your peak time and adjusting your network to prevent this issue from happening again.
We see here how important it is to constantly monitor all these specificities to be able to take proactive actions before users start complaining and opening tickets.
Network MOS Degradation
Another way to analyze the MS Teams end-user experience delivered to your remote location is to understand the Network MOS degradation.
This statistic directly shows the impact of the jitter and the packet loss on the Network MOS. It is generally recommended to keep the value under 1. The higher this value is, the worse the quality of the call is.
Usually, a high value of Network MOS degradation causes distortion in the audio or a blank during the conversation. This is generally due to LAN & wireless congestion and/ or insufficient bandwidth, which directly impacts the rate of packet loss and average jitter.
The statistic is interesting as it is less impacted by the CODEC used during the call than it is impacted by the actual MOS. Knowing this, you can analyze the metrics to understand if the loss of MOS is mostly due to jitter or to packet loss and then troubleshoot the issue.
How Packet Loss and Jitter are Related to the Network MOS Score
The packet loss plays a very important role in the Network MOS calculation. Over 20% of packet loss, your MOS cannot be higher than 2.5.
The latency round trip won’t affect the MOS if it stays under 100ms.
If the Jitter stays under 50ms, the MOS will be as high as it can. When the Jitter rises, the MOS degrades quickly.
Basic Recommendation on Network MOS
As the MOS is a prediction of the end-user experience of audio quality, it is important to constantly measure it. Jitter and the Packet loss should also be measured frequently. Make sure that the Jitter value stays under 50ms, the packet loss as close as 0% as you can and of course the latency under the 100 milliseconds.
Now that we’ve seen what kind of statistics you should collect, let’s see what is recommended as a collection process.
Ratio Concealed Sample Average
An audio sample can be concealed to deal with lost network packets. It is a simple solution to smooth out the abrupt transition that is caused by dropped network packets. That is why these statistics is called “Healed Percentage”.
A high percentage means that many audio samples had to be concealed because of the packet loss. It indicates poor audio quality, which the user experiences as distorted or lost audio.
Usually, it is best to keep the ratio around or below 2%. Over 2% will gradually degrade the audio quality. Over 7%, end users will likely end the call.
Estimated Bandwidth, Bandwidth Minimum, Maximum and Average
This provides the bandwidth values on the client side during the 15 second test call.
MS Teams adapted well to variation of bandwidth by reducing or increasing the packet sending rate. However, bandwidth naturally has a huge impact on the audio quality. Generally, when the bandwidth is under 100Kbps, the quality of the call is degraded. Video calls are even more sensitive to bandwidth variation and packet loss, which is why it is very important to measure bandwidth and keep it within the Microsoft recommendations.
Interpretation of the GSX Robot User Measures and Alerts
Thanks to the GSX Robot Users, you have an easy way to test and collect every statistic you need to assess the readiness of your environment to deploy MS Teams. For further information on how the Robot Users are providing you with MS Teams end-user experience metrics, please read this article >>
You also have a way to easily store and analyze the statistics thanks to our PowerBI reports.
Now, let’s see how to analyze them! First, what should be the results if you want to pass the exam?
Microsoft Teams Metrics – Recommended Results For Readiness Assessment
Microsoft recommends that you perform the test from 2 different “exit points” to analyse what part of your network might cause an issue.
For each location you should have a Robot User performing your tests:
- Directly from where the clients sit to the Microsoft Edge
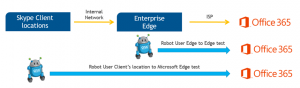
This will give you a pretty good understanding of how your infrastructure is decreasing the call quality of the Teams services.
Here are the recommended values for each of them:
*Network MOS: The MOS score target is usually always the same. A MOS > 4 will provide good audio quality. The closer you are to 4, the smaller distortions you will experience but it will be acceptable.
Between 3 and 4, you can still use the audio (the closer to 4 the better of course) but some users will be impacted by all the issues we explained earlier. It means that you should look at the location to see if you can improve the network quality before deploying MS Teams.
If you have locations with a MOS under 3, you shouldn’t deploy Teams yet. It will create more tickets and frustration than anything.
A heavy look in your network is necessary before doing anything else.
What To Do With These Values?
Now that we have the targets, it is important to compare them with your locations’ values over time.
For that, you want to know what your peak times during the day and during the week are.
It is easy to recognize them with your PowerBI reports that draw all your statistics over days and weeks. You can then identify what are your key moments of the day/week and compare the results of your tests with the Microsoft recommendations.
Finally, as most of the business activity also has a monthly pattern, it is important to keep monitoring this activity for several weeks. You’ll be able to identify these patterns and make sure that you’ve discovered all your peak times.
You’ll see if your network can handle them. If not, you will know directly which location fails and exactly at what time and period of the month.
You’ll be fully prepared to improve the network or handle the users’ complaints.
Microsoft Teams Metrics – Reaching the Target
From a general point of view, to reach these targets you should make sure that:
- The latency one-way is stable during busy and non-busy hours
- The latency RTT is stable and stays close to twice the latency one way
- Packet loss are not increasing too much during busy hours (it is normal if it rises)
- Jitter does not increase too much as well
- Edge connection tests stay better than client connections ones
If all your locations pass the exam during busy and non-busy hours, you can be confident in MS Teams services. User complaints and tickets should stay low, ensuring the best ROI you can have.
But as your infrastructure and the way to use it is in constant change, you should continue to monitor these MS Teams metrics to prevent any crisis, and to predict potential issues at particular locations.
To do so, you must let your Robot User keep working for you.
What Happens If a Site Fails?
We already explained in the statistics description how each of them has an impact on the audio quality. Now, let’s see an example of a site failing the tests:
Data Interpretation
Basically, what’s going on here?
Most of the results exceed the target. Clearly, during the busiest day of the week, the network cannot handle the peak time. The site won’t be able to provide a good MS Teams quality of service .
So basically, the calls will have reduced quality (PSTN, peer-to-peer and conference):
- Users will experience a moment of silence during the call
- They will hear a robot voice for each of the participants
- The speech of the participant will suddenly slow down and then speed up
At the end, the quality will be poor, users will complain, you will have plenty of tickets coming from that location, increasing your administrations costs as well as your user dissatisfaction.
If you have a similar result, you should definitely investigate improving your network before deploying MS Teams.
Finally, the constant monitoring of each site option of the set of Microsoft Teams metrics allows you to easily rank each of your sites and organize them by ROI.
For each site, it is very important to understand the ROI of your network investment.
Sometimes small sites have highly sensitive people and even if the network improvement will be important, the ROI will still be high (like in our Singapore example).
Some other time costs are too high to help remote sites compare to the benefit you will get. In our case, the Geneva costs outweigh the benefits.
The type of Microsoft Teams metrics your team should focus on depends on your organization and what you’re looking to achieve with the platform.
But before going through extensive network design and investment, maybe a first set of simple improvements could enable your organization to provide a decent service across most of your sites. For that please read our article: How to improve your network to meet Teams requirement >>
Learn more about our Microsoft Teams performance monitoring solution and download our ‘Ensuring Teams Performance Under the Hood’ ebook today!

Relieving the IT Burden: A Sneak Peek at Martello’s AI Strategy
Authors: Randah McKinnie – VP Product at Martello, Doug Bellinger – Martello CTO Since large language models and image generators…

Simple Steps To Test And Optimize Your Microsoft Teams Video And Audio
Pixelated cameras, robot voices, tinny sound coming out of your speakers. This is the peak Teams experience when your settings…
Troubleshooting Microsoft Teams Performance Issues in a Specific Office Location
Welcome to the debut of Tales from the Trenches, a ‘boots on the ground’ series written by Richard Ashbee, a…
‘It just grabbed her’: Giraffe picks up toddler during family trip to drive-thru safari
GLEN ROSE, Texas ( KWTX /Gray News) - A family in Texas says they went through quite the scare when recently visiting a wildlife center.
According to the Toten family, a giraffe accidentally picked their toddler up out of the bed of their truck when they were visiting the Fossil Rim Wildlife Center on June 1.
KWTX reports that park visitors get to drive themselves along a path where exotic and endangered animals roam free at the center.
Visitors are also allowed to feed the animals.
The family said Paisley, 2, was in the back of the pickup truck with her mom feeding the animals when the giraffe grabbed her shirt and lifted the little girl into the air.
Paisley’s father, Jason Toten, said the incident was caught on video by a car behind them.
“We stopped to feed the giraffes and I turned around to look out the back window,” he said. “That’s when I saw the giraffe kind of digging around and then it just grabbed her.”
According to the Toten family, it appeared to be a complete accident and they didn’t break any rules.
“Paisley was holding the bag, and the giraffe went to go get the bag, not her, but it ended up getting her shirt too and picked her up,” Toten said.
Thankfully, Paisley didn’t get too high up before the giraffe dropped her.
“As soon as she went up, her mom yelled, ‘Hey!’ and the giraffe let go,” Toten said.
Paisley’s father said she ended up falling into her mother’s arms without anyone getting hurt, but it still was a scary moment.
“My heart stopped, my stomach dropped … it scared me,” Toten said.
Afterward, Toten said they went to the gift shop and got Paisley a toy giraffe because “she deserved it.”
The family said they do plan on returning to the park in the future.
According to the wildlife center, visitors are allowed to ride in the bed of a truck if an adult is riding in the back with them and everyone is safely inside the vehicle.
Copyright 2024 KWTX via Gray Media Group, Inc. All rights reserved.

Victim, Richland officer both speak out after officer relieved of duties for making ‘derogatory slurs’

Oil worker killed during storms in Simpson County

Child killed in ATV accident in Moss Point

Cause of death revealed for Grammy-winning artist Mandisa

They were collecting aluminum cans. Then they found a body.
Latest news.

Study finds common low-calorie sweetener may be linked to heart attacks, strokes
Allie gordon, kennedy carruth leave legacy at belhaven.

Toddler dies after being hit by SUV at gas station, officials say

Over 1.2 million rechargeable lights are under recall for fire hazards, following one reported death

Emergency rabies treatments leave many paying thousands of dollars out of pocket
This browser is no longer supported.
Upgrade to Microsoft Edge to take advantage of the latest features, security updates, and technical support.
Troubleshooting connection quality in Azure Virtual Desktop
- 2 contributors
If you experience issues with graphical quality in your Azure Virtual Desktop connection, you can use the Network Data diagnostic table to figure out what's going on. Graphical quality during a connection is affected by many factors, such as network configuration, network load, or virtual machine (VM) load. The Connection Network Data table can help you figure out which factor is causing the issue.
Addressing round trip time
In Azure Virtual Desktop, latency up to 150 ms shouldn’t impact user experience that doesn't involve rendering or video. Latencies between 150 ms and 200 ms should be fine for text processing. Latency above 200 ms may impact user experience.
In addition, the Azure Virtual Desktop connection depends on the internet connection of the machine the user is using the service from. Users may lose connection or experience input delay in one of the following situations:
- The user doesn't have a stable local internet connection and the latency is over 200 ms.
- The network is saturated or rate-limited.
To reduce round trip time:
Reduce the physical distance between end-users and the server. When possible, your end-users should connect to VMs in the Azure region closest to them.
Check your network configuration. Firewalls, ExpressRoutes, and other network configuration features can affect round trip time.
Check if something is interfering with your network bandwidth. If your network's available bandwidth is too low, you may need to change your network settings to improve connection quality. Make sure your configured settings follow our network guidelines .
Check your compute resources by looking at CPU utilization and available memory on your VM. You can view your compute resources by following the instructions in Configuring performance counters to set up a performance counter to track certain information. For example, you can use the Processor Information(_Total)\% Processor Time counter to track CPU utilization, or the Memory(*)\Available Mbytes counter for available memory. Both of these counters are enabled by default in Azure Virtual Desktop Insights. If both counters show that CPU usage is too high or available memory is too low, your VM size or storage may be too small to support your users' workloads, and you'll need to upgrade to a larger size.
Optimize VM latency with the Azure Virtual Desktop Experience Estimator tool
The Azure Virtual Desktop Experience Estimator tool can help you determine the best location to optimize the latency of your VMs. We recommend you use the tool every two to three months to make sure the optimal location hasn't changed as Azure Virtual Desktop rolls out to new areas.
My connection data isn't going to Azure Log Analytics
If your Connection Network Data Logs aren't going to Azure Log Analytics every two minutes, you'll need to check the following things:
- Make sure you've configured the diagnostic settings correctly .
- Make sure you've configured the VM correctly.
- Make sure you're actively using the session. Sessions that aren't actively used won't send data to Azure Log Analytics as frequently.
For more information about how to diagnose connection quality, see Connection quality in Azure Virtual Desktop .
Coming soon: Throughout 2024 we will be phasing out GitHub Issues as the feedback mechanism for content and replacing it with a new feedback system. For more information see: https://aka.ms/ContentUserFeedback .
Submit and view feedback for
Additional resources
IMAGES
VIDEO
COMMENTS
Round Trip Time (ms) is the time taken for traffic from users' devices to reach Cloud PC and return. This metric is an indicator of the quality of the connection and can be used to determine the user's experience. Values displayed are the median time and 95th percentile value of the most recent reading of the metric (p95 Last).
Round-trip time (RTT) is the duration in milliseconds (ms) it takes for a network request to go from a starting point to a destination and back again to the starting point. RTT is an important metric in determining the health of a connection on a local network or the larger Internet, and is commonly utilized by network administrators to ...
The round-trip time (RTT) from the client's network to the AWS Region that the WorkSpaces are in should be less than 100ms. If the RTT is between 100ms and 200ms, the user can access the WorkSpace, but performance is affected. If the RTT is between 200ms and 375ms, the performance is degraded. If the RTT exceeds 375ms, the WorkSpaces client ...
So, if you've got an effective round-trip time of 50 ms to the server and select "200 ms latency" you can expect a reply to a request within 250 ms (plus the processing overhead on the server). Share. Improve this answer. ... Round-trip time (RTT) is the time it takes for a packet to go from the sending endpoint to the receiving endpoint and ...
The time it takes for this to happen is reported as the round-trip time in ms. The round-trip min/avg/max mean that among all the ping tests, the fastest only took 1 ms, the longest took 8 ms, and the average of all the test times was 2 ms. You may have had multiple tests which took 8 ms, but none took more than 8 ms. Of course, these numbers ...
Key Terminology. Round Trip Time (RTT): It is the time it takes for a signal or packet to travel from a source to a destination and back to the source. RTT includes propagation, transmission, and processing delays and is measured in milliseconds (ms). Latency: It refers to the time delay experienced in a network communication, often measured as the RTT.
Round-Trip Time is a network performance metric representing the time it takes for a data packet to travel from the source to the destination and back to the source. It is often measured in milliseconds (ms) and is a crucial parameter for determining the quality and efficiency of network connections. To understand the concept of RTT, imagine ...
Factors Influencing RTT. Actual round trip time can be influenced by: Distance - The length a signal has to travel correlates with the time taken for a request to reach a server and a response to reach a browser.; Transmission medium - The medium used to route a signal (e.g., copper wire, fiber optic cables) can impact how quickly a request is received by a server and routed back to a user.
Latency (RTT or round-trip time) below 100ms. For Microsoft Teams, the transmission time of a packet from the PC to the Microsoft server and back again should be under 100ms.If the latency occasionally exceeds this value, this doesn't necessarily mean that stable audio and video performance is no longer possible.
In telecommunications, round-trip delay (RTD) or round-trip time (RTT) is the amount of time it takes for a signal to be sent plus the amount of time it takes for acknowledgement of that signal having been received. This time delay includes propagation times for the paths between the two communication endpoints. In the context of computer networks, the signal is typically a data packet.
Round-Trip Time. Round Trip Time (RTT) - the total time it takes for a packet of data to be sent from a source to a destination and then back to the source and often used as an indicator of network latency, which is the time it takes for data to travel from one point to another in a network. ... (MAPI), used by Microsoft Outlook/Exchange. High ...
This network propagation delay is tied to physical distance between the two points and the speed of light, including extra overhead taken by the various routers in between. Latency is measured as one-way or Round-trip Time (RTT). Packet Loss This is often defined as a percentage of packets that are lost in a given window of time. Packet loss ...
Round-trip time (RTT) in networking is the interval it takes a network request to go from a source to a destination and back. It is expressed in milliseconds (ms). RTT is influenced by propagation, transmission, processing, and queueing delays. Low RTT is preferred for responsive network applications, while high RTT can cause sluggishness.
Last Updated : 13 Apr, 2023. RTT (Round Trip Time) also called round-trip delay is a crucial tool in determining the health of a network. It is the time between a request for data and the display of that data. It is the duration measured in milliseconds. RTT can be analyzed and determined by pinging a certain address.
Round trip time (RTT) is the time it takes for a message to reach its destination from a source and then reach back from destination to source. ... Therefore, the total packet transfer time would be 58 ms to transfer 1 KB data packets between the host and switch. 5.2. Packet Time Calculation Based on Throughput. Let's discuss a practical ...
Round Trip Time (RTT) is the length time it takes for a data packet to be sent to a destination plus the time it takes for an acknowledgment of that packet to be received back at the origin. The RTT between a network and server can be determined by using the ping command. This will output something like: In the above example, the average round ...
For round-trip time in TCP or ICMP tests, the threshold is 750 milliseconds (ms). For the checks-failed percentage, the threshold is 10 percent. Indeterminate: No data in the Log Analytics workspace. Check the metrics. Not Running: Disabled by disabling the test group. Data collection, analysis, and alerts
Get your guide and take the immediate steps to optimize the Microsoft Teams experience. Free to download! Microsoft Teams Metrics Latency One-Way or Ping In Millisecond and Round-Trip Latency (In Millisecond Too) It measures the time taken to send a data packet from point A to B and come back.
GLEN ROSE, Texas (KWTX/Gray News) - A family in Texas says they went through quite the scare when recently visiting a wildlife center.According to the Toten family, a giraffe accidentally picked their toddler up out of the bed of their truck when they were visiting the Fossil Rim Wildlife Center on June 1.
The trip by Butch Wilmore and Suni Williams […] CAPE CANAVERAL, Fla. (AP) — Boeing launched astronauts for the first time Wednesday, belatedly joining SpaceX as a second taxi service for NASA.
Users may lose connection or experience input delay in one of the following situations: The user doesn't have a stable local internet connection and the latency is over 200 ms. The network is saturated or rate-limited. To reduce round trip time: Reduce the physical distance between end-users and the server. When possible, your end-users should ...