David Lozzi
- Debugging Safari/Chrome on your iPhone/iPad/iOS device

In the world of modern web development, Web 2.0 (or is it 3.0?), with HTML5, CSS3, ES6, and frameworks and libraries up the wazoo, our web apps and sites always work seamlessly and flawlessly across all the browsers and devices… hahaha, I know…
The reality is, web development, as great and modern as it is, can have little caveats and nuances across the different browsers: Chrome, Safari, FireFox, Edge, and the Mac/Windows/Linux/iOS/Android versions of each. Thankfully, the big contenders like Netscape (those were the days) and Internet Explorer have finally been deprecated and are no longer expected to be supported in the wild. Even with the great modern web, we still have issues once in a while.
In my recent efforts in troubleshooting one small “nuance” between Chrome on Mac and Chrome and Safari on iOS (yes, all three were acting differently), I needed to debug my browser on my iPad and/or iPhone. I won’t get into what the issue is here, instead, I’ll get into how we can debug the browsers on our iOS devices. I’ve searched for many options, some worked, some didn’t, so below is what worked for me.
All steps below are all running on my:
- MacBook Pro 16-inc, M1 Pro, running macOS Ventura 13.6
- iPad Air (4th) v15.3.1
- iPhone 14 Pro Max iOS v17.0.3

What are we debugging
Before we get started in debugging, we should cover what we’re debugging. In the following debugging methods, we can debug anything our browser can get to: netflix.com, google.com, or our public website. With CI/CD in place, I can make code changes and get them into my dev environment in under 5 minutes, and that suffices at times. I can then hit the site directly on my iPhone and debug as needed.
Sometimes, if I’m really diving into a granular issue and don’t want to wait, I like to use ngrok. Ngrok spins up a gateway from a public address to your local dev machine. This allows me to troubleshoot realtime on my mobile browser while writing the code on my laptop. It’s pretty slick and has saved me a lot of time. I can even share the ngrok address with my colleagues and they can access it on my local machine too! Another option would be to set up DNS for your iPhone to navigate to your laptop while on the same wifi network, and that’s not worth the effort in my book.
Debugging in Chrome on iOS
This is great quick way to check out your console messages without using your Mac.
- In Chrome on your iPad or iPhone, go to chrome://inspect and then press Start Logging .
- Now go do your thing in another tab, keeping this tab open.
- Come back anytime to see any and all console outputs!
See, no laptop/desktop needed, just do it on the mobile device.
This is as far as we can get with Chrome on iPhone/iPad. From my limited understanding, Chrome for iOS uses a WKWebView which gets difficult to actually attach to and debug. If the JavaScript console output isn’t enough, try Safari…
Debugging in Safari on iOS
This is a great method of debugging your iOS devices as it gives you the closest thing to actually debugging on your computer. With this method you can use the dev tools on your Mac to connect to your iOS Safari browser. It’s pretty sweet.
- On your Mac , open Safari, then go to Safari > Settings.
- Click Advanced and click Show Develop menu in menu bar at the bottom of the window. Close the window.
- On your iPad or iPhone , go to Settings > Safari > Advanced.
- Scroll to the bottom and enable Web Inspector .
For this next part, I recommend using a USB cable to attach your iOS device to your Mac. You might get away with doing this over Wifi, as I have in the past, but it’s not reliable .
- Connect your device to your Mac using a USB cable, or try the following over Wifi.
- On your Mac, in Safari, click the Develop menu.
- Near the top of the menu you should see your iPad or iPhone listed.
- Hover over your device in the menu and you’ll see Safari with each tab listed below. Click the one you want to debug.
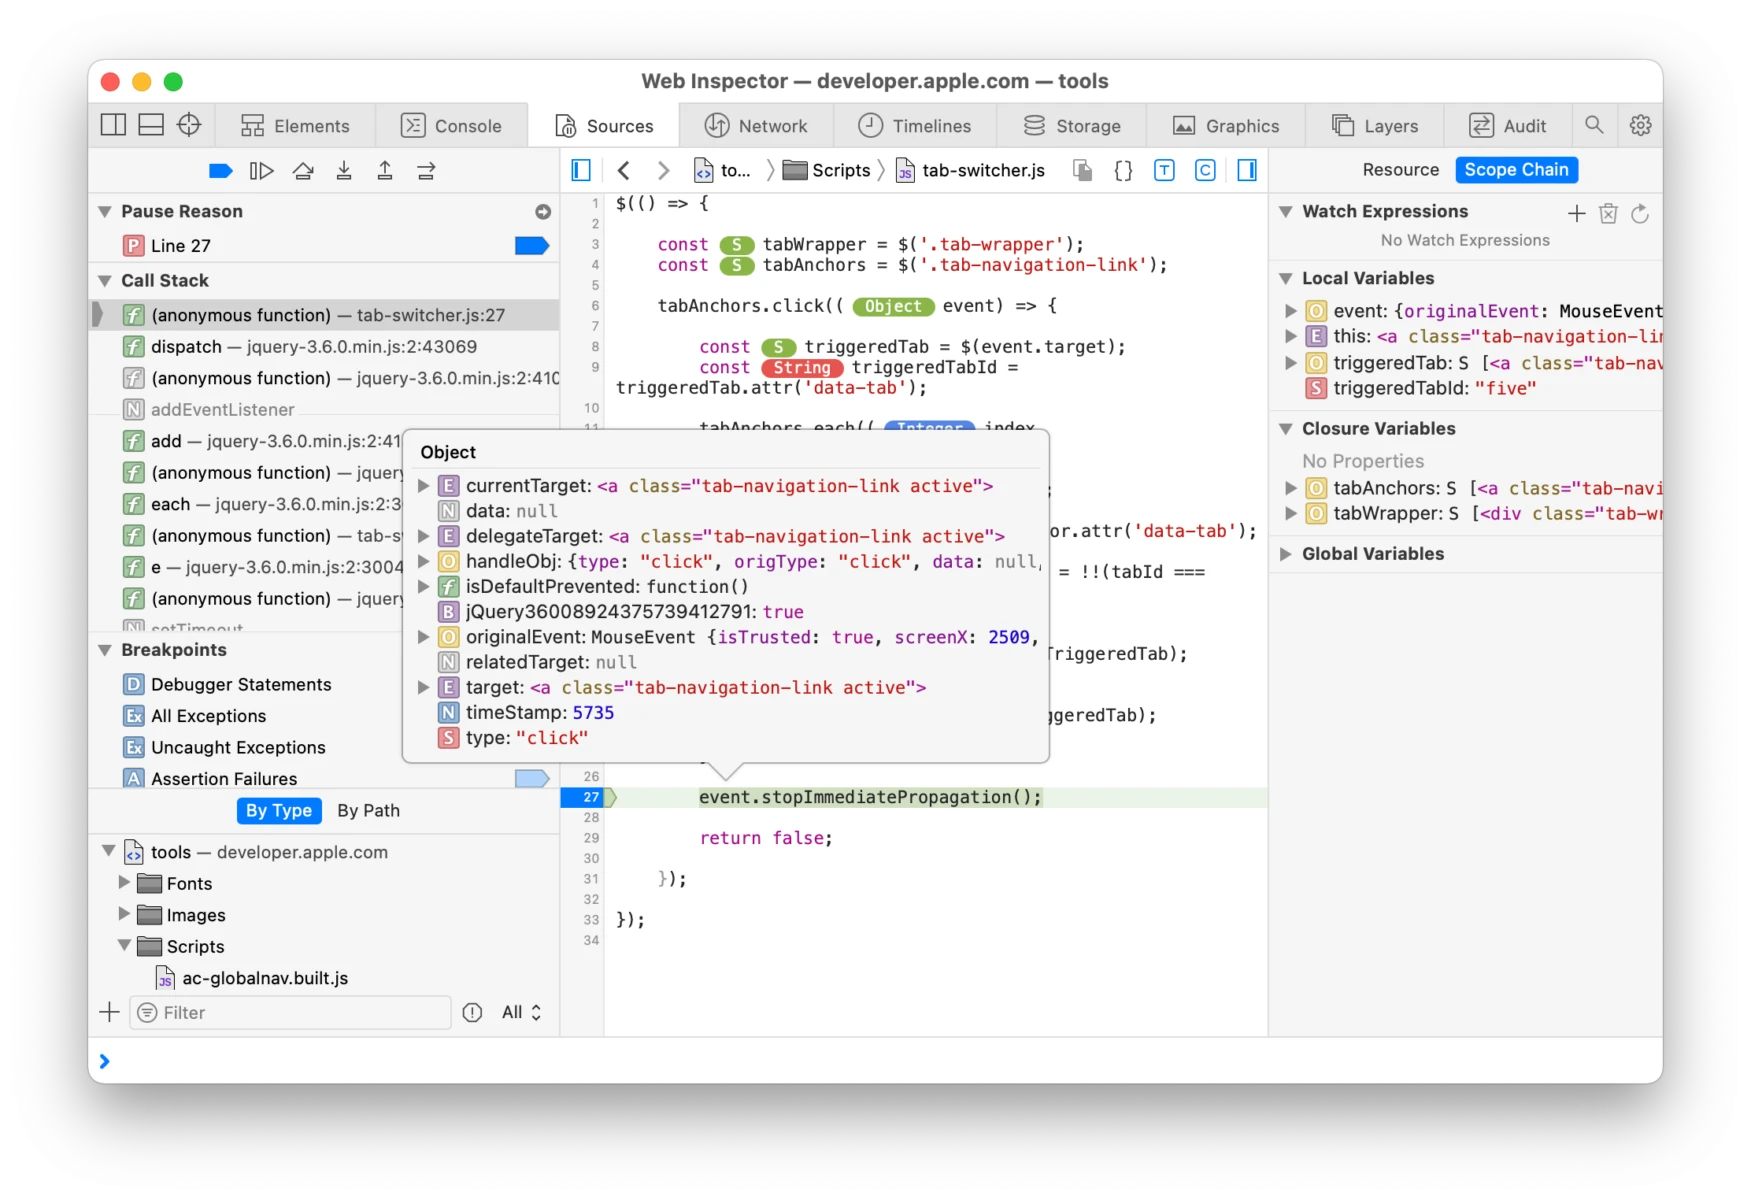
- The Web Inspector should then appear, now debug it: Elements, Console, Sources, Network, all of it should work!
Good enough for now
Between these two techniques, I’ve been able to troubleshoot my issues quite successfully. Generally, iOS Safari and Chrome act relatively the same, so debugging in Safari helps me clear my Chrome issue. And if it doesn’t I can always throw in more console.log s and see what Chrome is actually doing. Ideally, we should be able to debug the code directly on Chrome, like we can do with Safari, but at this time it’s just not possible.
One other option, for a cost: inspect.dev
There’s a product called inspect.dev that boasts it can debug Safari, Webviews, and Chrome from macOS, Windows, and Linux. Learn more at https://inspect.dev/why . I have not tried them out, I don’t want to pay for something that should be free for developers (hence this blog post).
Let me know if you know other ways to debug your mobile browsers! Leave a comment below or let’s connect on Twitter .
‘Til next time, happy debugging!
Please share the love!
- Click to share on Twitter (Opens in new window)
- Click to share on Facebook (Opens in new window)
- Click to share on LinkedIn (Opens in new window)
- Click to email a link to a friend (Opens in new window)
- Click to print (Opens in new window)
- Click to share on Reddit (Opens in new window)
- Click to share on Pocket (Opens in new window)
- Click to share on WhatsApp (Opens in new window)
7 thoughts on “ Debugging Safari/Chrome on your iPhone/iPad/iOS device ”
You should also check out using x-code’s simulator. Safari Dev Tools can attach to the Safari session on the simulator and you’re off to the races!
Oh yea, i just found that and then forgot that… thanks I’ll check it out closer and share my findings!
Thanks for article. One small correction Chrome for iOS uses WKWebView.
Thanks for the fix! will update
- Pingback: [FIXED] The image is taking the original dimentions of it on the phone after deployment - Learn How to FIX your angular code
Thanks bro! I’ll follow yours steps, wish me luck.
Leave a Reply Cancel reply
- Collaboration
- Microsoft Forms
- Microsoft Planner
- Microsoft Power Apps
- Microsoft Power Automate (Flow)
- Microsoft Teams
- Microsoft To-Do
- Office 365 Hybrid
- Office 365 SharePoint Online
- Productivity
- SharePoint 2013 Administration
- SharePoint 2013 Apps
- SharePoint 2013 Development
- SP2010 Administration
- SP2010 Authentication
- SP2010 Customization
- SP2010 Infrastructure
- SP2010 User
- SP2010 Workaround
- Uncategorized
- Users Don't Like SharePoint
Top Posts & Pages
- Sending a beautifully formatted email from Power Automate (Flow)
- Saving data from Microsoft Forms into Excel using Power Automate (Flow)
- Use Microsoft Forms to collect data right into your Excel file
- Squeezing a little more formatting out of Microsoft Forms
- npm install and the package-lock.json file
- When Power Automate (Flow) can't find your Microsoft Form
- Tracking usage analytics within your Power Apps
- Best practices for working with data in Microsoft PowerApps
- Posting to Teams with Power Automate (Flow): Incoming Webhook verses Teams - Post Message
- Stack Overflow

- 2,089,443 hits
Discover more from David Lozzi
Subscribe now to keep reading and get access to the full archive.
Type your email…
Continue reading
- Irresistible Tech Gifts for That Special Dad
- Killer Smartphone Deals We Love
How to Activate the iPhone Debug Console or Web Inspector
Use Safari's web developer tools to study problematic websites
:max_bytes(150000):strip_icc():format(webp)/ScottOrgera-f7aca23cc84a4ea9a3f9e2ebd93bd690.jpg)
- Saint Mary-of-the-Woods College
- Switching from Android
What to Know
- Activate Web Inspector on iOS: Go to Settings > Safari > Advanced and move the Web Inspector toggle switch to the On position.
- Use Web Inspector on macOS: Connect your iOS device to a Mac and choose the URL to inspect from the Develop menu.
If you run into a bug or another issue with a website on Safari mobile, use the Web Inspector tool to investigate. This article explains how to use the Safari console for iPhone to debug errors with the help of your Mac computer. Instructions apply to iPhones with iOS 14, iOS 12, or iOS 11, and well as Macs with macOS Big Sur (11.0), macOS Catalina (10.15), or macOS Mojave (10.14).
Activate Web Inspector on Your iPhone or Other iOS Device
The Web Inspector is disabled by default since most iPhone users have no use for it. However, if you're a developer or you're curious, you can activate it in a few short steps. Here's how:
Open the iPhone Settings menu.
On an iPhone with an early version of iOS, access the Debug Console through Settings > Safari > Developer > Debug Console . When Safari on the iPhone detects CSS, HTML, and JavaScript errors, details of each display in the debugger.
Scroll down and tap Safari to open the screen that contains everything related to the Safari web browser on your iPhone, iPad, or iPod touch.
Scroll to the bottom of the page and select Advanced .
Move the Web Inspector toggle switch to the On position.
Connect Your iOS Device to Safari on a Mac
To use the Web Inspector, connect your iPhone or another iOS device to a Mac that has the Safari web browser and enable the Develop menu .
With Safari open, select Safari from the menu bar and choose Preferences .
Select the Advanced tab.
Select the Show Develop menu in menu bar check box and close the settings window.
From the Safari menu bar, select Develop and choose the name of your attached iOS device, then select the URL that appears under Safari to open the debug console for that site.
After you connect your device, use your Mac to inspect the website you want to debug and have it open in the Safari mobile browser.
What Is Web Inspector?
Web developers use Web Inspector to modify, debug, and optimize websites on Macs and iOS devices. With Web Inspector open, developers can inspect the resources on a web page. The Web Inspector window contains editable HTML and notes regarding the styles and layers of the web page in a separate panel.
Before iOS 6, the iPhone Safari web browser had a built-in Debug Console that developers used to find web page defects. Recent versions of iOS use Web Inspector instead.
With Safari 9 and OS X Mavericks (10.9), Apple introduced Responsive Design Mode in Web Inspector. Developers use this built-in simulator to preview how web pages scale to different screen sizes, resolutions, and orientations.
To set up Web Inspector on your iPad, open your iPad's Settings and select Safari > Advanced , then turn Web Inspector On . Connect the iPad to a Mac computer, then open Safari on the Mac and select Safari > Preferences > Advanced , then turn on Show Develop menu in menu bar .
You cannot just connect your iPhone to a Windows PC and start using Web Inspector through Chrome like you can with a Mac. Installing package manager software can provide you a sort of workaround, but it's not recommended unless you're familiar with the package management app you intend to use.
Get the Latest Tech News Delivered Every Day
- Add More Features by Turning on Safari's Develop Menu
- 4 Ways to Play Fortnite on iPhone
- How to Activate and Use Responsive Design Mode in Safari
- How to Change the Default Search Engine in Chrome for iOS
- What Is Safari?
- How to Inspect an Element on a Mac
- How to Use Web Browser Developer Tools
- How to Disable JavaScript in Safari for iPhone
- How to View HTML Source in Safari
- How to Manage History and Browsing Data on iPhone
- How to Clear Search History on iPhone
- How to Reset Safari to Default Settings
- How to Change Your Homepage in Safari
- The Top 10 Internet Browsers for 2024
- 10 Hidden Features in macOS Sonoma
- How to Manage Cookies in the Safari Browser
How to use Safari Web Inspector on Mac, iPad, and iPhone
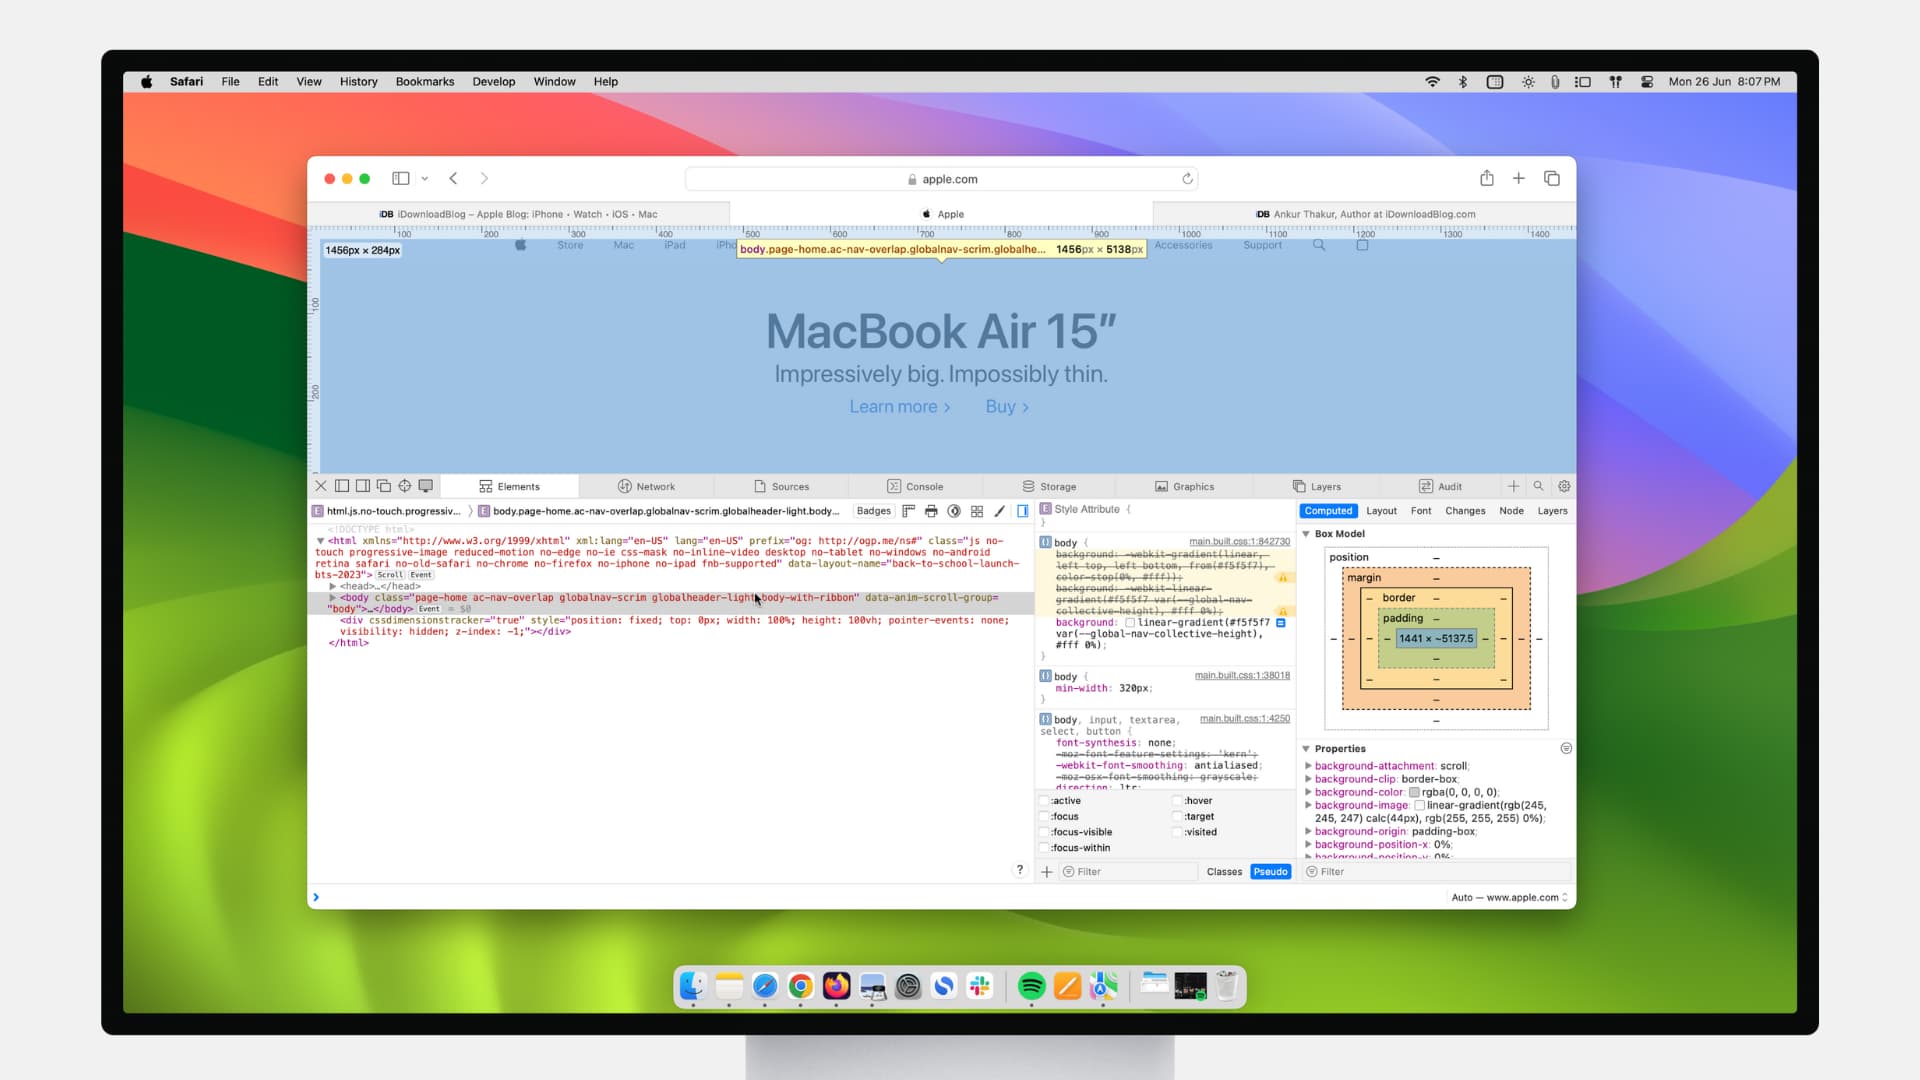
If you’re a web developer, then you likely already know about Safari’s Web Inspector. But if you’re just starting to use Safari for development or have just begun your Web Development career, this guide will show you the basics for getting started with the Safari Web Inspector on iOS and Mac.
What is the Safari Web Inspector?
For those not yet familiar with the tool, you can use the Safari Web Inspector for help with your web development. It allows you to review page elements, make changes, troubleshoot problems, and review page performance. Apple sums it up with:
Web Inspector is the primary web development tool in Safari. Web Inspector allows you to inspect, tweak, debug, and analyze the performance of your web content in a Safari tab.
Enable and open Safari Web Inspector
You can use the Safari Web Inspector for development on your iPhone, iPad, or Mac. Here’s how to enable and open it on iOS and macOS so you’re ready to use it when you need it.
If you’re going to use the Web Inspector frequently, whether for iOS or Mac, you might as well add the Develop tab to your menu bar so you can access it easily.
- Open Safari on your computer and click Safari > Settings or Preferences from the menu bar.
- Choose the Advanced tab.
- Check the box at the bottom for “ Show features for web developers ” or Show Develop menu in menu bar .
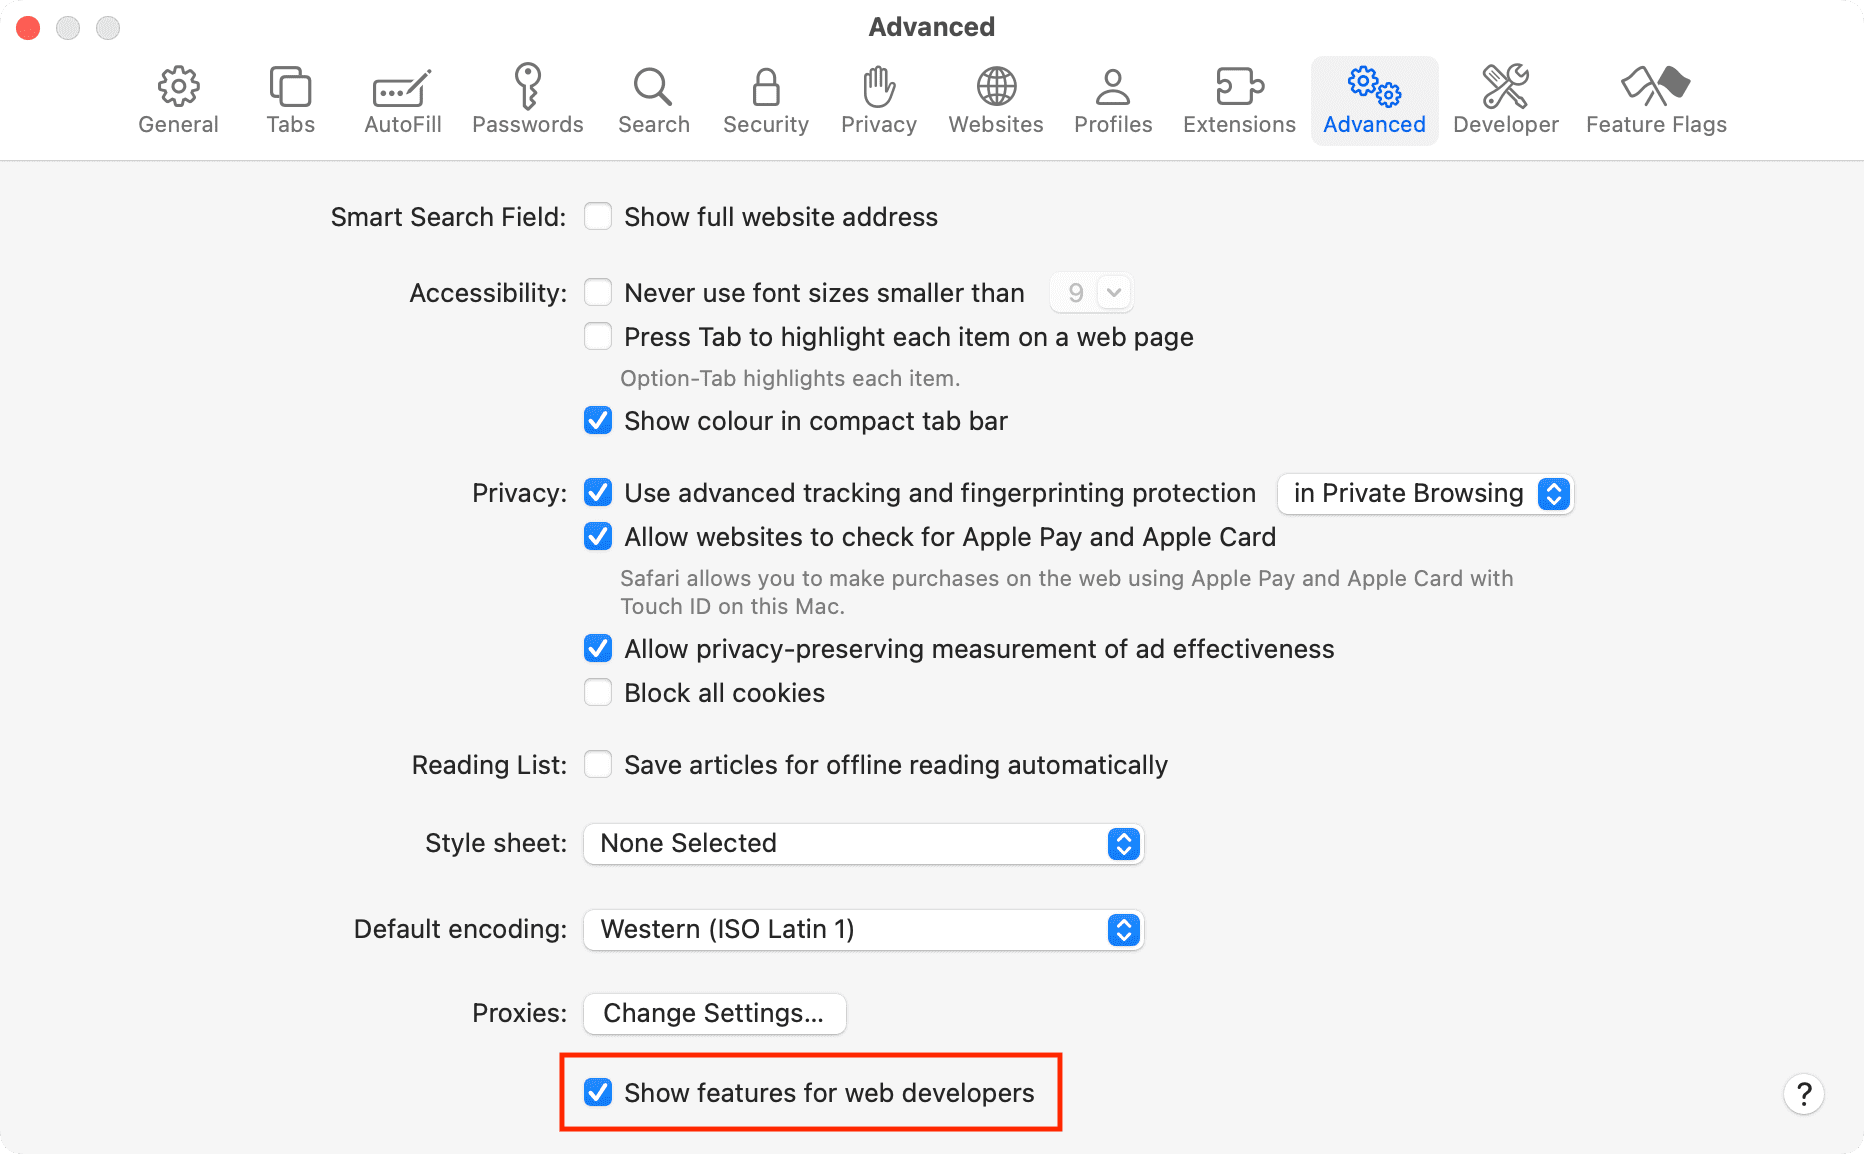
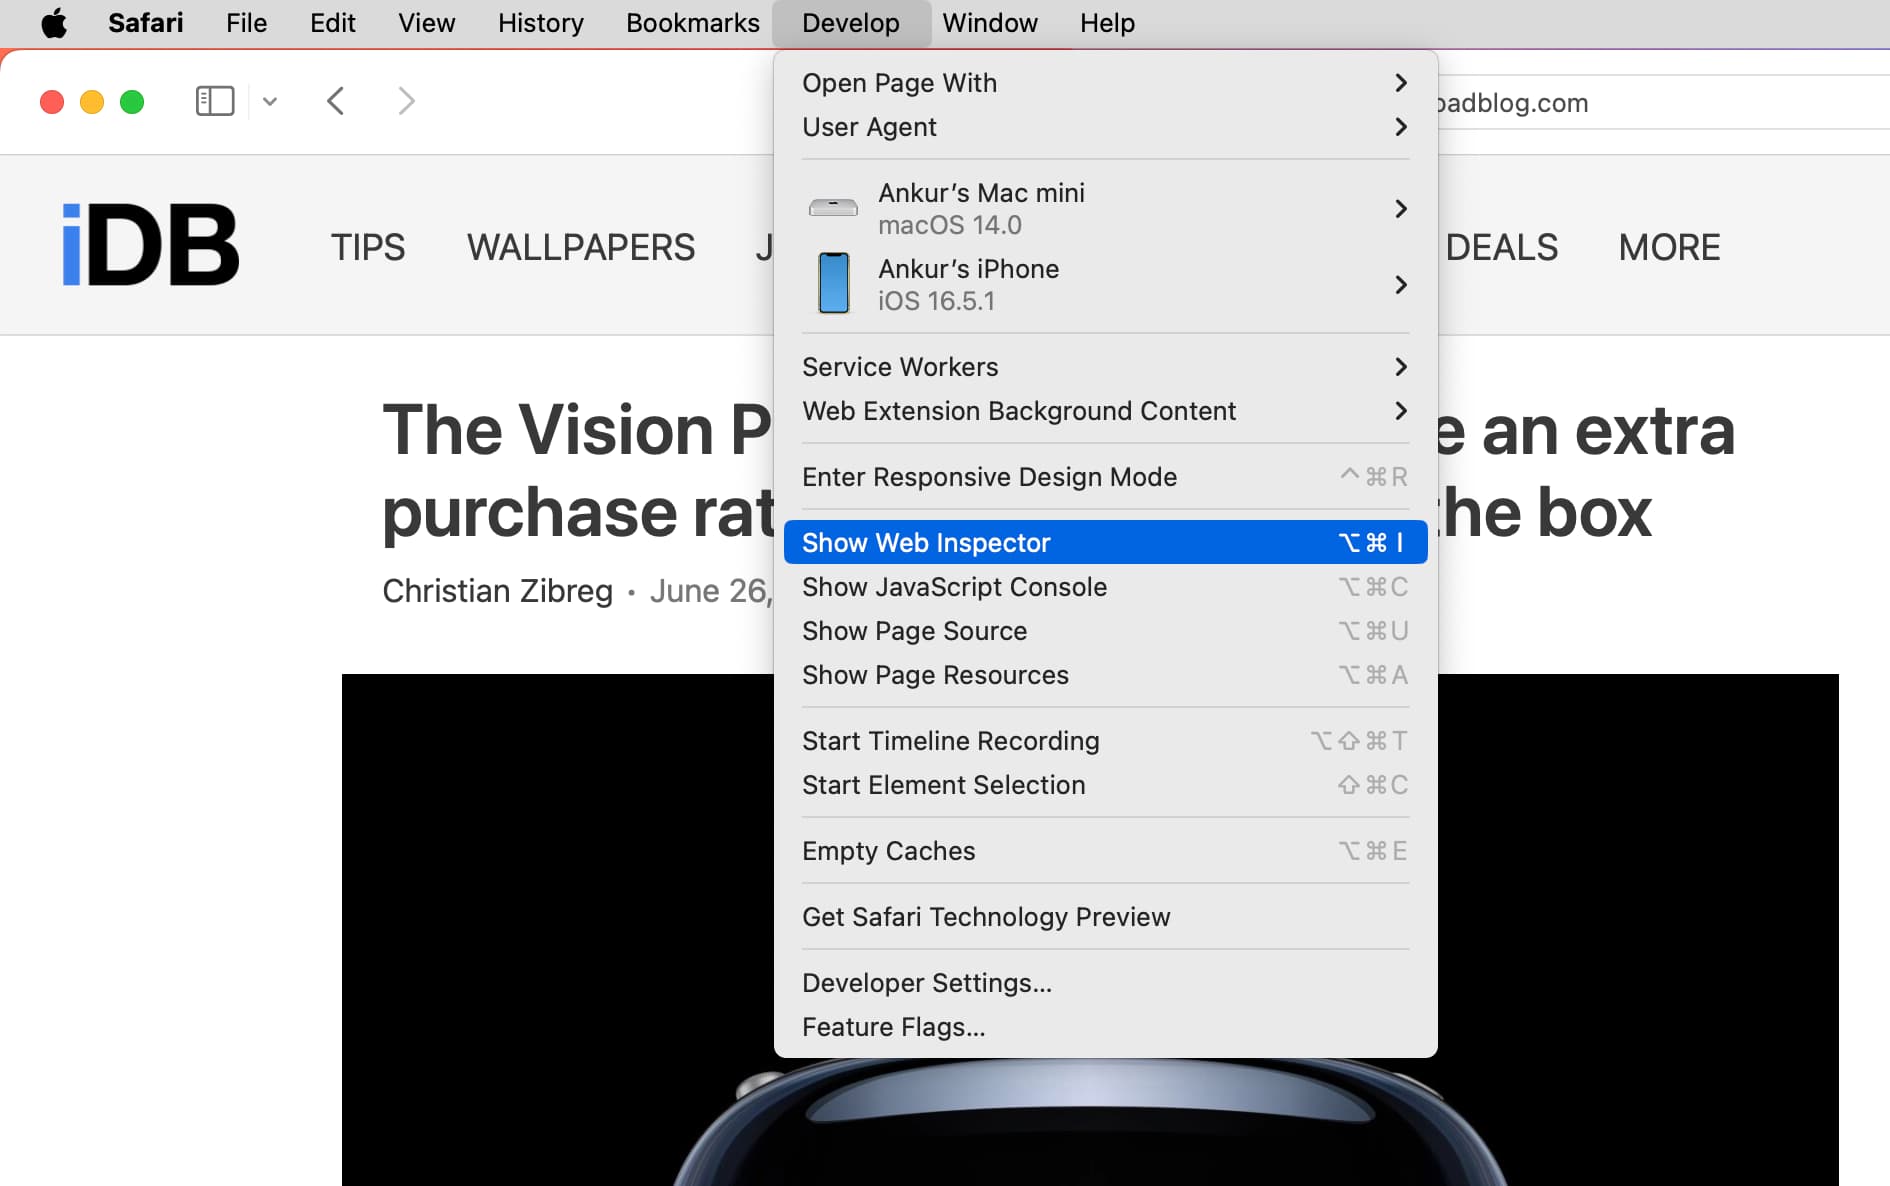
Now when you want to enable the Web Inspector, click Develop > Show Web Inspector from your menu bar.
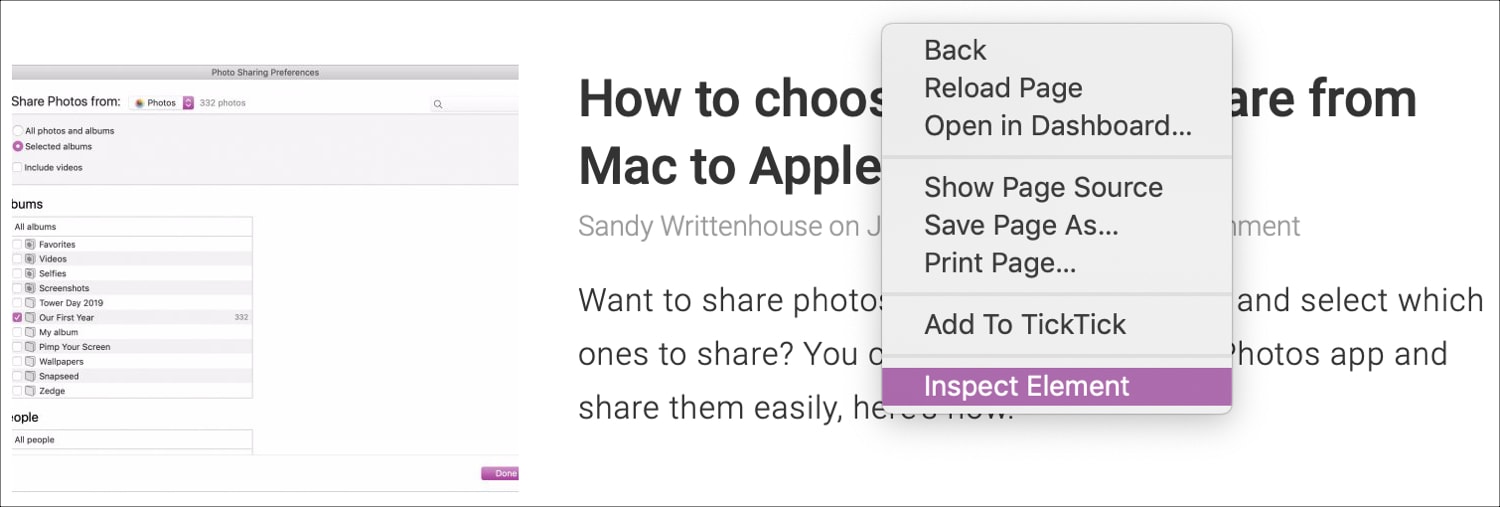
If you prefer to forgo adding the Develop button to your menu bar, you can access the Web Inspector on Mac with a shortcut. Navigate to the page you want to inspect, right-click on it, and pick Inspect Element from the context menu.
Just keep in mind that if you plan to use Web Inspector for Safari on your iOS device, you’ll need the Develop button in the menu bar on your Mac.
For iPhone and iPad
To use the Web Inspector for iOS on your Mac, grab your USB cable and connect your iPhone or iPad to your computer. Then, follow these steps to enable the tool:
- Open the Settings app on your iPhone or iPad and tap Safari .
- Scroll to the bottom and tap Advanced .
- Enable the toggle for Web Inspector .
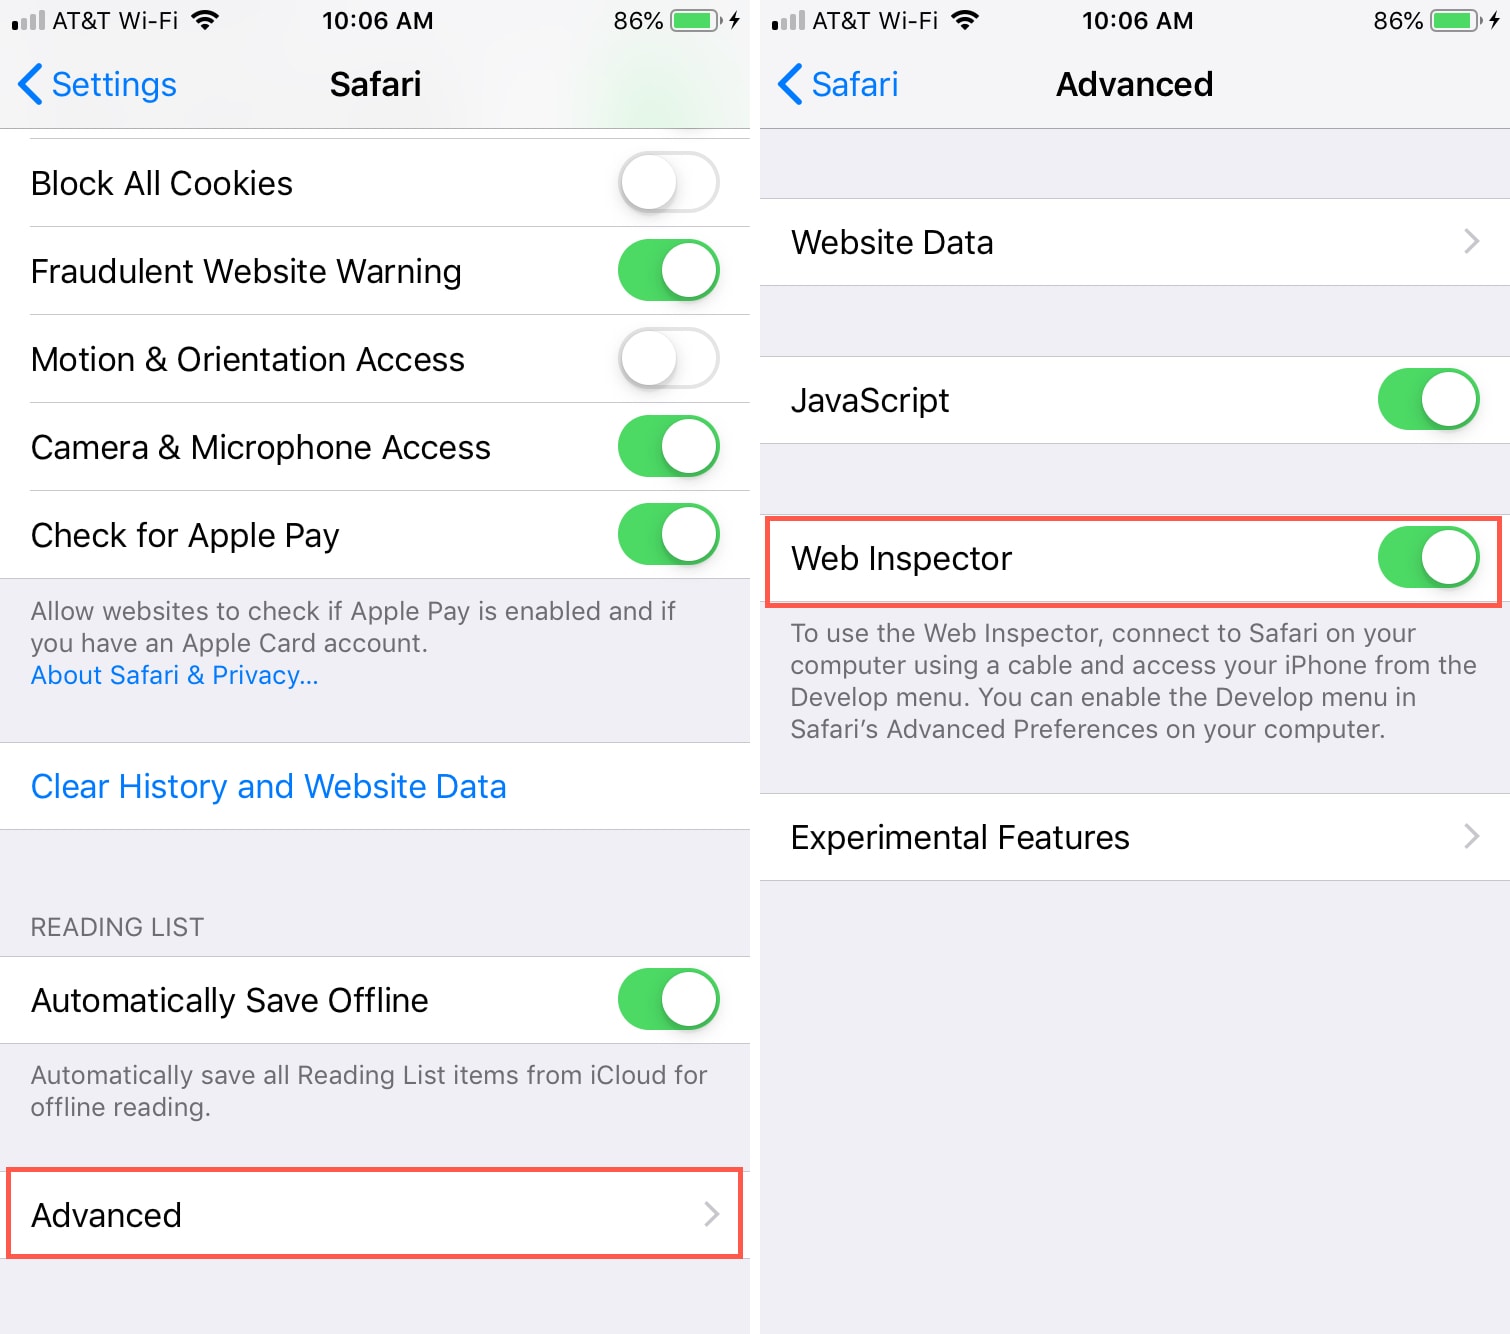
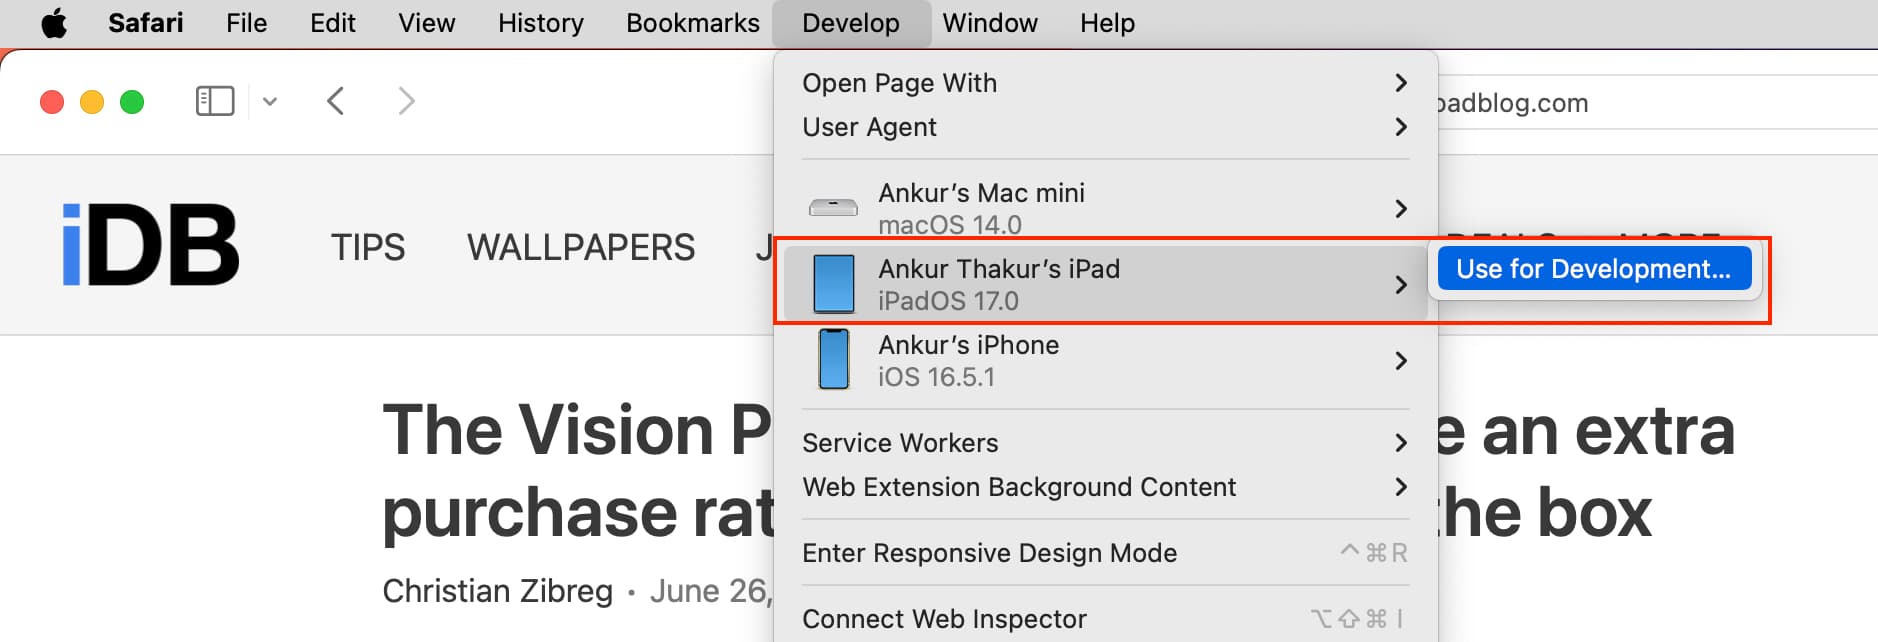
Next, make sure Safari is open on your iOS device and your Mac. After that, follow these steps:
1) Click Develop from the Safari menu bar on Mac, and you’ll see your iPhone or iPad listed here.

2) Mouse over the device, and you’ll then see the websites open in Safari on your mobile device.
3) Select the one you want, and the Web Inspector will pop open in a new window for you to use.

Note: If this is the first time you’re using your iPhone or iPad for this work, take your mouse cursor over that iPhone or iPad and click Use for Development . Next, tap Trust on your iPhone or iPad and enter the device passcode. Now, this iOS or iPadOS device is ready to be used for web inspection. If it still shows a correction error, simply unplug the USB cable and plug it in again.
Position the Safari Web Inspector
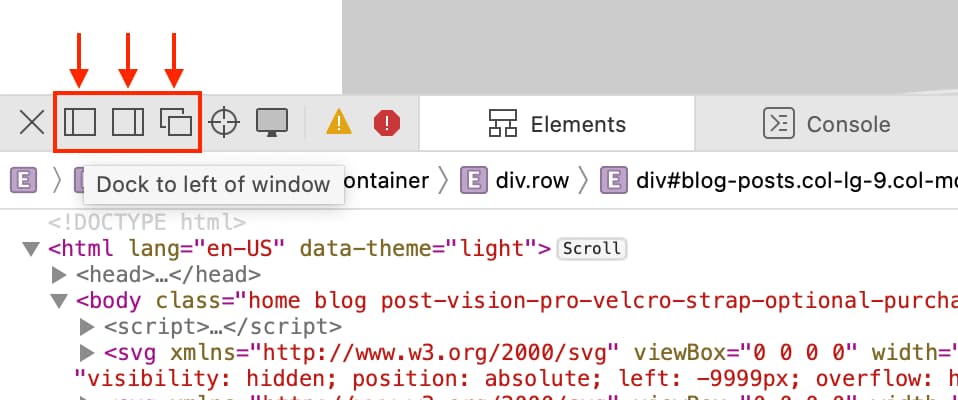
If you’re using the Web Inspector for iOS, it will remain in its own floating window.
If you’re using it for Safari on your Mac, you can change its position. By default, Web Inspector displays at the bottom of your Safari window. To detach it and place it in a separate window or dock it to the left or right side of Safari, select one of the buttons from the top left of the Inspector window.
Get to know the Web Inspector
The Safari Web Inspector has a handy toolbar and tabs with some options that you can adjust to fit your needs.
Web Inspector toolbar
- “X” to close the Inspector
- Positioning buttons
- Reload button
- Download web archive button
- Activity viewer (resource count, resource size, load time, logs, errors, warnings)
- Element selector button
Web Inspector tabs
You can use all tabs or just a few. You can right-click or hold Control and click the tabs and then check and uncheck those you want to see. Rearrange the tabs by holding and dragging them to their new positions. And all the way to the right of the tabs bar, you’ll see a Settings button. This lets you adjust settings for tabs, indents, source maps, zoom, and more.

- Elements : Current state of the page’s Document Object Model
- Network : Resources loaded by the current page
- Debugger : View the JavaScript execution, variables, and control flow
- Resources : Resources being used by the current page’s content
- Timelines : A view of what the page’s content is doing
- Storage : State that is available to the page’s content
- Canvas : Contexts created from CSS
- Console : Shows logged messages and lets you evaluate JavaScript code
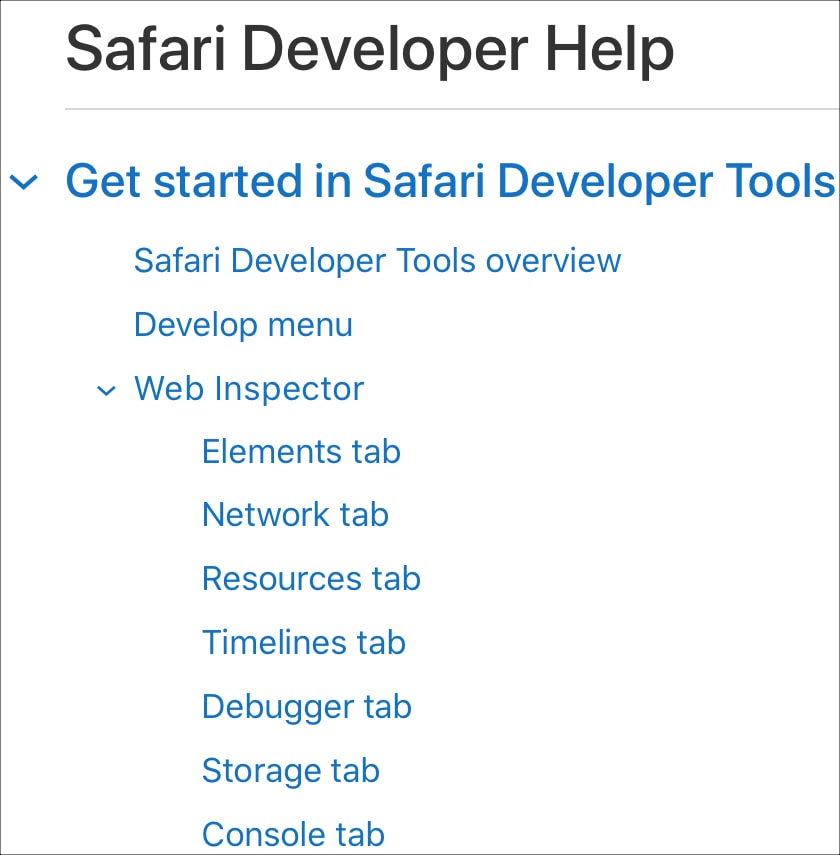
For in-depth help on a specific tab, you can head to the Apple Developer Support site . Select Table of Contents > Get started in Safari Developer Tools > Web Inspector .
Good luck with your inspection!
Hopefully, this guide will help you as you start working with the Safari Web Inspector for your iPhone, iPad, or Mac web development.
If you currently use the Web Inspector and have tips and tricks you’d like to share with others who are just starting, please feel free to comment below!
Check out next: How to view the source code of a webpage in Safari
How To Inspect In Safari On IPad

- Software & Applications
- Browsers & Extensions

Introduction
Safari Inspector is a powerful tool that allows you to inspect, debug, and modify webpages directly from your iPad. Whether you're a web developer, designer, or simply curious about how websites are built, Safari Inspector provides a window into the inner workings of the web.
With the increasing use of iPads for web browsing and content creation, having the ability to inspect and modify webpages directly on the device is invaluable. Safari Inspector empowers users to delve into the structure and behavior of web content, making it an essential tool for anyone involved in web development or design.
In this article, we will explore the ins and outs of using Safari Inspector on iPad. From opening the Inspector to utilizing its powerful tools for inspecting and modifying elements, we will guide you through the process of harnessing the full potential of this feature. Whether you're a seasoned developer or a novice enthusiast, understanding how to leverage Safari Inspector on iPad can enhance your web experience and deepen your understanding of web technologies.
So, grab your iPad, launch Safari, and let's embark on a journey to uncover the hidden layers of the web with Safari Inspector.
Opening Safari Inspector on iPad
To begin our exploration of Safari Inspector on iPad, let's first uncover how to open this powerful tool. Safari Inspector is seamlessly integrated into the Safari browser , allowing users to access it with just a few taps. Here's how to open Safari Inspector on your iPad:
Launch Safari : Start by opening the Safari browser on your iPad. Safari Inspector is a built-in feature, so there's no need to download or install anything extra.
Navigate to the Webpage : Once Safari is open, navigate to the webpage you want to inspect. Whether it's a personal blog, a news site, or an e-commerce platform, Safari Inspector allows you to peek behind the curtain of any webpage.
Access the Inspector : With the webpage loaded, tap the address bar at the top of the Safari browser. Next, select the "Share" icon, which resembles a square with an arrow pointing upwards. This action will reveal a menu of options.
Select "Inspect" : From the menu, scroll to the right until you see the "Inspect" option. Tap on "Inspect," and voila! Safari Inspector will open, presenting you with a wealth of tools and information to delve into the webpage's structure and functionality.
By following these simple steps, you can easily open Safari Inspector on your iPad and begin your journey into the world of web development and design. The ability to inspect and modify webpages directly on your iPad empowers you to gain a deeper understanding of how websites are built and how they function. Now that we've opened Safari Inspector, let's dive into the array of tools and features it offers for inspecting and modifying elements on a webpage.
Using Safari Inspector Tools
Safari Inspector equips you with a robust set of tools designed to facilitate the inspection, debugging, and modification of web content directly from your iPad. Let's delve into the diverse array of tools at your disposal and explore how each one empowers you to gain insights into the inner workings of webpages.
Elements Tab
The Elements tab serves as your window into the structure of the webpage. It presents a hierarchical view of the HTML elements that compose the page, allowing you to inspect and manipulate individual elements. By tapping on specific elements within the Elements tab, you can view and modify their attributes, styles, and content, providing a comprehensive understanding of the webpage's structure.
Console Tab
The Console tab is a powerful tool for debugging JavaScript, logging messages, and executing JavaScript commands directly within the context of the webpage. It enables you to identify errors, test scripts, and interact with the webpage's functionality in real time. The Console tab serves as a valuable resource for diagnosing and resolving issues related to JavaScript execution and behavior.
Sources Tab
The Sources tab provides access to the underlying sources of the webpage, including HTML, CSS, and JavaScript files. It allows you to inspect, debug, and modify these sources, providing a comprehensive view of the webpage's codebase. With the ability to set breakpoints, step through code, and analyze network activity, the Sources tab empowers you to gain deep insights into the inner workings of the webpage's code.
Network Tab
The Network tab offers visibility into the network activity associated with the webpage, including requests, responses, and loading times for various resources. It enables you to analyze network performance, identify potential bottlenecks, and optimize the loading speed of the webpage. By examining network requests and responses, you can gain a comprehensive understanding of the webpage's resource utilization and enhance its overall performance.
Application Tab
The Application tab provides access to various aspects of the webpage's application functionality, including local storage, session storage, cookies, and cache data. It allows you to inspect and modify these application resources, providing insights into how the webpage manages and stores data locally. The Application tab is instrumental in understanding and manipulating the application-specific aspects of the webpage.
By leveraging these powerful tools within Safari Inspector, you can gain a comprehensive understanding of the structure, behavior, and performance of webpages directly from your iPad. Whether you're debugging JavaScript, optimizing network performance, or inspecting the underlying codebase, Safari Inspector equips you with the tools needed to unravel the intricacies of web development and design.
Inspecting Elements on a Webpage
Inspecting elements on a webpage is a fundamental aspect of web development and design, and Safari Inspector on iPad provides a seamless and intuitive interface for this essential task. By delving into the Elements tab within Safari Inspector, you gain the ability to explore the underlying structure of a webpage, inspect individual elements, and modify their attributes and styles. This process not only facilitates debugging and troubleshooting but also offers valuable insights into the composition and layout of web content.
Upon accessing the Elements tab, you are presented with a hierarchical view of the HTML elements that constitute the webpage. Each element, such as headings, paragraphs, images, and buttons, is displayed within a structured tree, reflecting its position and relationships within the document object model (DOM). By tapping on specific elements within this tree, you can inspect a wealth of information, including the element's attributes, styles, dimensions, and content.
Inspecting individual elements unveils a treasure trove of details that empower you to understand how the webpage is constructed. You can view and modify attributes such as IDs, classes, data attributes, and event listeners, providing the flexibility to manipulate the behavior and appearance of elements. Additionally, the Styles pane within the Elements tab allows you to explore the CSS styles applied to each element, including properties such as color, font size, margins, and positioning. This insight into the styling of elements enables you to diagnose layout issues, experiment with design modifications, and ensure visual consistency across the webpage.
Furthermore, Safari Inspector facilitates the inspection of the box model, which illustrates the dimensions and spacing of elements within the layout. By examining the content, padding, borders, and margins of elements, you can gain a comprehensive understanding of their spatial relationships and fine-tune the visual presentation of the webpage.
In essence, inspecting elements on a webpage using Safari Inspector empowers you to unravel the intricacies of web content, from its structural composition to its visual styling. Whether you're troubleshooting layout inconsistencies, experimenting with design variations, or gaining insights into the underlying HTML and CSS, Safari Inspector provides a user-friendly and powerful platform for inspecting and modifying elements directly from your iPad. This capability not only enhances your proficiency in web development and design but also fosters a deeper appreciation for the craftsmanship behind every webpage you encounter.
Modifying and Debugging CSS and JavaScript
Modifying and debugging CSS and JavaScript directly from your iPad is a game-changer, and Safari Inspector empowers you to seamlessly delve into the styles and scripts that shape the visual and interactive aspects of webpages. By leveraging the powerful tools within Safari Inspector, you can not only inspect but also modify and debug CSS and JavaScript, providing a comprehensive platform for refining the visual presentation and functionality of web content.
Modifying CSS
The Styles pane within the Elements tab of Safari Inspector allows you to directly modify CSS styles applied to individual elements. By tapping on specific style properties, such as color, font size, margins, or positioning, you can experiment with real-time modifications and witness their immediate impact on the webpage's appearance. This dynamic approach to modifying CSS empowers you to fine-tune the visual presentation, troubleshoot layout issues, and iterate on design variations directly from your iPad.
Debugging JavaScript
The Console tab within Safari Inspector serves as a robust environment for debugging JavaScript directly within the context of the webpage. By logging messages, executing JavaScript commands, and identifying errors, you can gain insights into the behavior and execution of JavaScript scripts. Additionally, the ability to set breakpoints, step through code, and inspect variables provides a comprehensive toolkit for diagnosing and resolving JavaScript-related issues. Whether you're troubleshooting interactive features, testing script functionality, or analyzing runtime behavior, Safari Inspector equips you with the tools needed to debug JavaScript with precision and efficiency.
Real-time Experimentation
One of the most compelling aspects of modifying and debugging CSS and JavaScript within Safari Inspector is the real-time nature of the process. As you make adjustments to CSS styles or diagnose JavaScript behavior, the changes are immediately reflected on the webpage, allowing you to experiment, iterate, and refine with unparalleled immediacy. This real-time experimentation fosters a dynamic and iterative approach to web development and design, enabling you to fine-tune the visual and interactive aspects of web content with agility and precision.
In essence, Safari Inspector on iPad provides a comprehensive platform for modifying and debugging CSS and JavaScript, empowering you to refine the visual presentation and interactive behavior of webpages directly from your device. Whether you're fine-tuning styles, diagnosing script errors, or experimenting with design enhancements, Safari Inspector offers a seamless and powerful environment for shaping the digital experiences that define the web.
In conclusion, Safari Inspector on iPad serves as a gateway to the inner workings of the web, offering a wealth of tools and features that empower users to inspect, debug, and modify web content with precision and agility. By seamlessly integrating into the Safari browser, Safari Inspector provides a user-friendly and intuitive platform for delving into the structure, behavior, and performance of webpages directly from the iPad.
The ability to open Safari Inspector with just a few taps, navigate through the Elements, Console, Sources, Network, and Application tabs, and leverage the diverse array of tools within each tab underscores the accessibility and power of this feature. Whether you're a seasoned web developer, a budding designer, or simply curious about the mechanics of the web, Safari Inspector offers a window into the craftsmanship and complexity that underpin every webpage.
Inspecting elements on a webpage using Safari Inspector unveils the hierarchical structure of HTML elements, the intricacies of CSS styling, and the spatial relationships defined by the box model. This process not only facilitates troubleshooting and debugging but also fosters a deeper understanding of how web content is constructed and presented.
Furthermore, the ability to modify and debug CSS and JavaScript directly from the iPad elevates the Safari Inspector experience to a dynamic and iterative endeavor. Real-time experimentation with CSS styles and JavaScript behavior empowers users to refine the visual presentation and interactive features of web content with unparalleled immediacy and precision.
In essence, Safari Inspector on iPad transcends the traditional boundaries of web development and design, bringing the power of inspection, debugging, and modification to the fingertips of users. Whether you're refining the layout of a personal blog, diagnosing JavaScript errors on an e-commerce platform, or optimizing the performance of a news site, Safari Inspector equips you with the tools and insights needed to unravel the intricacies of web content.
As the landscape of web technologies continues to evolve, Safari Inspector remains a steadfast companion for those seeking to gain a deeper understanding of the web. By embracing the capabilities of Safari Inspector on iPad, users can embark on a journey of exploration, experimentation, and refinement, shaping the digital experiences that define the modern web.
In the ever-evolving ecosystem of web development and design, Safari Inspector stands as a testament to the power of accessibility, innovation, and empowerment, offering a glimpse into the boundless possibilities that await those who dare to inspect, modify, and create on the canvas of the web.
Leave a Reply Cancel reply
Your email address will not be published. Required fields are marked *
Save my name, email, and website in this browser for the next time I comment.
- Crowdfunding
- Cryptocurrency
- Digital Banking
- Digital Payments
- Investments
- Console Gaming
- Mobile Gaming
- VR/AR Gaming
- Gadget Usage
- Gaming Tips
- Online Safety
- Software Tutorials
- Tech Setup & Troubleshooting
- Buyer’s Guides
- Comparative Analysis
- Gadget Reviews
- Service Reviews
- Software Reviews
- Mobile Devices
- PCs & Laptops
- Smart Home Gadgets
- Content Creation Tools
- Digital Photography
- Video & Music Streaming
- Online Security
- Online Services
- Web Hosting
- WiFi & Ethernet
- Browsers & Extensions
- Communication Platforms
- Operating Systems
- Productivity Tools
- AI & Machine Learning
- Cybersecurity
- Emerging Tech
- IoT & Smart Devices
- Virtual & Augmented Reality
- Latest News
- AI Developments
- Fintech Updates
- Gaming News
- New Product Launches
5 Ways to Improve IT Automation
- What is Building Information Modelling
Related Post
Sla network: benefits, advantages, satisfaction of both parties to the contract, what is minecraft coded in, how much hp does a diablo tuner add, what is halo-fi, what is halo lock iphone, related posts.

How To Open Developer Tools In Safari

How To Hard Reload Safari
How To View Page Source On Tablet

Why Does My IPad Keep Shutting Down Safari

Where Is My Safari App
How To Exit Safari On IPad
How To Get Rid Of Split Screen In Safari On IPad

How To Unlink Safari From IPhone To IPad
Recent stories.

What is Building Information Modelling?

How to Use Email Blasts Marketing To Take Control of Your Market

Learn To Convert Scanned Documents Into Editable Text With OCR

Top Mini Split Air Conditioner For Summer

Comfortable and Luxurious Family Life | Zero Gravity Massage Chair

Fintechs and Traditional Banks: Navigating the Future of Financial Services

AI Writing: How It’s Changing the Way We Create Content

- Privacy Overview
- Strictly Necessary Cookies
This website uses cookies so that we can provide you with the best user experience possible. Cookie information is stored in your browser and performs functions such as recognising you when you return to our website and helping our team to understand which sections of the website you find most interesting and useful.
Strictly Necessary Cookie should be enabled at all times so that we can save your preferences for cookie settings.
If you disable this cookie, we will not be able to save your preferences. This means that every time you visit this website you will need to enable or disable cookies again.
Navigation Menu
Search code, repositories, users, issues, pull requests..., provide feedback.
We read every piece of feedback, and take your input very seriously.
Saved searches
Use saved searches to filter your results more quickly.
To see all available qualifiers, see our documentation .
- Notifications You must be signed in to change notification settings
Remotely debugging iOS Safari on Windows and Linux
HimbeersaftLP/ios-safari-remote-debug-kit
Folders and files, repository files navigation, remote debugging ios safari on windows and linux.
Using this project you can debug your websites and web applications running in iOS Safari from a PC running Windows or Linux.
It provides a free and up-to-date alternative to the discontinued remotedebug-ios-webkit-adapter by RemoteDebug and is the spiritual successor to the abandoned webkit-webinspector by Arty Gus . It is a free and open source alternative to inspect.dev.
The setup scripts ( generate.sh or generate.ps1 ) download the latest version of WebKit's built-in WebInspector and patch it to work with the WebSocket ios-webkit-debug-proxy provides and to be compatible with Chromium based browsers.
If you are looking for a more modern, self-contained tool built in Go , check out Hazel's ios-safari-remote-debug .
Requirements for running
- On Windows, it will automatically be downloaded, but you must also install and trust the device in iTunes for it to work
- For Linux, please follow the installation instructions .
- If you have Python or PHP on your system, you don't need to change anything
- If you have Node.JS on your system, just run npm i -g http-server and you're set.
- like Google Chrome, Edge or Opera
- like Epiphany/GNOME Web
Requirements for setup
- On Windows, I suggest using git for Windows in PowerShell
- On Linux, I suggest installing git from your package manager

Instructions
- Clone this repository to your PC
- On Windows, run generate.ps1 . On Linux, run generate.sh .
This will result in the folder WebKit being created inside src . It contains the WebInspector files.
- Plug your iOS device into your PC via USB
- On Windows, open iTunes and mark the iOS device as trusted (pop-up asks for confirmation the first time you connect a new device)
- On the iOS device, confirm that you trust the connection if asked
- Go to Settings->Safari->Advanced->Web Inspector and enable it
- Open the website you want to debug in Safari
- On Windows, run start.ps1 . On Linux, run start.sh . Make sure your iOS device's screen is unlocked.
- The ios-webkit-debug-proxy will show your iOS device's name as connected.
- If you have mutliple pages open or extensions installed, refer to http://localhost:9222/ for the page number that is at the end of the URL
- You should be greeted with the WebInspector and can now debug to your heart's content.
Troubleshooting
- If you get an error like Uncaught (in promise) Error: 'Browser' domain was not found from Connection.js:162 you are trying to inspect a page that is not inspectable (this could be caused by having Safari extensions installed). Refer to http://localhost:9222/ for the available pages and put the correct one at the end of the URL (for example http://localhost:8080/Main.html?ws=localhost:9222/devtools/page/2 ) for inspecting the second page.
- If you get an error like WebSocket connection to 'ws://localhost:9222/devtools/page/1' failed: from InspectorFrontendHostStub.js:68 , try unplugging your device and plugging it back in while the site you want to debug is open in Safari. Once you see the ios-webkit-debug-proxy console window display a message like Connected :9222 to Himbeers iPad (...) , refresh the inspector page inside your browser (do not use the refresh button on the inspector page, refresh the entire site from your browser).
- Two windows will open. One manages the web server and the other one is ios-webkit-debug-proxy .
- Alternatively you can also press Ctrl+C in the web server window
- Press Ctrl+C in the terminal window to exit
Known Issues
- "Events" on the "Timelines" tab don't work
- Canvas content doesn't show on the "Graphics" tab
- Minor style glitches due to Webkit vs. Chromium differences
If you want to see details about how this was made, you can read a detailed explanation in HOW_IT_WORKS.md (note that this document only describes how the very first version of this tool was created and might not be completely up-to-date).
Attribution
- webkit-webinspector for the idea
- ios-webkit-debug-proxy for the ios-webkit-debug-proxy tool
- WebKit for the WebInspector itself
Contributors 6
- PowerShell 36.8%
- JavaScript 34.2%
- Shell 28.0%
How to Use Web Inspector to Debug iOS device
Prerequisites:.
- Please note that a Mac computer is required for this process as Safari's Web Developer is only compatible with Macs
- Make sure Safari on your Mac is the same version as Safari on your iDevice. You may need to update your iOS version or your version of Safari running on your Mac.
Use Web Inspector to debug mobile Safari
- On your iPad, iPhone or iPod touch, tap Settings | Safari | Advanced and toggle on Web Inspector. And enable JavaScript if it isn’t already enabled.
- On your Mac, launch Safari and go to Safari menu | Preferences | Advanced then check 'Show Develop menu in menu bar' if not already enabled.
- Connect your iOS device to your Mac with the USB cable. This is critical, you must connect the devices manually, using a cable. This does not work via WiFi.
- On your iOS device, open the website that you want to debug. Then, on your Mac, open Safari and go to the 'Develop' menu. You should now see your iOS device that is connected to your Mac. (Note: If you do not have any page open on your iDevice, you see a message saying “No Inspectable Applications.”)
- Now debug the page that is open on your mobile Safari using the same methods you would for debugging on Mac.
- Within the developer tools window, navigate to the 'Network' tab and export the .har file if requested.
- https://support.apple.com/guide/safari-developer/welcome/mac
- https://appletoolbox.com/2014/05/use-web-inspector-debug-mobile-safari/
- https://developer.apple.com/library/archive/documentation/AppleApplications/Conceptual/Safari_Developer_Guide/GettingStarted/GettingStarted.html

Cookie Consent Manager
General information, required cookies, functional cookies, advertising cookies.
We use three kinds of cookies on our websites: required, functional, and advertising. You can choose whether functional and advertising cookies apply. Click on the different cookie categories to find out more about each category and to change the default settings. Privacy Statement
Required cookies are necessary for basic website functionality. Some examples include: session cookies needed to transmit the website, authentication cookies, and security cookies.
Functional cookies enhance functions, performance, and services on the website. Some examples include: cookies used to analyze site traffic, cookies used for market research, and cookies used to display advertising that is not directed to a particular individual.
Advertising cookies track activity across websites in order to understand a viewer’s interests, and direct them specific marketing. Some examples include: cookies used for remarketing, or interest-based advertising.
Cookie List

A Step-by-Step Guide Debug Mode on iPad
The iPad is a powerful device that can be used for a variety of tasks, from multimedia consumption to gaming to business applications. But sometimes, things don’t work as expected and you need to debug your iPad. That’s where debug mode comes in.
Debug mode allows developers and advanced users to access the inner workings of the iPad and troubleshoot problems. It provides access to system logs, application logs, and other diagnostic information that can help identify what is causing a problem. Debug mode also enables logging to the Xcode console so developers can view detailed information about their applications and track down bugs quickly.
To enable debug mode on an iPad, go to Settings > Security & Privacy and scroll down to the bottom of the page. There you will find Developer Mode which can be enabled by turning on the toggle switch. After you have done that, restart your device so that the changes take effect.
Once debug mode is enabled on your iPad, you will be able to use various tools such as Xcode console logging or web inspector on Safari browser for debugging purposes. With these tools, you will be able to locate exactly where a particular problem is occurring in your application or system logs so that it can be corrected quickly and efficiently.
Debugging an iPad requires some technical knowledge but it is not impossible for those who are willing to learn the basics of how this process works. With debug mode enabled, you can take full control over your device and identify any problems that may arise quickly and easily without having to call in professional help every time something isn’t working as expected.
Enabling Debug Mode on an iPad
In order to enable debug mode on an iPad, you will need to access the device’s Security & Privacy settings. To do so, go to Settings > Security & Privacy and scroll to the bottom of the section. You will see a toggle labeled “Developer Mode” – switch this toggle on. A security warning will appear prompting for confirmation – select “OK” and then restart your device. Once your iPad has restarted, debug mode will be enabled and you can begin debugging your apps.
Debugging Mode in iOS
Debug mode in iOS allows developers to see detailed logs of various Tapjoy actions, such as sessions, placements, purchases, custom events, etc., that appear in the Tapjoy Developer Console. This setting also enables logging into the Xcode console to help developers better debug their apps and troubleshoot any issues they may be having. Enabling this setting, it allows developers to investigate potential issues more quickly and with more accuracy.
Opening Debug in iOS
To open debug in iOS, you will need to connect your iOS device to a Mac machine. Then, enable the Web Inspector option in your device’s Settings > Safari menu. After that, open the desired web page in your mobile Safari browser. Finally, enable the Develop menu on your Mac machine. Once this is done, you will be able to debug and preview your web page on the iOS device.
Activating Developer Mode on an iPad
Yes, there is a Developer Mode available on iPads. To access it, go to Settings > Privacy & Security and scroll down to the Developer Mode list item. You can then toggle the “Developer Mode” switch to enable it. With Developer Mode enabled, developers can access additional features and settings that are not normally available on iPads.
Using Debug Mode for Troubleshooting
Debug mode is an important feature for software developers and testers, as it allows them to identify errors in the code that could be causing unexpected behavior in the application. Debug mode enables developers to set breakpoints within the code, which allows them to pause the execution of the program at a certain point and inspect its state. This helps them identify mistakes in logic or syntax and get insights into how the program works. Debugging also allows users to monitor variables and track down memory leaks that are slowing down applications. Overall, debug mode helps developers quickly find and fix bugs so they can create better software.
Inspecting an iPad
To inspect an element on an iPad, you need to first enable the Web Inspector in the Settings app. To do this, open the Settings app and select Safari from the list of apps. Then check the “Enable Web Inspector” box and close out of Settings.
Once you have enabled the Web Inspector, open Safari and navigate to the webpage that you want to inspect. When you are on the page, press and hold down on any element for a few seconds until a menu appears. Select “Inspect Element” from this menu and it will open up a Web Inspector window with all of the HTML code for that element. You can then edit or make changes to this code as needed.
Opening Developer Tools in Safari on iPad
In order to open developer tools in Safari on an iPad, you will first need to go into the Settings app and select the Safari tab. From there, you will need to scroll down and select the Advanced option. On this page, you will need to toggle the Web Inspector switch so that it is green and active.
Once this is done, you will need to connect your iPad to your computer using a USB cable. On your computer, open Safari and then access the settings menu. In here, you should be able to find an option for ‘Developer’ which can be used to enable the developer tools feature. Once enabled, you should find your iPad listed under this tab.
By following these steps, you should be able to open developer tools in Safari on an iPad with ease!
Enabling Debugging in Safari
In order to open debugging in Safari, you will need to use the Terminal application. First, open the Terminal application and enter the following command: defaults write com.apple.Safari IncludeInternalDebugMenu 1. This will enable the debug menu in Safari. Once this is done, you will need to relaunch Safari for the changes to take effect. To disable debugging in Safari, use the same command but with a 0 as opposed to a 1 at the end (e.g., defaults write com.apple.Safari IncludeInternalDebugMenu 0). Again, make sure you relaunch Safari afterward for the changes to take effect.
In conclusion, iPad debug mode is a powerful tool that can be used to test and debug native apps on physical iPads. It enables developers to observe Tapjoy actions such as sessions, placements, purchases, and custom events in the Tapjoy Developer Console. Additionally, USB Debugging can be enabled on an Android device in order to view logs in the Xcode console. By utilizing this feature, developers can identify any issues with other applications and ensure they are running optimally.
Related posts:
James Walker

Tips & Tricks
Troubleshooting, enable the safari debug console on iphone & ipad.
Safari for iOS includes an optional debug console to help web developers track down and resolve issues with webpages on iPhone and iPad.
Even better, with the latest versions of iOS it actually uses the same Web Inspector that Safari on desktop does too, meaning if you connect the iPhone or iPad to the computer you can use the Safari debugging tools directly with your iOS or iPadOS device
Older versions of iOS have this capability too, and while not as in inclusive as the desktop Safari debug and developer tools , it’s still useful and is easy to enable or disable on the iPhone and iPad.
Let’s learn how to enable this feature on both new and old versions of iOS, and learn what’s different between the versions as well.
How to Enable & Use Web Inspector in Safari for iPhone & iPad
On modern iOS and iPadOS versions, here’s how Safari web inspector works:
- Open Settings > Safari > Advanced then tap to enable “Web Inspector”
- Connect the iPhone or iPad to a Mac, then go to Safari and enable the developer menu if you haven’t done so by going to Safari > Preferences > Advanced > Show Develop menu bar
- Pull down the “Develop” menu bar and find the iPhone or iPad, and then open the web page you wish to debug
- Safari Web Inspector will open where you can debug and inspect web elements from the iOS or IPadOS device directly in Safari on the Mac
Now as you navigate on the iPhone or iPad you will find the Web Inspector in Safari on the Mac will update.
You can access the debug Console through the Console tab in the web inspector, and you can access the debugger through the Debugger tab. And of course the usual web inspector tools for elements, resources, network, etc, are available to use as well.

You can also use a View Source trick for iOS and iPadOS while you’re on the go, if needed too.
How to Enable Debug Console on Older iOS Versions
If you have an older version of iOS on an older iPhone or iPad, the whole debug experience is on the device and you don’t have the ability to connect it to Safari on a Mac. Nonetheless it’s still quite useful, here’s how it works:
- Launch “Settings” and tap on “Safari”
- Tap on “Advanced”
- Slide “Debug Console” to ON
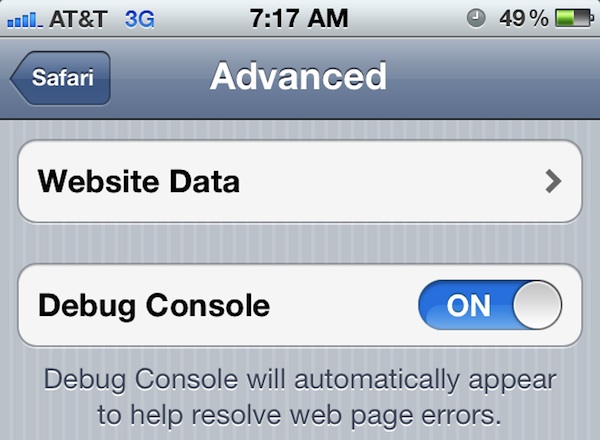
Once enabled, tap on the Debug Console at the top of any Safari screen to see web page errors.
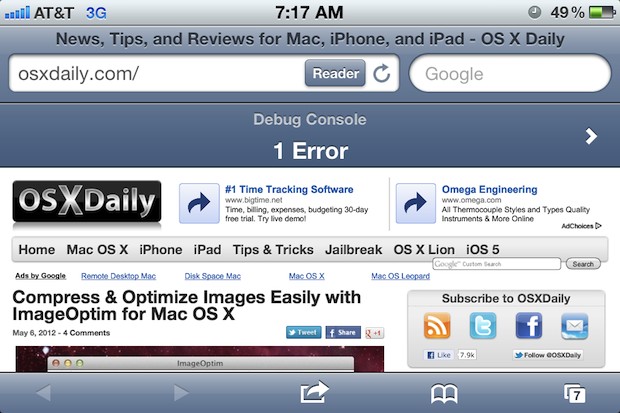
The default list shows all errors, but you can drill down to more specific HTML, JavaScript, and CSS errors by tapping them individually.
Another useful tool for mobile web developers is Firebug Lite for iOS , which utilizes a javascript bookmarklet to load a simpler version of the popular Firebug development tool. That functionality is probably most useful for the older iOS versions as well, since newer releases have new capabilities.
Do you use any web developer tools for iPhone or iPad? Share with us any tips, tricks, apps, or techniques in the comments below.
Enjoy this tip? Subscribe to our newsletter!
Get more of our great Apple tips, tricks, and important news delivered to your inbox with the OSXDaily newsletter.
You have successfully joined our subscriber list.
Related articles:
- Enable Safari Hidden Debug Menu in Mac OS X
- Make Console Easier to Read in Mac OS X with PID, Icons, & Bold View Options
- Enable Mac App Store Hidden Debug Menu
- How to Enable a Hidden Debug Menu in Photo Booth for Mac OS X
» Comments RSS Feed
out dated — no longer accurate
The topmost section is accurate for new iOS versions using Web Inspector, the lower portion is for older versions with Debug Console. Hope that helps!
Leave a Reply
Name (required)
Mail (will not be published) (required)
Subscribe to OSXDaily
- - 15 Keynote Keyboard Shortcuts for iPad
- - How to Install Java on Mac with M3, M2, M1 Apple Silicon Chip
- - Install & Run iTunes, Aperture, or iPhoto in MacOS Sonoma with Retroactive
- - 17 Numbers Keyboard Shortcuts for iPad
- - How to Find a Misplaced Apple Watch with iPhone’s Ping My Watch
- - PSA: Updating to MacOS Sonoma or iOS 17 May Enable iCloud Keychain
- - iOS 17.5.1 & iPadOS 17.5.1 Update Released to Fix Reappearing Deleted Photos Bug
- - MacOS Ventura 13.6.7 & macOS Monterey 12.7.5 Updates Available
- - iOS 16.7.8 & iPadOS 16.7.8 Updates for Older iPhones & iPads Available
- - iOS 17.5 & iPadOS 17.5 Updates Released with Bug Fixes
iPhone / iPad
- - How to Change the Voice of ChatGPT on iPhone, Mac, iPad
- - sysmond on Mac Using High CPU? Here’s the Likely Reason & How to Fix It
- - How to Install VMWare Tools in Windows on VMWare Fusion for Mac
- - How to Factory Reset Mac (MacOS Sonoma & Ventura)
- - How to Fix the Apple Watch Squiggly Line Screen
- - What Does the Number Badge Mean on Microsoft Edge Icon?
- - How to Hide iPhone Keyboard When It’s Covering Buttons & Won’t Go Away

About OSXDaily | Contact Us | Privacy Policy | Sitemap
This website is unrelated to Apple Inc
All trademarks and copyrights on this website are property of their respective owners.
© 2024 OS X Daily. All Rights Reserved. Reproduction without explicit permission is prohibited.
Apple’s Worldwide Developers Conference to kick off June 10 at 10 a.m. PDT with Keynote address
The Keynote will be available to stream on apple.com , the Apple Developer app, the Apple TV app, and the Apple YouTube channel. On-demand playback will be available after the conclusion of the stream.
Why do Safari searches on my iPad appear on the search history on my iMac?
How do I get the searches in Safari on my iPad to NOT appear in the search history in Safari on my iMac?
I assume it simply a setting but can't seem to figure it out.
iMac (M1, 2021)
Posted on Jun 5, 2024 2:27 PM
Loading page content
Page content loaded
Jun 5, 2024 3:18 PM in response to larrybobba
You can turn off Safari in System Settings > iCloud. You will miss out on a lot of its advantages though.
You are using an outdated browser. Please upgrade your browser to improve your experience.
How to use Reader Mode in Safari on iPad

Reader Mode in Safari can help to simplify your reading experience.
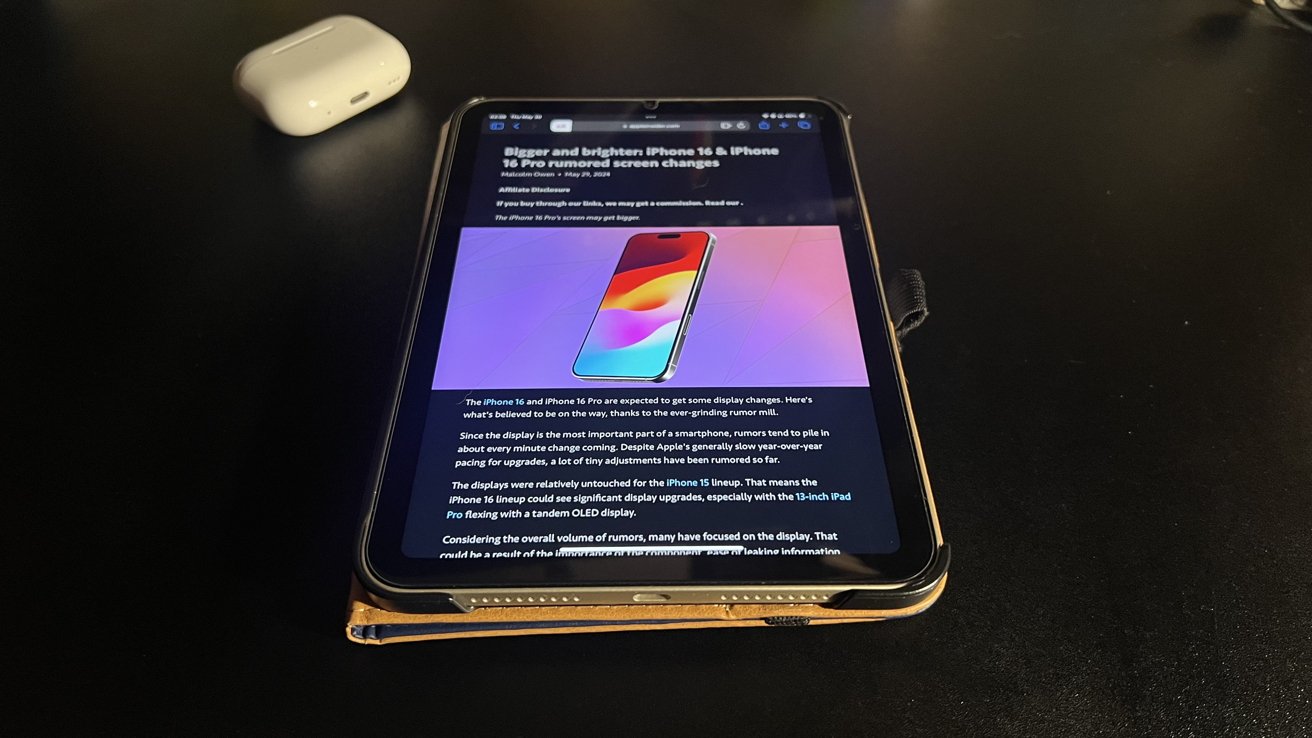
Whatever your reasons may be, something about a website just may not jibe with your eyes, and that is precisely where Reader Mode on Safari comes in. Reader Mode makes getting past this issue a breeze and makes reading articles on your iPad much more pleasant.
How to use Reader Mode in Safari
Actually opening up Reader Mode is very simple, and quite literally requires just two taps. With any largely text-based web page open in Safari, you need only tap on the "Aa" icon in the left-hand side of your address bar. Once that's been tapped, you'll see the option to "Show Reader." Once you've tapped "Show Reader" the web page will convert into a succinct block of text with pictures intact.
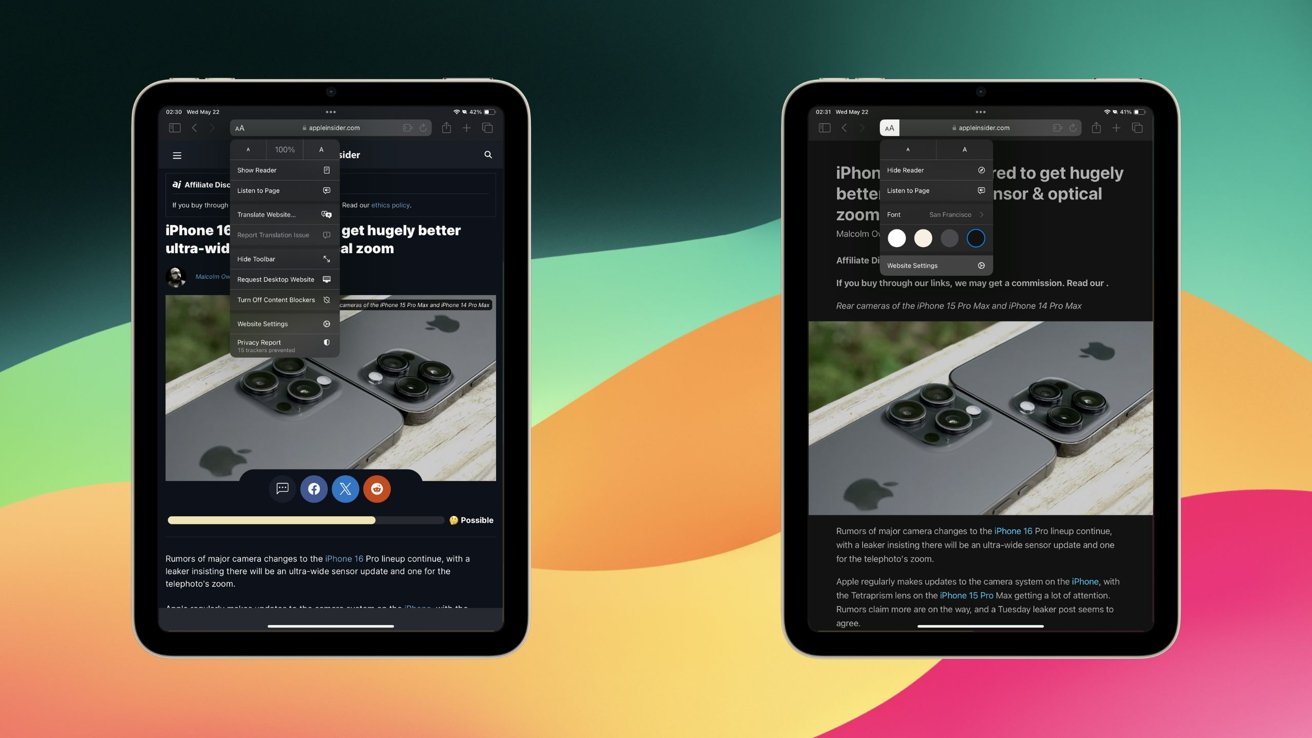
The "Show Reader" option is available on almost every primarily text-based web page. For websites like Instagram or Amazon, Reader Mode wouldn't do anything worthwhile for you even if you could enable it.
When entering Reader Mode, all the ads and suggested content from any given website will be stripped out in favor of a succinct reading experience. With that in mind, there are still some issues you can bump into. Some webpages, despite being mostly text, won't show up properly. In some instances this can be due to how the website is written, and in others it may just be that the text on the page is embedded within an image.
Another issue that can crop is multi-paged articles and how they "cooperate" with Reader Mode. For the most part, Reader Mode will only show you the first page of a multi-paged article when turned on. For these kinds of pages, you will have to turn Reader Mode on and off to progress through the article.
How to customize Reader Mode in Safari
Once you're in Reader Mode, you may find yourself wanting to make a few cosmetic adjustments. Doing so is as simple as returning to the menu you used to open Reader Mode. Once you have the menu opened up, you'll be greeted with a few key options, including:
- Adjusting the font
- Adjusting the font size
- Changing the background color
- Individual website settings
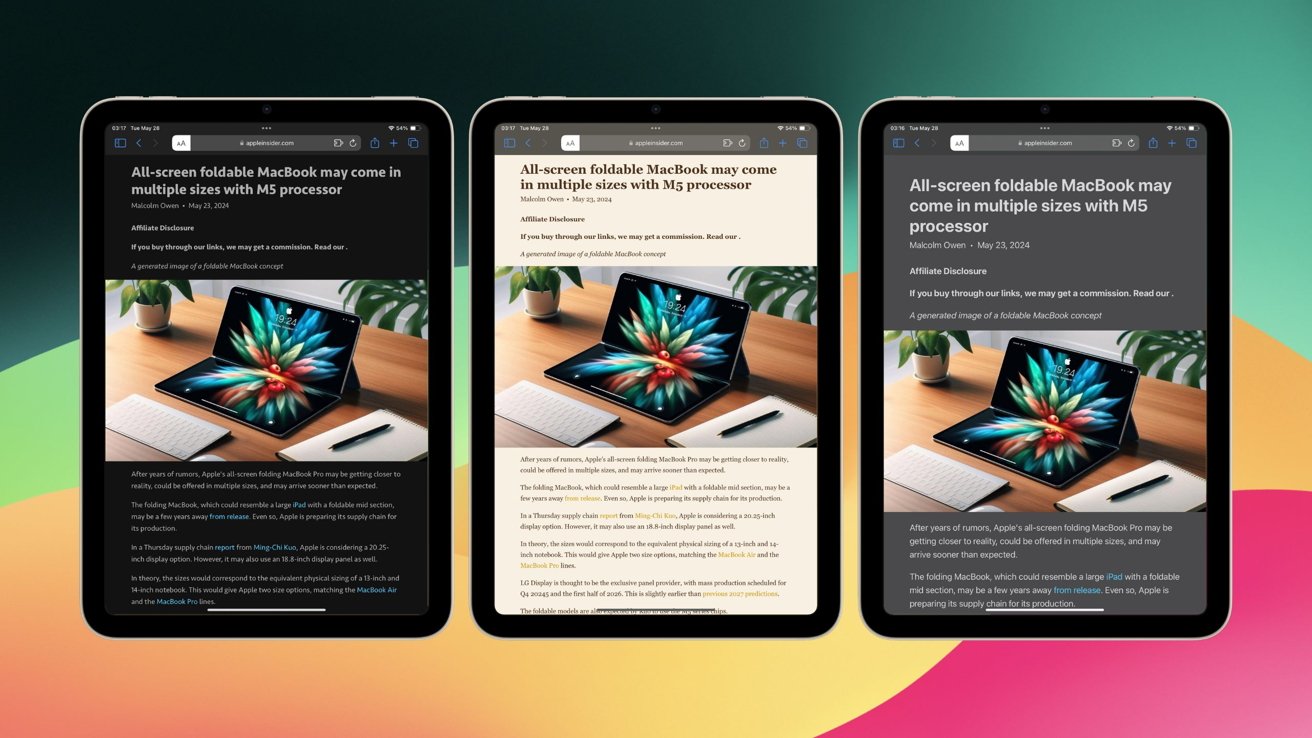
All of these options do exactly what it sounds like they would do. The individual website settings don't offer much that pertains to Reader Mode, but there is one absolutely game changing setting you can enable here.
That setting is "Use Reader Automatically." What this option will do is make it to where Safari automatically displays pages from that website in Reader Mode. Pages that can't normally be viewed in Reader Mode will still show up as normal, but the moment you enter a page that can be viewed in Reader Mode, the change will happen automatically.
With Reader Mode in your arsenal, you'll have a much better reading experience across the web on your iPad.
Do you people even try this feature cause it still doesn't work properly for your site. Kind of hilarious you're telling us how to use a feature that your site does not properly support. Whatever is in your formatting does not show bullet points or other special elements in Reader mode. And has not for months. I even tried emailing you but seems nobody is listening or cares over there. I stopped reading your site because it doesn't support Reader mode properly. For example in this article the 4 bullet points do not show when enabling reader mode.
Top Stories

Apple's best-selling 14-inch MacBook Pro M3 with 16GB RAM is back on sale for $1,599

iOS 18 Mail app will get huge AI enhancements & summarizations with 'Project Blackpearl'

iPad Air (2024) review: Not the cheapest, and not the best, but still great

All of the iPhone 16 Pro Max measurements have been leaked

13-inch iPad Pro review: hardware of the future running software of the past

What to expect from WWDC 2024's week of AI updates
Featured deals.

Apple's latest MacBook Air with M3 chip, 16GB RAM drops to $1,149
Latest news.

Apple's Mail application is getting a massive AI upgrade with Project BlackPearl. Here's how iOS 18 will make your life better, and your working day easier.

Craig Federighi ignited Apple's AI efforts after using Microsoft's Copilot
Despite years of working to develop AI systems, it wasn't until Christmas 2022 when Craig Federighi played with Copilot that the company truly got behind the idea.

Apple needs an AI iPhone fold to stem its increasing decline in China
Analyst Ming-Chi Kuo says that Apple has cut its iPhone component orders by 15% year over year, as users in China increasingly prefer AI and foldable smartphones from Huawei.
How to optimize your MacBook battery life
Features in your MacBook Pro and MacBook Air, along with good user practices, can help optimize your battery's lifespan and health - whether you leave it plugged in all the time or not.

Heybike Hero review: sparing almost no expense in a carbon fiber e-bike
The Heybike Hero has a carbon fiber frame that weighs just six pounds, so it can be stuffed to the brim with features like a 1,000W motor and full suspension without exceeding 100 pounds.

Hands on: Using the Dexcom G7 continuous glucose meter directly with Apple Watch
On Wednesday, medical device manufacturer Dexcom finally delivered its direct-to-Apple Watch functionality for the G7 CGM. Here's how it works.

Stormy servers — Apple Weather suffered an intermittent outage
Apple's Weather app wentdown for a number of users, an issue that prevented iPhone or iPad owners from being able to see the latest weather for their location.

AirTags used by alleged human smuggler may ultimately provide enough evidence for conviction
An alleged member of a Russia-based human smuggling network used at least seven Apple AirTags to stalk his wife. And, they may be his downfall.

The new iPad Air's large screen is a great addition at an excellent price point, but overall the line still lacks excitement.

Apple has hidden Thread radios in new iPads, MacBooks, and iMacs
Apple seems to be on the cusp of incorporating Thread in many of its new products without having officially listing it in the product specs yet.
Latest Videos

AirPods Max vs. Sonos Ace: premium personal audio, compared

Retro gold rush: which emulators are on the App Store, and what's coming
Latest reviews.

TerraMaster D8 Hybrid drive enclosure review: Lots of data, not enough bandwidth

{{ title }}
{{ summary }}
- a. Send us an email
- b. Anonymous form
- Buyer's Guide
- Upcoming Products
- Tips / Contact Us
- Podcast Instagram Facebook Twitter Mastodon YouTube Notifications RSS Newsletter
Apple Releases Safari Technology Preview 196 With Bug Fixes and Performance Improvements
Apple today released a new update for Safari Technology Preview , the experimental browser Apple first introduced in March 2016. Apple designed the Safari Technology Preview to test features that may be introduced into future release versions of Safari.

The current Safari Technology Preview release is compatible with machines running macOS Ventura and macOS Sonoma , the latest version of macOS that Apple released in September 2023.
The Safari Technology Preview update is available through the Software Update mechanism in System Preferences or System Settings to anyone who has downloaded the browser . Full release notes for the update are available on the Safari Technology Preview website .
Apple's aim with Safari Technology Preview is to gather feedback from developers and users on its browser development process. Safari Technology Preview can run side-by-side with the existing Safari browser and while designed for developers, it does not require a developer account to download.
Get weekly top MacRumors stories in your inbox.
Popular Stories

Some AT&T, T-Mobile and Verizon Customers Report Issues With Calls [Update: Fixed]

iOS 18: These iPhones Likely Won't Support Some AI Features

Revealed: Complete iPhone 16 Pro and iPhone 16 Pro Max Dimensions

iOS 18 Beta Available Next Week With These 25 New Features Expected

Sonos Ace Headphones vs. AirPods Max

Nintendo 3DS Emulator for iPhone Released in App Store With Caveats
Top rated comments.
Does anyone use this? I sure would not.
Next Article

Our comprehensive guide highlighting every major new addition in iOS 17, plus how-tos that walk you through using the new features.

Apple News+ improvements, cross-platform tracker alerts, website app downloads for the EU, and more.

Get the most out your iPhone 15 with our complete guide to all the new features.
A deep dive into new features in macOS Sonoma, big and small.

Apple's annual Worldwide Developers Conference will kick off with a keynote on June 10.

Expected to see new AI-focused features and more. Preview coming at WWDC in June with public release in September.

AI-focused improvements, new features for Calculator and Notes, and more.

Action button expands to all models, new Capture button, camera improvements, and more.
Other Stories

30 minutes ago by Tim Hardwick

19 hours ago by Tim Hardwick

20 hours ago by Tim Hardwick

2 days ago by Tim Hardwick

1 week ago by MacRumors Staff

IMAGES
VIDEO
COMMENTS
Enable Web Inspector on iOS : Open the Settings app on your iPhone or iPad. Scroll down and tap Safari. Scroll to the bottom of the page and tap Advanced. Tap the toggle next to Web Inspector to the On position. Enable Safari Developer Mode on Mac : Open Safari on your Mac. Click Safari in the top left corner of your Menu Bar.
On your Mac, in Safari, click the Develop menu. Near the top of the menu you should see your iPad or iPhone listed. Hover over your device in the menu and you'll see Safari with each tab listed below. Click the one you want to debug. The Web Inspector should then appear, now debug it: Elements, Console, Sources, Network, all of it should work!
To debug background scripts, open the Develop menu, find the menu item for the iOS or iPadOS device you wish to inspect, and then find the item with the name of the extension, "Extension Background Page", and the file name of the background script. Toolbar pop-up. To debug your extension's pop-up, open your pop-up on the device.
See monkeythedev's answer for the easiest way to debug on a Windows 8+ machine with iOS 9+. I updated my blog post using information from that answer and other sources and also recorded a screenshare.The method below should still work for iOS 8 and down, if needed. There is actually a pretty easy way to debug a website in Safari on iOS using Firefox on a Windows machine.
Here's how: Open the iPhone Settings menu. On an iPhone with an early version of iOS, access the Debug Console through Settings > Safari > Developer > Debug Console. When Safari on the iPhone detects CSS, HTML, and JavaScript errors, details of each display in the debugger. Scroll down and tap Safari to open the screen that contains everything ...
Web development tools. Apple has brought its expertise in development tools to the web. Safari includes Web Inspector, a powerful tool that makes it easy to modify, debug, and optimize websites for peak performance and compatibility on both platforms. And with Responsive Design Mode, you can preview your web pages in various screen sizes ...
Web Inspector helps you inspect all the resources and activity on webpages, Service Workers, Mac and Home Screen web apps, and JavaScript running inside your applications, making development more efficient across Apple platforms. The clean, unified design puts each core function in a separate tab, which you can rearrange to fit your workflow.
1) Click Develop from the Safari menu bar on Mac, and you'll see your iPhone or iPad listed here. 2) Mouse over the device, and you'll then see the websites open in Safari on your mobile device. 3) Select the one you want, and the Web Inspector will pop open in a new window for you to use. Note: If this is the first time you're using your ...
To open the Safari Developer Tools, right-click on Inspect and start debugging. You can leverage other built-in features offered by LambdaTest, like geolocation testing, uploading files, accessibility, and much more. Using Safari, you can use the Responsive Design Mode while debugging your websites on LambdaTest.
Introduction. Safari Inspector is a powerful tool that allows you to inspect, debug, and modify webpages directly from your iPad. Whether you're a web developer, designer, or simply curious about how websites are built, Safari Inspector provides a window into the inner workings of the web.
Connect the iOS device to the machine. Enable the Web-Inspector option. To do so: Go to Settings > Safari > Scroll down to the bottom > Open Advanced Menu>. Turn on Web Inspector. Open the desired web page to debug or preview on your mobile Safari browser. Once done, enable the Develop menu on the Mac device.
To debug website on iPad, the first step would be to enable web debugging on the device: Go to Setting > Safari on the device. Scroll to the bottom and click on the Advanced menu. Enable the Web inspector option. After enabling web inspector, you need to now enable developer mode on the computer:
Using this project you can debug your websites and web applications running in iOS Safari from a PC running Windows or Linux. It provides a free and up-to-date alternative to the discontinued remotedebug-ios-webkit-adapter by RemoteDebug and is the spiritual successor to the abandoned webkit-webinspector by Arty Gus.It is a free and open source alternative to inspect.dev.
On your iPad, iPhone or iPod touch, tap Settings | Safari | Advanced and toggle on Web Inspector. And enable JavaScript if it isn't already enabled. On your Mac, launch Safari and go to Safari menu | Preferences | Advanced then check 'Show Develop menu in menu bar' if not already enabled. Connect your iOS device to your Mac with the USB cable.
Step 3. Install the iOS WebKit Debug Proxy, the easiest option is probably to use the scoop tool: Powershell script to install the scoop tool: iex (new-object net.webclient).downloadstring ...
Safari includes features and tools to help you inspect, debug, and test web content in Safari, in other apps, and on other devices including iPhone, iPad, Apple Vision Pro, as well as Apple TV for inspecting JavaScript and TVML. Features like Web Inspector in Safari on macOS let you inspect and experiment with the layout of your webpage ...
In order to open debugging in Safari, you will need to use the Terminal application. ... In conclusion, iPad debug mode is a powerful tool that can be used to test and debug native apps on ...
Safari for iOS includes an optional debug console to help web developers track down and resolve issues with webpages on iPhone and iPad. Even better, with the latest versions of iOS it actually uses the same Web Inspector that Safari on desktop does too, meaning if you connect the iPhone or iPad to the computer you can use the Safari debugging tools directly with your iOS or iPadOS device
The debug console on the iPad was indeed limted to only console.log() lines, but it was easy to use and fast. I have also upgraded one of my iPad's to iOS6 and tried to hook it up on Safari (Windows), but Safari developer menu isn't even showing the iPad. I tried to install iTunes (hate that program :( ) but even then no luck. -
Apple's Worldwide Developers Conference to kick off June 10 at 10 a.m. PDT with Keynote address. The Keynote will be available to stream on apple.com, the Apple Developer app, the Apple TV app, and the Apple YouTube channel. On-demand playback will be available after the conclusion of the stream. larrybobba Author.
With any largely text-based web page open in Safari, you need only tap on the "Aa" icon in the left-hand side of your address bar. Once that's been tapped, you'll see the option to "Show Reader ...
weinre is a debugger for web pages, like FireBug (for FireFox) and Web Inspector (for WebKit-based browsers), except it's designed to work remotely, and in particular, to allow you debug web pages on a mobile device such as a phone. Get NodeJS, NPM, and a webkit-based desktop browser to run it. To install with yarn:
Wednesday June 5, 2024 4:44 pm PDT by Juli Clover. Apple today released a new update for Safari Technology Preview, the experimental browser Apple first introduced in March 2016. Apple designed ...
First you must ensure that you have the Web Inspector enabled ("Settings > Safari > Advanced" and turn on "Web Inspector"). Then connect your iPad to your Mac via an USB cable. After that I can choose in the "Develop" Menu of Safari to debug the website displayed on my iPad/iPhone.