
How Fast Do Wildfires Spread?
Wildfire can move extremely quickly. Explore the details of how fast wildfire spreads with guidance from the Western Fire Chiefs Association (WFCA).
Published:November 1, 2022 Edited: March 4, 2024
Wildfires can move extremely quickly. Explore the details of how fast wildfire spreads with guidance from the Western Fire Chiefs Association (WFCA).
When faced with the threat of a wildfire, one of the first questions people ask is how fast it can spread. Understanding how quickly wildfire spreads can help you to prepare effectively and protect your home and community.
Wildfire Speed Explained
Wildfires spread at an average of 14.27 miles per hour. 1 However, this can vary hugely depending on a number of factors, such as weather conditions, fuel type, and terrain. As a human observer, it can be very difficult to accurately estimate how fast a wildfire is encroaching, and it is common for people to overestimate the distance of a fire from their location.
How Do Wildfires Spread?
To understand how a wildfire spreads, we first need to understand how it starts. For a fire to ignite , there must be three elements present; heat, fuel, and oxygen, commonly referred to as the ‘fire triangle.’ These are the components to create fire, but they also dictate the speed at which fire travels and spreads.
A source of heat is required to initially ignite a fire. Heat also causes fire to spread by removing the moisture from nearby fuel and preheating it. In the case of wildfires, a source of heat can come either from natural or human causes. Lightning strikes are the most common natural cause of wildfires, while discarded cigarettes and unattended campfires are among the most common human causes. Overall, human negligence causes the vast majority of fires.
As it suggests in the name, fuel is anything that feeds a fire, including all combustible materials, natural or manufactured. The moisture content of the fuel will determine how quickly a wildfire spreads.
In short, the drier the fuel, the quicker the spread. Other factors such as the size and shape, the quantity, and its arrangement across the landscape also affect the speed at which the fire moves. 2 Most common sources of wildfire fuel include dry plant materials, such as dead leaves, vegetation, trees and grasses, and fallen pine needles. The more these combustible materials pile up, the higher the chances of a devastating wildfire. 3 Fuel management in areas vulnerable to wildfire can significantly help wildfire suppression.
Oxygen is the third component of the fire triangle. While controlling fuel and heat sources is possible, controlling the oxygen for wildfires is not.
What Elements of Weather Most Affect Wildfire?
Weather plays an integral role in the speed at which a wildfire spreads, and wildfire season is largely dictated by weather. Long periods of drought often result in more wildfires while increased rainfall means fewer wildfires .
Temperature
High temperatures cause more evaporation, meaning that the environment becomes drier, creating fuel for wildfires. Therefore, extended periods of hot, dry weather cause more severe wildfires. As temperatures continue to rise due to climate change, so does the threat of larger, more frequent wildfires.
If hot temperatures dry out the fuel, moisture does the opposite. The level of moisture, whether it is in the form of rainfall, humidity , or the levels of moisture in the soil, can affect how quickly a fire spreads. High levels of moisture deter wildfires from spreading because it makes the fuel much less combustible. Lakes and rivers can also halt the spread of wildfires.
Wind has one of the largest (and most unpredictable) impacts on how quickly a wildfire spreads. Winds supply the fire with extra oxygen, dry out potential fuels, and push the fire across the land. 4 The speed of the wind has a direct correlation to the speed of a fire’s spread – the stronger the wind, the faster the fire grows. It can also throw embers into the air, creating additional fires, or thrust the fire upwards, causing the tree canopy to burn – otherwise known as a crown fire.

How Does Topography Affect Wildfire?
Finally, it is important to recognize that the topography (or lay of the land) can also influence wildfire behavior. Fires tend to spread in the same direction as the ambient wind – usually uphill. Therefore, wildfire spreads more quickly uphill. This is also because the rising smoke and heat dry out the fuel further up the slope. Conversely, fires spread slower downhill because it cannot preheat the downhill fuel as effectively.
- Mercury Insurance, “ How Wildfires Start and Spread .” Accessed October 25, 2022.
- RedZone, “ Wildfire 101: The Fire Triangle and the Fire Tetrahedron .” Accessed October 25, 2022.
- U.S. Department of the Interior, “ Fuels Management .” Accessed October 25, 2022.
- How Stuff Works, “ How Wildfires Work .” Accessed October 25, 2022.

How to Become a Wildland Firefighter
Unlock the path to becoming a wildland firefighter. Learn about training, skills, and challenges with guidance from the Western Fire Chiefs Association.

Protect Your Home with Ember Resistant Vents
Discover the importance of ember-resistant vents in safeguarding homes from wildfires. Learn how they work and why they're crucial with guidance from the WFCA.

Idaho Fire Season: In-Depth Guide
Explore details regarding the Idaho fire season from the Western Fire Chiefs Association (WFCA). Learn when is it, how long it lasts, risk factors and more.
Evaluating the 10% Wind Speed Rule of Thumb for Estimating a Wildfire’s Forward Spread Rate
- All Articles
- Wildfire Author Guidelines
- Advertise in Wildfire
- International Journal of Wildland Fire
- Evaluating the 10% Wind Speed Rule of Thumb for Estimating a Wildfire’s Forward Spread Rate...
Evaluating the 10% Wind Speed Rule of Thumb for Estimating a Wildfire’s Forward Spread Rate By Miguel G. Cruz and Martin E. Alexander

INTRODUCTION In the October-December 2019 issue of WILDFIRE, we described a recently developed rule of thumb for estimating a wildfire’s forward spread rate when burning conditions are severe, namely when wind speeds are high and fuels are critically dry, and the time available to prepare a more exacting prediction is limited (Alexander and Cruz 2019). Based on the analysis of three distinct datasets comprising 118 high-intensity wildfire runs from around the world in forests (conifer- and eucalyptdominated) and shrublands, rate of spread was considered to be roughly 10% of the prevailing 10-m (33-ft) open wind speed, independent of the unit system used (Cruz and Alexander 2019). For example, given an open wind speed of 25 km/h (16 mi/h), the estimated wildfire spread rate during severe burning conditions would be approximately 2.5 km/h (1.6 mi/h).
Here we present a summary of an evaluation study that analyzed the predictive accuracy of the 10% rule of thumb against two large, independent wildfire datasets. For further details on the study, see Cruz et al. (2020).
THE INDEPENDENT DATA SOURCES Documented observations of wildfire rate of spread were extracted from two different databases totalling 350 wildfire runs. The analysis focused on the wildfires spreading under the influence of strong wind speeds (i.e. >30 km/h or 19 mi/h) and low fine dead fuel moisture contents (i.e. <7%). The application of this filter reduced the data used in the analysis to 88 fire runs. Thirty of these runs came from a database of fires in native eucalypt forests of southern Australia compiled by researchers from the Monash University in collaboration with the Country Fire Authority (CFA) and the Department of Sustainability and Environment of Victoria (Harris et al. 2011; Kilinc et al. 2012). The rates of fire spread and corresponding wind speeds ranged from 0.8-8.0 km/h (0.5-5.0 mi/h) and 30- 100 km/h (19-62 mi/h), respectively.
The second dataset consisted of 58 fire runs in shrublands, eucalypt forests and conifer forests garnered from the BONFIRE global fire behaviour database project led by the Universidade de Trás-os-Montes e Alto Douro (UTAD) in Vila Real, Portugal, starting in 2015 (Fernandes et al. 2020). The rates of fire spread and corresponding wind speeds ranged from 0.55-12.5 km/h (0.3-7.8 mi/h) and 30-80 km/h (19-50 mi/h), respectively.
MAIN OUTCOMES OF THE ANALYSIS
- The analysis of the performance of the 10% rule of thumb against wildfires spreading during severe burning conditions revealed the following:
- Its predictive accuracy is comparable to other evaluation studies of empirical fire spread models using wildfire data. No significant differences were observed in error trends between the three fuel types considered (i.e. shrublands, conifer forests and eucalypt forests).
- An over-prediction bias was detected for fires that spread at rates of less than 2.0 km/h (1.2 mi/h). This was also observed in the original analysis related to the development of the rule of thumb.
- It works best for wildfires spreading at rates greater than 2.0 km/h (1.2 mi/h) with most fires predicted within ±35% error prediction band. Prediction error, expressed as a percent of the observed rate of fire spread, was found to decrease in absolute terms with increasing rates of fire spread (Figure 1; see Box 1 for an interpretation of percent error).

THE DOMINANT CONTROL OF WIND SPEED DURING SEVERE BURNING CONDITIONS The results of the Cruz et al. (2020) study have substantiated the strong control that wind speed exerts on the forward spread rate of wildfires when fuels are critically dry (i.e. both fine dead fuel moisture and overall long-term landscape dryness) and winds are strong. These burning conditions produce the type of fires that typically surprise emergency response agencies and communities as a result of their fast spread rates and corresponding high fireline intensities. Despite the high energy release rates associated with wildfires burning during these conditions, the convective plume tilt associated with the strong winds leads to a decoupling between the advancing flame front at the surface and the plume downwind that seems to reduce fire-plume interactions and the associated uncertainty with respect to weather conditions at the surface.
CLOSING REMARKS The 10% rule of thumb was developed to provide first approximations of wildfire propagation rates for situations when there is little or no time to apply more comprehensive and accepted fire behavior prediction methods. As shown in the evaluation study, its application works well for the dry and windy conditions associated with fast-spreading wildfires, but will result in large over-predictions when applied in low to moderate wind speeds (i.e. <20 km/h or 12 mi/h) and fine dead fuel moisture conditions >7%.

ACKNOWLEDGEMENTS Thanks to Paulo Fernandes (UTAD), Musa Kilinc (CFA) and Ângelo Sil (UTAD) for their contributions to the 10% rule of thumb evaluation study and to Matt Plucinski and Andrew Sullivan (CSIRO) for their comments on a draft of this article. Vincent Pastor with the Service Départemental d’Incendie et de Secours – 13, Bouches-du-Rhône, France, kindly provided details on the 2016 Rognac Fire.
REFERENCES Alexander, M.E. and M.G. Cruz. 2019. A rule of thumb for estimating a wildfire’s forward spread rate. Wildfire 28(5): 36-39.
Cruz, M.G. and M.E. Alexander. 2013. Uncertainty associated with model predictions of surface and crown fire rates of spread. Environmental Modelling & Software 47: 16-28.
Cruz, M.G. and M.E. Alexander. 2019. The 10% wind speed rule of thumb for estimating a wildfire’s forward rate of spread in forests and shrublands. Annals of Forest Science 76(2): 44. 11 p.
Cruz, M.G., M.E. Alexander, P.M. Fernandes, M. Kilinc and Â. Sil. 2020. Evaluating the 10% wind speed rule of thumb for estimating a wildfire’s forward rate of spread against an extensive independent set of observations. Environmental Modelling & Software 133: 104818. 15 p.
Fernandes, P.M., Â. Sil, C.G. Rossa, D. Ascoli, M.G. Cruz and M.E. Alexander. 2020. Characterizing fire behavior across the globe. In: Hood, S., S. Drury, T. Steelman and R. Steffens (Editors), The Fire Continuum – Preparing for the Future of Wildland Fire: Proceedings of the Fire Continuum Conference, 2018 May 21-24, Missoula, MT. Proceedings RMRS-P-78. Fort Collins, CO: US Department of Agriculture, Forest Service, Rocky Mountain Research Station. pp. 258-263.
Harris, S., W. Anderson, M. Kilinc and L. Fogarty. 2011. Establishing a link between the power of fire and community loss: the first step towards developing a bushfire severity scale. Report 89. Melbourne, VIC: Victorian Government, Department of Sustainability and Environment. 75 p.
Kilinc, M., W. Anderson and B. Price. 2012. The applicability of bushfire behaviour models in Australia. Technical Report 1. Melbourne, VIC: Victorian Government, Department of Sustainability and Environment, DSE Schedule 5: Fire Severity Rating Project. 60 p.
ABOUT THE AUTHORS – The two of them have been cooperating on various projects for the the past 24 years.

Marty Alexander is a semi-retired Canadian wildland fire behavior researcher ( [email protected] ).

Advertisement
How Wildfires Work
- Share Content on Facebook
- Share Content on LinkedIn
- Share Content on Flipboard
- Share Content on Reddit
- Share Content via Email
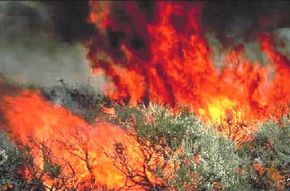
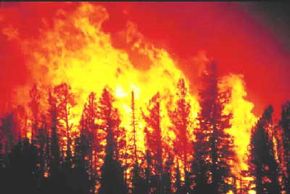
In just seconds, a spark or even the sun's heat alone sets off an inferno. The wildfire quickly spreads, consuming the thick, dried-out vegetation and almost everything else in its path. What was once a forest becomes a virtual powder keg of untapped fuel. In a seemingly instantaneous burst, the wildfire overtakes thousands of acres of surrounding land, threatening the homes and lives of many in the vicinity.
An average of 5 million acres burns every year in the United States, causing millions of dollars in damage. Once a fire begins, it can spread at a rate of up to 14.29 miles per hour (23 kph), consuming everything in its path. As a fire spreads over brush and trees, it may take on a life of its own -- finding ways to keep itself alive, even spawning smaller fires by throwing embers miles away. In this article, we will look at wildfires, exploring how they are born, live and die.
On a hot summer day, when drought conditions peak, something as small as a spark from a train car's wheel striking the track can ignite a raging wildfire. Sometimes, fires occur naturally, ignited by heat from the sun or a lightning strike. However, the majority of wildfires are the result of human carelessness.
Common causes for wildfires include:
- Discarding lit cigarettes
- Improperly burning debris
- Playing with matches or fireworks
- Prescribed fires
Everything has a temperature at which it will burst into flames. This temperature is called a material's flash point . Wood's flash point is 572 degrees Fahrenheit (300 C). When wood is heated to this temperature, it releases hydrocarbon gases that mix with oxygen in the air, combust and create fire.
There are three components needed for ignition and combustion to occur. A fire requires fuel to burn, air to supply oxygen , and a heat source to bring the fuel up to ignition temperature. Heat, oxygen and fuel form the fire triangle . Firefighters often talk about the fire triangle when they are trying to put out a blaze. The idea is that if they can take away any one of the pillars of the triangle, they can control and ultimately extinguish the fire.
After combustion occurs and a fire begins to burn, there are several factors that determine how the fire spreads. These three factors include fuel , weather and topography . Depending on these factors, a fire can quickly fizzle or turn into a raging blaze that scorches thousands of acres.
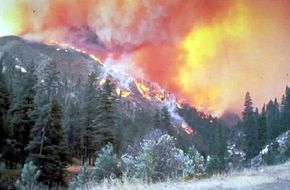
Weather's Role in Wildfires
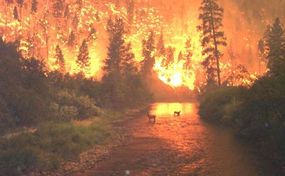
Fire on the mountain, battling the blaze.
Wildfires spread based on the type and quantity of fuel that surrounds it. Fuel can include everything from trees, underbrush and dry grassy fields to homes. The amount of flammable material that surrounds a fire is referred to as the fuel load . Fuel load is measured by the amount of available fuel per unit area, usually tons per acre.
A small fuel load will cause a fire to burn and spread slowly, with a low intensity. If there is a lot of fuel, the fire will burn more intensely, causing it to spread faster. The faster it heats up the material around it, the faster those materials can ignite. The dryness of the fuel can also affect the behavior of the fire. When the fuel is very dry, it is consumed much faster and creates a fire that is much more difficult to contain.
Here are the basic fuel characteristics that decide how it affects a fire:
- Size and shape
- Arrangement
- Moisture content
Small fuel materials, also called flashy fuels , such as dry grass, pine needles, dry leaves, twigs and other dead brush, burn faster than large logs or stumps (this is why you start a fire with kindling rather than logs). On a chemical level, different fuel materials take longer to ignite than others. But in a wildfire, where most of the fuel is made of the same sort of material, the main variable in ignition time is the ratio of the fuel's total surface area to its volume. Since a twig's surface area is not much larger than its volume, it ignites quickly. By comparison, a tree's surface area is much smaller than its volume, so it needs more time to heat up before it ignites.
As the fire progresses, it dries out the material just beyond it -- heat and smoke approaching potential fuel causes the fuel's moisture to evaporate. This makes the fuel easier to ignite when the fire finally reaches it. Fuels that are somewhat spaced out will also dry out faster than fuels that are packed tightly together, because more oxygen is available to the thinned-out fuel. More tightly-packed fuels also retain more moisture, which absorbs the fire's heat.
Weather plays a major role in the birth, growth and death of a wildfire. Drought leads to extremely favorable conditions for wildfires, and winds aid a wildfire's progress -- weather can spur the fire to move faster and engulf more land. It can also make the job of fighting the fire even more difficult. There are three weather ingredients that can affect wildfires:
- Temperature
As mentioned before, temperature affects the sparking of wildfires, because heat is one of the three pillars of the fire triangle. The sticks, trees and underbrush on the ground receive radiant heat from the sun, which heats and dries potential fuels. Warmer temperatures allow for fuels to ignite and burn faster, adding to the rate at which a wildfire spreads. For this reason, wildfires tend to rage in the afternoon, when temperatures are at their hottest.
Wind probably has the biggest impact on a wildfire's behavior. It also the most unpredictable factor. Winds supply the fire with additional oxygen, further dry potential fuel and push the fire across the land at a faster rate.
Dr. Terry Clark, senior scientist at the National Center for Atmospheric Research, has developed a computer model that shows how winds move on a small scale. Since 1991, he's been converting that model to include wildfire characteristics, such as fuel and heat exchange between fires and the atmosphere.
"We look at what's called coupled fire atmosphere dynamics , where the fire and the atmosphere interact with each other," Clark said. "We've been looking at how fires interact with the environment and getting some of the characteristics of fire spread and fire behavior, through the modeling that we've been doing."
Clark's research has found that not only does wind affect how the fire develops, but that fires themselves can develop wind patterns. When the fire creates its own weather patterns, they can feed back into how the fire spreads. Large, violent wildfires can generate winds, called fire whirls . Fire whirls, which are like tornadoes , result from the vortices created by the fire's heat. When these vortices are tilted from horizontal to vertical, you get fire whirls. Fire whirls have been known to hurl flaming logs and burning debris over considerable distances.
"There's another way that you can tilt the vorticity. That is it can be titled without breaking into fire whirls, and basically be burst forward into what's called hairpin vortices or forward bursts," Clark said. "These are quite common in crown fires [fires at the top of trees], and so you see fires licking up hill sides." Forward bursts can be 20 meters (66 feet) wide and shoot out 100 meters (328 feet) at a speed of 100 mph (161 kph). These bursts leave a scorched region and lead to fire spread.
The stronger the wind blows, the faster the fire spreads. The fire generates winds of its own that are as many as 10 times faster than the ambient wind. It can even throw embers into the air and create additional fires, an occurrence called spotting . Wind can also change the direction of the fire, and gusts can raise the fire into the trees, creating a crown fire .
While wind can help the fire to spread, moisture works against the fire. Moisture, in the form of humidity and precipitation, can slow the fire down and reduce its intensity. Potential fuels can be hard to ignite if they have high levels of moisture, because the moisture absorbs the fire's heat. When the humidity is low, meaning that there is a low amount of water vapor in the air, wildfires are more likely to start. The higher the humidity, the less likely the fuel is to dry and ignite.
Since moisture can lower the chances of a wildfire igniting, precipitation has a direct impact on fire prevention. When the air becomes saturated with moisture, it releases the moisture in the form of rain. Rain and other precipitation raise the amount of moisture in fuels, which suppresses any potential wildfires from breaking out.
The third big influence on wildfire behavior is the lay of the land, or topography. Although it remains virtually unchanged, unlike fuel and weather, topography can either aid or hinder wildfire progression. The most important factor in topography as it relates to wildfire is slope .
Unlike humans, fires usually travel uphill much faster than downhill. The steeper the slope, the faster the fire travels. Fires travel in the direction of the ambient wind, which usually flows uphill. Additionally, the fire is able to preheat the fuel further up the hill because the smoke and heat are rising in that direction. Conversely, once the fire has reached the top of a hill, it must struggle to come back down because it is not able to preheat the downhill fuel as well as the uphill.
Dr. Clark says that fires travelling slower uphill are an exception to the rule, but it does happen. Winds can work against a fire that is trying to move up a slope.
"It depends on which way the wind's blowing," he said. "For example, I have a case study in Australia where the wind was blowing down the mountain side, blowing the fire away from the hill until a front came through. Then it went uphill."
In addition to the damage that fires cause as they burn, they can also leave behind disastrous problems, the effects of which might not be felt for months after the fire burns out. When fires destroy all the vegetation on a hill or mountain, it can also weaken the organic material in the soil and prevent water from penetrating the soil. One problem that results from this is extremely dangerous erosion that can lead to debris flows.
An example of this occurred following a July 1994 wildfire that burned about 2,000 acres of forest and underbrush on the steep slopes of Storm King Mountain, near Glenwood Springs, Colorado. Two months after the fire, heavy rains caused debris flows that poured tons of mud, rock and other debris onto a 3-mile stretch of Interstate 70, according to United States Geological Survey. These debris flows engulfed 30 cars and swept two into the Colorado River.
While we often look at wildfires as being destructive, many wildfires are actually beneficial. Some wildfires burn the underbrush of a forest, which can prevent a larger fire that might result if the brush were allowed to accumulate for a long time. Wildfires can also benefit plant growth by reducing disease spread, releasing nutrients from burned plants into the ground and encouraging new growth.
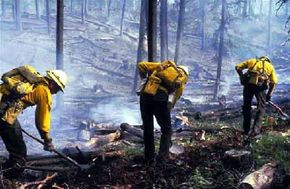
Imagine being inside an oven, wearing heavy clothing with smoke filling your lungs, and you can only begin to understand what it's like to fight a raging wildfire. Every year, thousands of firefighters put their lives at risk to battle merciless blazes. The elite, ground-based firefighters fit into two categories:
- Hotshots - Working in 20-person teams, the main job of these highly trained firefighters is to build a firebreak around the fire to keep it from spreading. A firebreak is a tract of land that has been stripped of any possible fuel for the fire. Hotshots are employed by the U.S. Forest Service .
- Smokejumpers - These firefighters are the paratroopers who jump out of planes to get to small blazes located in remote areas. Their job is to suppress small fires before they are able to spread into larger ones. Smokejumpers use the same firefighting techniques as the Hotshots once they have landed on the ground. There are only a few hundred smokejumpers in the entire United States, all employed by either the Bureau of Land Management (BLM) or the U.S. Forest Service.
In addition to building firebreaks and dousing the fire with water and fire retardant, ground crews may also use backfires . Backfires are fires started by the ground crew that advance toward the burning wildfire. The goal of setting a backfire is to burn up any potential fuel in the path of the progressing wildfire.
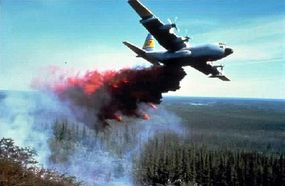
While the Hotshots, Smokejumpers and other support crews fight the battle on the ground, they are given a lot of support from the air. Air tankers are often used to drop thousands of gallons of water and retardant onto fires. The red stuff that you often see being dropped from planes and helicopters is a chemical retardant that contains phosphate fertilizer, which helps to slow and cool down the fire.
Helicopters are also used as a method of attacking the fire from above. Carrying buckets that can hold hundreds of gallons of water, these aircraft fly over the fire and drop water bombs. Helicopters are also valuable for transporting firefighters to and from the fire.
Wildfires are powerful forces of nature that can burn for as long as they have fuel, oxygen and heat. The job of the firefighters is to eliminate one, if not all three, sides of the fire triangle to prevent further damage.
For additional information on wildfires and related topics, check out the links on the next page.
Lots More Information
Related articles.
- How Smokejumpers Work
- Top 5 Ways Wildfires Start
- What if a wildfire came near my house?
- How Fire Works
- How Fire Engines Work
- How Fire Extinguishers Work
- How Firefighter Training Works
- How Smoke Detectors Work
- How the Sun Works
- How Lightning Works
- How Volcanoes Work
- How Tornadoes Work
- How Hurricanes Work
- How Earthquakes Work
- How Floods Work
- How do multi-class dry chemical fire extinguishers work?
- Why does smoke come from a fire?
More Great Links
- CBC News In-depth: Forest Fires
- National Interagency Fire Center
- University Corporation for Atmospheric Research
- Bureau of Land Management
- U.S. Forest Service
Please copy/paste the following text to properly cite this HowStuffWorks.com article:

- Research Paper
- Published: 25 April 2019
The 10% wind speed rule of thumb for estimating a wildfire’s forward rate of spread in forests and shrublands
- Miguel G. Cruz ORCID: orcid.org/0000-0003-3311-7582 1 &
- Martin E. Alexander 2
Annals of Forest Science volume 76 , Article number: 44 ( 2019 ) Cite this article
10k Accesses
51 Citations
27 Altmetric
Metrics details
Key message
The collective analysis of a relatively large number of wildfire observations documented in conifer forests, dry eucalypt forests and temperate shrublands revealed that the forward rate of fire spread is roughly 10% of the average 10-m open wind speed, provided both are expressed in the same units (e.g. km h −1 ).
Knowledge of a wildfire’s forward spread rate is a prerequisite for defining adequate fire suppression strategies and to ensure timely public warnings.
We wanted to investigate the possibility that a simple relationship exists that could be used as a first approximation for quickly estimating a wildfire’s spread rate simply from the open wind speed alone.
We analysed data from a number of high-intensity wildfire observations ( n = 118) documented in temperate shrublands, Australian dry eucalypt forests and North American conifer forests to examine the suitability and soundness of a relationship between wind speed and rate of fire spread. We also contrasted the performance of the best function against established fire spread rate models for the three fuel types.
The resulting rule of thumb is that the forward rate of spread of wildfires burning in forests and shrublands in relatively dry conditions is approximately equal to 10% of the average 10-m open wind speed, where both values are expressed in the same units.
The rule of thumb gives the most accurate results for dry fuel and high wind speed conditions with reduced bias and mean relative errors lower than 50%. Under these conditions, the error statistics are comparable to those obtained by the established fire spread rate models. The rule is not applicable to grasslands.
1 Introduction
Free-burning wildland fires are a determinant feature of the Earth system. Under favourable burning conditions, a random ignition can result in a fast-spreading, high-intensity wildfire causing widespread damage to human values (Harris et al. 2012 ) and ecosystem components (Scott et al. 2014 ). In such situations, effective suppression of the head fire region is impossible and outright dangerous for firefighter resources (Alexander and Thorburn 2015 ). The key to mitigating the threat that wildfires pose to the personal safety of people is to be able to gauge their potential speed and direction across the landscape (Cruz et al. 2015 ) and to use this information to release timely and effective public warnings and evacuation orders (Cova et al. 2005 ; Alexander et al. 2017 ; Neale and May 2018 ).
Mathematical models and quantitative methods to predict wildland fire behaviour on an operational basis have been under development since the 1960s (McArthur 1967 ; Rothermel 1972 ; Van Wagner 1973 ; Albini 1976 ). The models and methods have evolved over the years, namely with the development of complex spatial fire growth simulators such as FARSITE (Finney 2004 ), Prometheus (Tymstra et al. 2010 ), Phoenix (Tolhurst et al. 2008 ) and Spark (Miller et al. 2015 ). These simulators take into account the description of model inputs (e.g. wind speed, fuel moisture, fuel type, slope steepness) as they vary across the landscape and can reduce the time taken to produce a detailed fire growth simulation when compared to manual methods involving graphs, tables and software applications (Rothermel 1983 , 1991 ; Andrews et al. 2008 ; Plucinski et al. 2017 ; Taylor and Alexander 2018 ; Monedero et al. 2019 ).
Independent of the method used (i.e. manual drawing of fire spread vectors on a map vs. a computer-automated fire growth projection) and an agency’s investment in a trained cadre of fire behaviour analysts, there will be numerous instances, as alluded to above, where fires will escape initial attack and immediately threaten down-wind communities (Kissane 2010 ; Ramsey et al. 2012 ; Hawley et al. 2017 ; Nauslar et al. 2018 ). In such cases, there will typically be little time available for local resources to undertake a detailed prediction of fire spread and direction. Yet, an incident commander or fire controller still needs to be able to make quick and timely decisions in regard to the issuance of warnings to wildland firefighters and members of the general public in potentially affected communities (Cova et al. 2009 ).
For such wildfire emergencies, users require uncomplicated and quick-to-use rules (e.g. Butler and Cohen 1998 ; Cruz and Alexander 2014 ) or guidelines (e.g. Alexander and Fogarty 2002 ; Sharples et al. 2009 ). The use of fire behaviour rules of thumb has been a common practice in wildland fire management for many years now (e.g. Mitchell 1937 ; Arnold 1962 ; Chandler et al. 1983 , p. 115; Terry 1993 ; Heikkilä et al. 2010 ; Jandt and Miller 2015 ). “Crossover”, for example, is a common fire behaviour rule of thumb used primarily in the boreal forest regions of Canada for identifying the threshold conditions for extreme fire behaviour. It occurs when the relative humidity is equal to or lower than the ambient air temperature in degrees Celsius (Janz 1989 ; Lawson and Armitage 2008 ). The “30-30-30” rule of thumb (i.e. situations where three conditions are met: ambient air temperature ≥ 30 °C, relative humidity ≤ 30% and open wind speed ≥ 30 km h −1 ) is increasingly being used around the world as an indicator of extreme fire behaviour potential (Steffens 2016 ). Sauvagnargues-Lesage et al. ( 2001 ) and Filippi et al. ( 2014 ) refer to the “three per cent model” used by firefighters in Southern France, indicating the spread rate of a fire to be 3% of the open wind speed.
By nature, a rule of thumb is a broadly applicable guide or principle based on experience or practice rather than theory. Rules of thumb can help guide decision-making when problems are too complex for a truly analytical solution in the time that is available (Kahneman 2011 ). Rules of thumb are certainly needed for the assessment of the potential for a wildfire to spread into peri-urban areas so that public safety messages and evacuation orders can be issued in a timely manner. The events associated with the 2009 Black Saturday fires in Victoria, Australia (Teague et al. 2010 ), are but one example of where a large number of random ignitions and rapid fire development very quickly overcame the capability of fire control and emergency service agencies to predict fire propagation and help keep local communities safe.
Analyses of experimental fire and wildfire data have shown wind speed to be the environmental variable that leads to the most significant changes in the rate of fire spread and intensity (Burrows 1994 ; Cheney et al. 1998 , 2012 ). The effect of wind speed on the spread rate of a flame front is complex, integrating several interactions involving fuelbed characteristics, the vertical wind speed and gustiness profiles, and the energy output of the fire itself. Exploratory analysis of wildfire case study data carried out by Pimont et al. ( 2017 ), for example, suggests that under certain conditions, the rate of fire spread might be explained in large part by wind speed alone.
In the present paper, we investigate the possible existence and validity of a simple and scientifically credible rule of thumb for judging the effect of the 10-m open wind speed, a World Meteorological Organization ( 2008 ) standard for conducting surface wind measurements, on the spread rate of high-intensity wildfires in fire-prone forest and shrubland environments.
We relied on published wildfire case study data for our analysis. Alexander and Cruz ( 2006 ), Cheney et al. ( 2012 ) and Anderson et al. ( 2015 ) provide wildfire datasets used in the evaluation of their fire spread rate models, namely for crown fires in North America conifer forests, Australian dry eucalypt forests and temperate shrublands, respectively (Table 1 ). These compiled datasets are for the most part based on published wildfire case studies and include some of the most notorious wildfire events documented to date (e.g. Kiil and Grigel 1969 ; Simard et al. 1983 ; Cruz et al. 2012 ). The datasets include information on fuels, weather (10-m open wind speed, ambient air temperature, relative humidity), duration of the fire run(s) and the associated rate of fire spread on level or undulating topography. The duration of the fire runs was typically of the order of 1 h to 3 h. Fuel characteristics were nominally estimated from relevant studies, namely using time since fire as a proxy of fuel accumulation (e.g. Cheney et al. 2012 ) and assigning canopy bulk density values based on conifer forest fuel type (Alexander and Cruz 2006 ). Data in Cheney et al. ( 2012 ) and Anderson et al. ( 2015 ) also include a reliability score that ranks the reliability of the fuel, weather and fire behaviour data. For further detail, we recommend readers to consult the list of references in the aforementioned publications for the original wildfire data sources.
Linear regression analysis through ordinary least squares was used to establish a reference relationship between the forward rate of fire spread ( R , km h −1 ) and the 10-m open wind speed ( U 10 , km h −1 ). These results formed the basis for establishing a rule of thumb. Metrics such as the mean absolute error (MAE), the mean bias error (MBE) and the mean absolute percentage error (MAPE) were used to quantify the error (Willmott 1982 ; Mayer and Butler 1993 ; Cruz and Alexander 2013 ) associated with the proposed rule of thumb. We then contrasted the error statistics obtained with the rule of thumb with the statistics obtained with the fuel type–specific rate of fire spread models—i.e. Cruz et al. ( 2005 ) for the conifer forest crown fire data, Cheney et al. ( 2012 ) for the dry eucalypt forest data and Anderson et al. ( 2015 ) for the temperate shrubland data.
Linear regression analysis (forced through the origin) of wind speed on the rate of fire spread, considering all data together, yielded a slope coefficient of 0.082 ( p < 0.0001). Such a model resulted in a MAE of 0.95 km h −1 and a MAPE of 55%. The slope coefficient determined by dataset source was 0.084 ( p < 0.0001), 0.081 ( p < 0.0001) and 0.080 ( p < 0.0001), for conifer forests, eucalypt forests and temperate shrublands, respectively. The consistency of these results suggests the rate of fire spread to be about 8% of the wind speed, independent of the fuel type. Because the calculation of 8% of a wind speed does not lend itself readily to mental arithmetic, we tested the use of a 10% value (Fig. 1 ). The 10% wind speed rule of thumb (i.e. the forward rate of fire spread is 10% of the average wind speed) resulted in a MAE of 1.11 km h −1 , a MBE of 0.53 km h −1 and a MAPE of 74% (Fig. 2 ). What is relevant to such a simplistic model is not the overall error, but how the error is distributed, as the rule of thumb would be most relevant at the more extreme or severe end of the fire environment spectrum (i.e. dry fuels and high wind conditions) where the urgency of the situation requires swift decisions.

Scatterplot of the rate of fire spread vs. 10-m open wind speed for wildfires in conifer forests (Alexander and Cruz 2006 ), dry eucalypt forests (Cheney et al. 2012 ) and temperate shrublands (Anderson et al. 2015 )

Observed wildfire rates of spread vs. predictions by the 10% wind speed rule of thumb for conifer forests (data from Alexander and Cruz 2006 ), dry eucalypt forests (data from Cheney et al. 2012 ) and temperate shrublands (data from Anderson et al. 2015 ). The dashed lines around the line of perfect agreement indicate the ± 35% error interval as per Cruz and Alexander ( 2013 )
Figure 3a, b shows the variation of MBE and MAPE by rate of fire spread class (0 to 1.0, 1.0 to 2.0, etc.). For rates of fire spread between 1.0 and 6.0 km h −1 , the class MBE varies between 1.0 and − 1.0 km h −1 . This consistency of the class MBE, while the magnitude of the rate of fire spread increases, results in a notable decay in the MAPE (Fig. 3b ). Noteworthy in Fig. 3a is the magnitude of the error for the three fastest spreading fires in dry eucalypt forests (MBE = − 3.5 km h −1 ). Although the error is large, its relative magnitude is acceptable, with the MAPE varying between 33 and 39%. The two data points with the highest spread rate (i.e. 10 km h −1 and 10.5 km h −1 ) were related to the effect of the post-frontal weather change on fire spread during the 1983 Ash Wednesday fires in Victoria, Australia (Rawson et al. 1983 ).

Plots of the mean bias error (MBE) and mean absolute percent error (MAPE) per a , b observed rate of fire spread class (1.0 km h −1 interval), c , d fine dead fuel moisture content (2.5% interval) and e , f 10-m open wind speed class (10 km h −1 interval). The number of observations per interval is given by n
The analysis of the MBE and percent residual with fine dead fuel moisture class shows the rule of thumb to work best for dry fuels. The MBE varied within the ± 0.5 km h −1 range for fine dead fuel moisture levels < 7.5% (Fig. 3c ) but increased to about 1 km h −1 for fuel moistures above 10%. MAPE increased moderately with wind speeds up to a 50–60 km h −1 class, after which there was a sharp increase in the average residual. This increase is based on a few data points: the above-mentioned errors associated with a post-frontal change in fire dynamics during the 1983 Ash Wednesday conflagrations and two other wildfire runs in dry eucalypt forests burning under the influence of very high wind speeds (i.e. 75 km h −1 to 95 km h −1 ) but relatively high moisture conditions (Buckley 1992 ), resulting in relatively low rates of fire spread (2.3 km h −1 to 3.8 km h −1 ) for the prevailing wind speeds.
From the results above, we categorised the rule of thumb error statistics by considering a matrix with four sets of burning conditions: low (≤ 7.5%) vs. high (> 7.5%) fine dead fuel moisture content, and moderate (≤ 30 km h −1 ) vs. high (> 30 km h −1 ) wind speeds (Fig. 4 ). In this respect, we see the MBE and MAPE to be reduced in the dry fuel conditions, irrespective of the associated wind speeds. For these conditions, the MBE varies between 0.16 and 0.22 km h −1 , and the MAPE varies between 42 and 54%. The highest errors obtained by the rule of thumb occur for the high fuel moisture/moderate wind speed combination. This condition is associated with the lowest average R (1.05 km h −1 ), the MAPE and MBE being 122% and 0.93 km h −1 , respectively.

Variation in the mean forward rate of fire spread ( R ) and error statistics for the 10% wind speed rule of thumb per broad burning condition. MC is the fine dead fuel moisture content (low < 7.5%; high > 7.5%), U 10 is the 10-m open wind speed (moderate < 30 km h −1 ; high > 30 km h −1 ), MAE is the mean absolute error, MBE is the mean bias error and MAPE is the mean absolute percent error
Table 2 provides the fit statistics when one applies fuel type–specific fire spread models to the three datasets used in developing the rule of thumb. In this analysis, the models are being evaluated against independent data (i.e. the wildfire data not used in their development), whereas for comparative purposes, it should be noted that the rule of thumb was informed, but not strictly fitted, by this data. Overall, bias and percent error were consistent for the conifer and dry eucalypt forest datasets, with a MBE of 0.4 km h −1 and a MAPE just above 50%. The error was lower for the temperate shrubland dataset, with a MBE of 0.1 km h −1 and a MAPE of 33%. Although these overall errors are lower than those obtained by the rule of thumb for the whole dataset, they are comparable to the rule errors for the low fuel moisture content situations. When contrasting the error statistics obtained with the rate of fire spread models and the rule of thumb by broad burning conditions, it is evident that the results are comparable to the low fuel moisture conditions (Fig. 5 ), with the MBE being substantially lower for the rule of thumb.

Comparison of model fit statistics between the 10% wind speed rule of thumb and fuel type–specific models for four sets of distinct burning conditions. MC is the fine dead fuel moisture content (low < 7.5%; high > 7.5%), U 10 is the 10-m open wind speed (moderate < 30 km h −1 ; high > 30 km h −1 ), MAE is the mean absolute error, MBE is the mean bias error and MAPE is the mean absolute percent error
4 Discussion
Our analysis of published wildfire rate of spread data in forest and temperate shrubland fuel types revealed a simple rule of thumb to estimate the forward rate of fire spread (being approximately 10% of U 10 ) with acceptable accuracy based on contrasting the error statistics with those from published fire spread model evaluation studies (Cruz and Alexander 2013 ). The rule of thumb assumes that both wind speed and rate of fire spread are expressed in the same units. Too often people trust rules of thumb as if they were certainties and fail to recognise when they should make an independent analytical decision. One should know enough about why a rule of thumb works to be able to predict when it will fail (Scott et al. 2014 , p. 364).
The rule of thumb produced the lowest relative error for low fine dead fuel moisture content (i.e. MC < 7.5%) situations, with MAPE values varying between 54% for moderate wind speeds (i.e. U 10 < 30 km h −1 ) and 42% for high wind speeds (i.e. U 10 > 30 km h −1 ). These will typically characterise the environment associated with peak burning conditions. For such situations, the error statistics obtained by the rule of thumb were comparable with those obtained using fuel type–specific fire spread rate models. These results suggest that the rule of thumb works best for cases when it might be required. The rule of thumb performed poorly for higher fuel moisture content conditions (i.e. MC > 7.5%). In these situations, the errors statistics obtained for the rule of thumb were substantially higher than the ones obtained for the fire spread rate models.
These results can be somewhat counterintuitive, as it is commonly postulated (Rothermel 1991 ) that under the most severe fire weather situations (i.e. under critically dry fuel conditions and strong winds), wildfires can attain a level of fire behaviour that is unpredictable due to the high energy release rates and fire-atmosphere interactions (Werth et al. 2016 ). In such cases, errors obtained by the rule of thumb or fire spread rate models should be higher. However, this is not the case as the bias and relative error, expressed by the MBE and MAPE, respectively, are, in fact, smaller for the severe burning conditions. One possible explanation is that as the burning conditions shift towards the more severe side of the fire behaviour spectrum and the energy released increases, the overwhelming radiative and convective energy transfer fluxes reduce the influence that fuel characteristics and moisture content exert on the fire propagation processes. As the number of influential variables is reduced, presumably the predictability of the fire spread rate increases.
Our analysis used data from a broad range of fuel complex structures, namely temperate shrublands characterised by high fuel availability and relatively low fuelbed height (< 2 m), North America conifer forests with a broad range of surface fuel and canopy structures and Australian dry eucalypt forests characterised by their open structure and low canopy bulk densities. The results suggest that wind speed largely determines fire spread rates under dry fuel moisture conditions, irrespective of the fuel complex structure. These results are surprising not only because of the differences in fuel characteristics but also the mechanisms dominating the fire propagation process. In particular, fire propagation in dry eucalypt forests under low fuel moisture conditions is known to be largely influenced by the transport of firebrands and subsequent ignition of spot fire ignitions ahead of the main flame front (McArthur 1967 ; Cheney and Bary 1969 ). Although spotting behaviour is inherent to the fire spread rates in the three wildfire databases used in our analysis, the firebrand densities and travel distances observed in dry eucalypt forests are typically much greater (e.g. Hodgson 1968 ; Albini et al. 2012 ).
Spotting is a complex, multivariate process influenced by the fuel type (determining firebrand types and quantities), fuel moisture (controlling ignition probability), fire size and intensity (determining overall firebrand number, plume height and firebrand lofting height) and wind speed, namely its variation within the vertical profile of the atmosphere and its effect on firebrand horizontal travel distances (Koo et al. 2010 ; Albini et al. 2012 ; Martin and Hillen 2016 ). Under high wind and low fuel moisture conditions, spotting is expected to be present and strongly influences the overall fire propagation (Albini et al. 2012 ). Our analysis shows that wind speed alone is able to explain the variability in observed wildfire rates of fire spread to levels comparable to those observed in outdoor experimental fires—i.e. negligible bias, 40% < MAPE < 50% (Cruz and Alexander 2013 ). This dominant role played by wind speed emphasizes the importance of its accurate forecasting in the fire behaviour prediction process.
Care should be exercised in applying the rule of thumb to situations in which a weather change leads to a drastic change in wind speed and direction as observed with frontal passages over a fire, a somewhat common occurrence in south-eastern Australia during periods of extreme fire potential (McArthur 1967 ; Australian Bureau of Meteorology 1984 ). This process converts a fire’s eastern flank into a broad head fire and concurrently deposits numerous firebrands downwind in a north-easterly direction (Luke and McArthur 1978 , p. 90), leading to a large increase in the burned area in a short time period. In such a situation, the overall movement of the flame front is largely a function of spot fires coalescing over a broad area, typically extending out over 5 km to 12 km, instead of the movement of a single flame front driven by the prevailing wind (McArthur 1967 ). This type of event is responsible for more than half of the documented fire-caused human fatalities in Australia (Blanchi et al. 2014 ), and in particular, those associated with the 1983 Ash Wednesday fires (Keeves and Douglas 1983 ; Rawson et al. 1983 ) and the 2009 Black Saturday fires (Teague et al. 2010 ) in southeastern Australia. The rule of thumb under-predicted by about 33% the two post-frontal change fires in the dry eucalypt forest fuel types used in the analysis. The particular concern about the use of the rule of thumb in these scenarios is not the relative error, which is somewhat acceptable, but its independence relative to the post-frontal wind speed, which makes the rule of thumb incapable of accurately capturing the extent of the post-frontal change in wildfire activity.
An obvious question is how well does the rule of thumb perform in fuel types distinctly different from the ones described in the methods and results. An analysis of wildfire data in Australian grasslands characterised by low dead fuel moisture contents (averaging 3.5%) published by Cheney et al. ( 1998 ) ( n = 23) suggests an average R / U 10 ratio of 0.25 (i.e. the forward rate of fire spread is approximately one quarter of the U 10 ). Given such a large deviation, the 10% wind speed rule of thumb as developed here should not be applied to open grasslands.
One might also ask how applicable is the rule of thumb in estimating R in disease or insect-killed stands, a particularly important fire management issue in western North America (Page et al. 2015 ). Perrakis et al. ( 2014 ) showed that wildfires in the red stage of mountain pine beetle (MPB) ( Dendroctonus ponderosae Hopkins) affected lodgepole pine ( Pinus contorta Dougl. var. latifolia Engelm.) forests in British Columbia, Canada, to propagate 2.7 times faster than predicted by fire spread models for healthy stands. Analysis of the wildfire rate of spread data compiled by Perrakis et al. ( 2014 ) ( n = 14; mean R = 1.4 km h −1 ) suggests an average R / U 10 ratio of 0.12. The application of the 10% wind speed rule of thumb to this data resulted in a MAPE of 42% and a MBE of − 0.21 km h −1 . Of the 14 wildfires, the rule of thumb under-predicted eight and over-predicted six, an almost equal partition. The data given in Perrakis et al. ( 2014 ) were in the high MC—moderate wind speed category. The performance of the rule of thumb in relation to these wildfires was better than that obtained against the main dataset, suggesting that at least for similar burning conditions, the rule of thumb is applicable to MPB-affected lodgepole pine forests in the red stage.
The use of the rule of thumb is acceptable not only for fires spreading on level to gently undulating topography but may also apply in cases of fires advancing across drainages with alternating upslope and downslope runs (e.g. Anderson 1968 ). As fire increases in size and spreads across multiple drainages, the surging (during upslope runs) and stalling (during downslope runs) are commonly assumed to average out to a flat ground condition (Rothermel 1991 ; Sullivan et al. 2014 ). The suitability of the rule of thumb in purely upslope or downslope fire runs is questionable, remains untested in our work and should be avoided.
The use of the rule of thumb requires the knowledge of the 10-m open wind speed. This wind speed is typically measured in the open (i.e. not being influenced by vegetation or man-made structures) and is averaged over a 10-min time interval (Lawson and Armitage 2008 ). In a forecasting sense, the rule of thumb should be used with the forecasted wind speed. In areas where the forecasted wind speed is not given at a 10-m open height, a correction can be applied. For example, it is customary to report wind speed for fire management applications in the USA at a height of 6.1 m in the open (Andrews 2012 ). A conversion for this wind speed into the 10-m one would require multiplying the former by 1.15 (Lawson and Armitage 2008 ). In the absence of forecasted wind speed and direction, the rule of thumb could be used with locally measured wind conditions. In cases where representative weather stations are not available, the use of a wind speed measured at an approximate eye-level height, as commonly used in fire operations, will require corrections for the vertical wind profile, taking into account the surrounding vegetation and location on the landscape (Rothermel 1983 ). The Beaufort wind scale (List 1951 , p. 119) could also be used to estimate U 10 .
In practice, it is envisioned that an end-user would typically plot a fire spread direction arrow(s) on a map aligned in the direction of the prevailing wind (Rothermel 1983 , 1991 ; Alexander and Fogarty 2002 ; Taylor and Alexander 2018 ). The length of the arrow, representing the fire’s forward spread distance, would be dictated by the projected rate of spread and the duration of the run. The shape and size of the fire could, in some cases, also be displayed, provided the wind direction remains relatively constant. A wind-driven fire typically adopts a roughly elliptical shape as defined by its length-to-breadth (L:B) ratio (Alexander and Cruz 2014 ). The L:B ratio is, in turn, a function of the wind speed (Taylor and Alexander 2018 ).
Comparison of the 10% wind speed rule of thumb against wildfire data showed that although the rule of thumb has value as a first approximation of a fire’s forward rate of spread under dry fuel conditions, irrespective of the forest or shrubland type, its use in higher, or marginal, fuel moisture conditions can lead to notable over-prediction bias. Although it is well understood that under-predictions can result in disastrous outcomes (Cheney 1981 ), over-predictions or the cautionary approach to inflate the level of risk as a safety precaution can lead to “warning fatigue” (Mackie 2013 ). Warning fatigue, or the “cry wolf syndrome”, can result in general mistrust of potentially life-saving future warnings.
The errors produced by the application of the rule of thumb against the wildfire data can be considered acceptable, given (1) the uncertainty in the wildfire data, namely related to the representativeness of weather data due to the distance between the weather station and the fire, and relative to the infrequent and opportunistic nature of fire behaviour observations, and (2) the error inherent to the prediction of fire spread associated with models that are simplified representations of a physical process (Alexander and Cruz 2013 ). Cruz and Alexander ( 2013 ) compiled the statistics from published fire spread model evaluation studies and came to the conclusion that an error within a ± 35% interval around the observation would constitute a reasonable standard for these models. The rule of thumb predicted close to this threshold for the low MC fires. Despite this adequacy, it should be noted that within each fire behaviour forecast scenario, the most accurate method to produce a fire spread prediction will be to use the most appropriate models for the situation, combined with situational awareness and direct observations of fire activity in the preceding time periods (Alexander and Cruz 2013 ).
5 Conclusions
We conducted an analysis of a large number of wildfire rate of spread observations documented in conifer forests, eucalypt forests and temperate shrublands to investigate the suitability of a simple rule of thumb that provides a first approximation of the rate of fire spread from wind speed alone. The analysis revealed the forward rate of fire spread to be roughly 10% of the average 10-m open wind speed, provided both are expressed in the same units (e.g. km h −1 ). This rule of thumb gives the most accurate results for dry fuel and high wind speed conditions with reduced bias and mean relative errors lower than 50%. Under these conditions, the error statistics are comparable to those obtained by fire spread rate models. The rule is not applicable to grasslands, but it was shown to work adequately for wildfires burning in some insect-killed forests. The rule of thumb is deemed applicable to fires spreading on level to undulating topography or across drainages with alternating upslope and downslope runs.
Data availability
The datasets generated and/or analysed during the current study are available as electronic supplementary material.
Albini FA (1976) Estimating wildfire behavior and effects. USDA Forest Service, Intermountain Forest and Range Experiment Station, General Technical Report INT-30, Ogden, UT, 92 p
Albini FA, Alexander ME, Cruz MG (2012) A mathematical model for predicting the maximum potential spotting distance from a crown fire. Int J Wildland Fire 21:609–627
Article Google Scholar
Alexander ME, Cruz MG (2006) Evaluating a model for predicting active crown fire rate of spread using wildfire observations. Can J For Res 36:3015–3028
Alexander ME, Cruz MG (2013) Limitations on the accuracy of model predictions of wildland fire behaviour: a state-of-the-knowledge overview. For Chron 89:370–381
Google Scholar
Alexander ME, Cruz MG (2014) The elliptical shape and size of wind-driven crown fires. Fire Manag Today 73(4):28–33
Alexander ME, Fogarty LG (2002) A pocket card for predicting fire behaviour in grasslands under severe burning conditions. Natural Resources Canada, Canadian Forest Service, Forest Research and National Rural Fire Authority, Fire Technology Transfer Note 25, Ottawa, ON, Rotorua, NZ and Wellington, NZ, 8 p
Alexander ME, Mutch RW, Davis KM, Bucks CM (2017) Wildland fires: dangers and survival. Auerbach’s Wilderness Medicine, Volume 1, 7th edition, pp. 276–318. Edited by P.S. Auerbach. Elsevier, Philadelphia
Alexander ME, Thorburn WR (2015) LACES: adding an “A” for Anchor point(s) to the LCES wildland firefighter safety system. Current International Perspectives on Wildland Fires, Mankind and the Environment. pp. 121–144. Edited by B Leblon and ME Alexander. Nova Science Publishers Inc, Hauppauge, NY
Anderson HE (1968) Sundance Fire: an analysis of fire phenomena. USDA Forest Service, Intermountain Forest and Range Experiment Station, Research Paper INT-56, Ogden, UT, 39 p
Anderson WR, Cruz MG, Fernandes PM, McCaw L, Vega JA, Bradstock RA, Fogarty L, Gould J, McCarthy G, Marsden-Smedley JB, Matthews S, Mattingley G, Pearce HG, van Wilgen BW (2015) A generic, empirical-based model for predicting rate of fire spread in shrublands. Int J Wildland Fire 24:443–460
Andrews PL (2012) Modeling wind adjustment factor and midflame wind speed for Rothermel’s surface fire spread model. USDA Forest Service, Rocky Mountain Research Station, General Technical Report RMRS-GTR-266, Fort Collins, CO, 39 p
Andrews PL, Bevins CD, Seli RC (2008) BehavePlus fire modeling system, version 4.0: user’s guide. USDA Forest Service, Rocky Mountain Research Station, General Technical Report RMRS-GTR-106WWW, Ogden, UT, 116 p
Arnold RK (1962) Rules for outdoor fires. Firemen 29(8):22
Australian Bureau of Meteorology (1984) Report on the meteorological aspects of the Ash Wednesday fires—16 February 1983. Australian Government Publishing Service, Canberra, ACT, 143 p
Blanchi R, Leonard J, Haynes K, Opie K, James M, Oliveira FD (2014) Environmental circumstances surrounding bushfire fatalities in Australia 1901–2011. Environ Sci Policy 37:192–203
Buckley AJ (1992) Fire behaviour and fuel reduction burning: Bemm River wildfire, October 1988. Aust For 55:135–147
Burrows ND (1994) Experimental development of a fire management model for jarrah ( Eucalyptus marginata Donn ex Sm.) forest. PhD thesis, Australian National University, Canberra, ACT, 293 p
Butler BW, Cohen JD (1998) Firefighter safety zones: how big is big enough? Fire Manag Notes 58(1):13–16
Chandler C, Cheney P, Thomas P, Trabaud L, Williams D (1983) Fire in forestry. Volume I: forest fire behavior and effects. Wiley, New York, NY, 450 p
Cheney NP (1981) Fire behaviour. Fire and the Australian biota. pp. 151–175. Edited by A.M. Gill, R.H. Groves and I.R. Noble. Australian Academy of Science, Canberra, ACT
Cheney NP, Bary GAV (1969) The propagation of mass conflagrations in a standing eucalypt forest by the spotting process. In Collected papers of mass fire symposium, Volume I. Paper A6. Commonwealth of Australia, Defence Standards Laboratory: Melbourne, VIC, 18 p
Cheney NP, Gould JS, Catchpole WR (1998) Prediction of fire spread in grasslands. Int J Wildland Fire 8:1-15
Cheney NP, Gould JS, McCaw WL, Anderson WR (2012) Predicting fire behaviour in dry eucalypt forest in southern Australia. For Ecol Manag 280:120–131
Cova TJ, Dennison PE, Kim TH, Moritz MA (2005) Setting wildfire evacuation trigger points using fire spread modeling and GIS. TransGIS 9:603–617
Cova TJ, Drews FA, Siebeneck LK, Musters A (2009) Protective actions in wildfires: evacuate or shelter-in-place? Nat Hazards Rev 10:151–162
Cruz MG, Alexander ME (2013) Uncertainty associated with model predictions of surface and crown fire rates of spread. Environ Model Softw 47:16–28
Cruz MG, Alexander ME (2014) The start, propagation, and spread rate of crown fires. Fire Manag Today 73(4):17–23
Cruz MG, Alexander ME, Wakimoto RH (2005) Development and testing of models for predicting crown fire rate of spread in conifer forest stands. Can J For Res 35:1626–1639
Cruz MG, Gould JS, Alexander ME, Sullivan AL, McCaw WL, Matthews S (2015) A guide to rate of fire spread models for Australian vegetation. Revised edition. CSIRO Land and Water Flagship and Australasia Fire Authorities Council, Canberra, ACT and Melbourne, VIC, 123 p
Cruz MG, Sullivan AL, Gould JS, Sims NC, Bannister HJJ, Hurley R (2012) Anatomy of a catastrophic wildfire: the Black Saturday Kilmore East Fire. For Ecol Manag 284:269–285
Filippi J-B, Mallet V, Nader B (2014) Representation and evaluation of wildfire propagation simulation. Int J Wildland Fire 23:46–57
Finney MA (2004) FARSITE: Fire area simulator—model development and evaluation. USDA Forest Service, Rocky Mountain Research Station, Research Paper RMRS-RP-4 Revised, Ogden, UT, 47 p
Harris S, Anderson W, Kilinc M, Fogarty L (2012) The relationship between fire behaviour measures and community loss: an exploratory analysis for developing a bushfire severity scale. Nat Hazards 63:391–415
Hawley J, Hurley G, Sackett S (2017) Into the fire: the fight to save Fort McMurray. McClelland & Stewart – Penguin Random House Canada, Toronto, ON, 148 p
Heikkilä TV, Grönqvist R, Jurvélius M (2010) Wildland fire management handbook for trainers. Food and Agriculture Organization of the United Nations, Rome, IT, 248 p
Hodgson A (1968) Control burning in eucalypt forests in Victoria, Australia. J For 66:601–605
Jandt R, Miller E (2015) What is the moisture content of standing dead grass? Alaska Fire Science Consortium, AFSC Research Brief 2015-1, Fairbanks, AK, 1 p
Janz B (1989) The fire weather report—what does it tell us? Proceedings of the fifth Central Region Fire Weather Committee Scientific and Technical Seminar, April 6, 1988, Winnipeg, MB. pp. 41-47. Compiled and Edited by W.J. De Groot. Forestry Canada, Northwest Region, Saskatchewan District Office, Study NOR-36-03-04 File Report No. 1, Prince Albert, SK.
Kahneman D (2011) Thinking, fast and slow. Farrar, Straus and Giroux, New York, NY, 418 p
Keeves A, Douglas DR (1983) Forest fires in South Australia on 16 February 1983 and consequent future forest management aims. Aust For 46:148–162
Kiil AD, Grigel JE (1969) The May 1968 forest conflagrations in central Alberta—a review of fire weather, fuels and fire behavior. Canada Department of Fisheries and Forestry, Forestry Branch, Forest Research Laboratory, Information Report A-X-24, Calgary, AB, 36 p
Kissane K (2010) Worst of days: inside the Black Saturday firestorm. Hachette Australia, Sydney, NSW, 316 p
Koo E, Pagni PJ, Weise DR, Woycheese JP (2010) Firebrands and spotting ignition in large-scale fires. Int J Wildland Fire 19:818–843
Lawson BD, Armitage OB (2008) Weather guide for the Canadian Forest Fire Danger Rating System. Natural Resources Canada, Canadian Forest Service, Northern Forestry Centre, Edmonton, AB, 73 p
List RJ (1951) Smithsonian meteorological tables. 6th rev. edn. Smithsonian Institute Press, Washington DC, 527 p
Luke RH, McArthur AG (1978) Bushfires in Australia. Australian Government Publishing Service, Canberra, ACT, 359 p
Mackie B (2013) Warning fatigue: insights from the Australian bushfire context. PhD thesis, University of Canterbury, Christchurch, NZ, 294 p
Martin J, Hillen T (2016) The spotting distribution of wildfires. Appl Sci 6:177 34 p
Mayer DG, Butler DG (1993) Statistical validation. Ecol Model 68:21–32
McArthur AG (1967) Fire behaviour in eucalypt forests. Commonwealth Department of National Development, Forestry and Timber Bureau, Leaflet 107, Canberra, ACT, 36 p
Miller C, Hilton J, Sullivan A, Prakash M (2015) SPARK—a bushfire spread prediction tool. Environmental software systems. Infrastructures, services and applications. ISESS 2015. pp. 262–271. In: Edited by R. Denzer, R.M. Argent, G. Schimak and J Hřebíček. IFIP advances in information and communication technology, Volume 448. Springer, Cham
Mitchell JA (1937) Rule of thumb for determining rate of spread. Fire Control Notes 1:395–396
Monedero S, Ramirez J, Cardil A (2019) Predicting fire spread and behaviour on the fireline. Wildfire analyst pocket: a mobile app for wildland fire prediction. Ecol Model 392:103–107
Nauslar NJ, Abatzoglou JT, Marsh PT (2018) The 2017 North Bay and Southern California fires: a case study. Fire 1:18 17 p
Neale T, May D (2018) Bushfire simulators and analysis in Australia: insights into an emerging sociotechnical practice. Environ Hazards 17:200–218
Page WG, Alexander ME, Jenkins MJ (2015) Effects of bark beetle attack on canopy fuel flammability and crown fire potential in lodgepole pine and Engelmann spruce forests. Proceedings of the Large Fire Conference, May 19–23, 2014, Conference, May 19–23, 2014, Conference, May 19–23, 2014, Missoula, MT. pp. 174-180. In: Edited by R.E. Keane, M. Jolly, R. Parsons and K. Riley. USDA Forest Service, Rocky Mountain Research Station. Proceedings RMRS-P-73, Fort Collins, CO
Perrakis DDB, Lanoville RA, Taylor SW, Hicks D (2014) Modeling wildfire spread in mountain beetle-affected forest stands, British Columbia, Canada. Fire Ecol 10(2):10–35
Pimont F, Dupuy JL, Linn RR, Parsons R, Martin-StPaul N (2017) Representativeness of wind measurements in fire experiments: lessons learned from large-eddy simulations in a homogeneous forest. Agric For Meteorol 232:479–488
Plucinski MP, Sullivan AL, Rucinski CJ, Prakash M (2017) Improving the reliability and utility of operational bushfire behaviour predictions in Australian vegetation. Environ Model Softw 91:1–12
Ramsey L, Ramsey N, McWilliams J, Kristoff MJ (2012) The sky was on fire—Slave Lake’s story of disaster, exodus, and new beginnings. Slave Lake Book Committee: Slave Lake, AB, 300 p
Rawson RP, Billing PR, Duncan SF (1983) The 1982-83 forest fires in Victoria. Aust For 46:163–172
Rothermel RC (1972) A mathematical model for predicting fire spread in wildland fuels. USDA Forest Service, Intermountain Forest and Range Experiment Station, Research Paper INT-115, Ogden, UT, 40 p
Rothermel RC (1983) How to predict the spread and intensity of forest and range fires. USDA Forest Service, Intermountain Forest and Range Experiment Station, General Technical Report INT-143, Ogden, UT, 161 p
Rothermel RC (1991) Predicting behavior and size of crown fires in the Northern Rocky Mountains. USDA Forest Service, Intermountain Research Station, Research Paper INT-438, Ogden, UT, 46 p
Sauvagnargues-Lesage S, Dusserre G, Robert F, Dray G, Pearson DW (2001) Experimental validation in Mediterranean shrub fuels of seven wildland fire rate of spread models. Int J Wildland Fire 10:15–22
Scott AC, Bowman DMJS, Bond WJ, Pyne SJ, Alexander ME (2014) Fire on Earth: an introduction. Wiley-Blackwell, Chichester, UK, 413 p
Sharples JJ, McRae RHD, Weber RO, Gill AM (2009) A simple index for assessing fuel moisture content. Environ Model Softw 24:637–646
Simard AJ, Haines DA, Blank RW, Frost JS (1983) The Mack Lake Fire. USDA Forest Service, North Central Forest Experiment Station, General Technical Report NC-83, St. Paul, MN, 36 p
Steffens R (2016) When fire burns, are we prepared? Wildfire 25(3):8
Sullivan AL, Sharples JJ, Matthews S, Plucinski MP (2014) A downslope fire spread correction factor based on landscape-scale fire behaviour. Environ Model Softw 62:153–163
Taylor SW, Alexander ME (2018) Field guide to the Canadian Forest Fire Behavior Prediction (FBP) System. 3rd edn. Natural Resources Canada, Canadian Forest Service, Northern Forestry Centre, Special Report 11, Edmonton, AB, 101 p
Teague B, McLeod R, Pascoe S (2010) 2009 Victorian Bushfires Royal Commission: final report summary. Government Printer for the State of Victoria, Melbourne, VIC, 42 p
Terry B (1993) Fire behavior rules of thumb. Update on the Rural Community Fire Protection Program, Fire Control Department. Texas Forest Service 5(1):2
Tolhurst K, Shields B, Chong D (2008) Phoenix: development and application of a bushfire risk management tool. Aust J Emerg Manag 23:47–54
Tymstra C, Bryce RW, Wotton BM, Taylor SW, Armitage OB (2010) Development and structure of Prometheus: the Canadian wildland fire growth simulation model. Natural Resources Canada, Canadian Forest Service, Northern Forestry Centre, Information Report NOR-X-417, Edmonton, AB, 88 p
Van Wagner CE (1973) Rough prediction of fire spread rates by fuel types. Environment Canada, Canadian Forestry Service, Petawawa Forest Experiment Station, Information Report PS-X-42, Chalk River, ON, 5 p
Werth PA, Potter BE, Alexander ME, Cruz MG, Clements CB, Finney MA, Forthofer JM, Goodrick SL, Hoffman C, Jolly WM, McAllister SS, Ottmar RD, Parsons RA (2016) Synthesis of knowledge of extreme fire behavior: volume 2 for fire behavior specialists, researchers, and meteorologists. USDA Forest Service, Pacific Northwest Research Station, General Technical Report PNW-GTR-891, Portland, OR, 258 p
Willmott CJ (1982) Comments on the evaluation of model performance. Bull Am Meteorol Soc 63:1309–1313
World Meteorological Organization (2008) Guide to meteorological instruments and methods of observation. 7th edn. World Meteorological Organization, WMO-No. 8, Geneva, CH, 611 p
Download references
Acknowledgements
The authors appreciate the comments received from Kelsy Gibos, Dana Hicks, Dave Marek, Brian McIntosh, Wesley Page, Matt Plucinski, Dave Thomas and the two anonymous reviewers on an earlier draft of this paper. This study was carried out in the framework of the BONFIRE (gloBal-scale analysis and mOdelliNg of FIRE behaviour potential) project (PTDC/AAG-MAA/2656/2014), funded by the Portuguese Foundation for Science and Technology (FCT) and the European Regional Development Fund (ERDF) through COMPETE 2020—Operational Program for Competitiveness and Internationalization (POCI).
Contribution of the co-authors
MGC and MEA contributed equally to the analysis and writing.
Author information
Authors and affiliations.
CSIRO, GPO Box 1700, Canberra, ACT, 2601, Australia
Miguel G. Cruz
Wild Rose Fire Behaviour, 180 - 50434 Range Road 232, Leduc County, AB, T4X 0L1, Canada
Martin E. Alexander
You can also search for this author in PubMed Google Scholar
Corresponding author
Correspondence to Miguel G. Cruz .
Ethics declarations
Conflict of interest.
The authors declare that they have no conflicts of interest.
Additional information
Handling Editor: Paulo Fernandes
Publisher’s note
Springer Nature remains neutral with regard to jurisdictional claims in published maps and institutional affiliations.
Electronic supplementary material
(XLSX 18.4 kb)
Rights and permissions
Reprints and permissions
About this article
Cite this article.
Cruz, M.G., Alexander, M.E. The 10% wind speed rule of thumb for estimating a wildfire’s forward rate of spread in forests and shrublands. Annals of Forest Science 76 , 44 (2019). https://doi.org/10.1007/s13595-019-0829-8
Download citation
Received : 01 February 2019
Accepted : 27 March 2019
Published : 25 April 2019
DOI : https://doi.org/10.1007/s13595-019-0829-8
Share this article
Anyone you share the following link with will be able to read this content:
Sorry, a shareable link is not currently available for this article.
Provided by the Springer Nature SharedIt content-sharing initiative
- Conifer forest
- Dry eucalypt forest
- Fine dead fuel moisture content
- Fire behaviour
- Temperate shrubland
Annals of Forest Science
ISSN: 1297-966X
- Submission enquiries: [email protected]
- General enquiries: [email protected]
Image adapted from: Alex King, NSW Rural Fire Service; with permission.
- Earth & environment
Things you need to know about bushfire behaviour
How does fire move through the landscape?
The primary influences upon how bushfires move through the landscape are humidity, topography, wind and temperature.
The effects of ambient temperature and humidity on a fire are pretty obvious. The hotter the air temperature, the lower the relative humidity, and any fuel will likely be drier—dry fuel ignites and burns more easily. The lower the humidity, the drier the air is, again helping fuels burn as they release their moisture into the air more readily.
The slope of the landscape is also important. Just consider a match and how much faster it burns when you hold it so the flame is burning up the stick (and towards your fingers!) than down. Similarly, fires burn much faster uphill than down. This is because the radiation and convection a fire creates preheat the unburned fuel ahead of the flame front, and this is done more effectively upslope than down. A 10-degree increase in slope usually results in a doubling of the speed of the fire. Fire will spread up a 20-degree slope four times as fast as it will along flat ground.

Wind speed is the environmental variable that has the most significant effect on the spread of fires. With wind speeds below around 10 km/hour, a fire will usually burn slowly without a definite spread direction. However, as winds increase in strength, the rate of fire spread increases. A change in wind direction, often from a cold front, can activate the side of a long and relatively narrow fire, turning it into a very broad flame front. In general, a wider fire will burn faster than a very narrow one.
The heat of a fire can create whirlwinds and turbulent air currents. Wind is also a major factor in transporting firebrands—pieces of burning fuel, like twigs, leaves or small embers—ahead of the main fire. This causes spotting—the ignition of new fires ahead of the fire front.
When a fire becomes a firestorm
Under very dry and windy conditions, profuse spotting from certain eucalypt forests will result in the ignition of a broad area ahead of the fire. This creates a firestorm environment with highly chaotic and turbulent winds further driving fire in all directions. The mass ignition can result in the formation of large fire-whirls, or fire tornadoes. Although localised, the very strong wind speeds generated (estimated to be up to 250 km/h given the damage they cause) are extremely destructive.
If enough fuel is being consumed within the fire area, the heat generated creates an extremely strong updraught of air that can result in a pyrocumulunimbus cloud, or flammagenitus. In extreme cases this thunderstorm-type cloud can produce lightning strikes, which have been known to start new fires.

How Quickly Does Fire Spread?
Fire is the product of a chemical process. Fire is created and maintained by three things: heat, fuel, and oxygen. Removing any one of these components will extinguish the fire. Thus, you can expect a fire to go out if there is not enough heat, if the fuel runs out, or if the oxygen supply is cut off.
If heat, fuel, and oxygen are all present, then the conditions are ideal for a sustained fire. When a fire starts in your home, there may not be enough time to save anything but yourselves. Fire can engulf an entire home with dizzying speed.
When people understand the speed at which fire can spread, they will be more likely to be cautious about fire risks. They will also know how much time they have to escape when a fire breaks out in their home. While the fire’s movement depends on different conditions, the following example can impart a general idea of the speed of fire.
Here’s a typical timeline of a 2-story house being engulfed by fire:
- At 0:30 minutes, the fire starts and rapidly grows.
- At 1:04 minutes, the fire spreads from the initial flame, and the room begins to fill with smoke.
- At 1:35 minutes, the temperature of the house goes higher than 190°F while the smoke layer rapidly descends.
- At 1:50 minutes, the smoke detector goes off, and there is still remaining time to get out of the house.
- At 2:30 minutes, the temperature in the source room climbs above 400°F.
- At 2:48 minutes, smoke will start pouring into the other rooms of the house.
- At 3:03 minutes, the temperature in the room where the fire began will reach over 500°F. No human can survive that kind of heat.
- At 3:20 minutes, escaping will be very challenging, with the upstairs halls filled with smoke.
- At 3:41 minutes, a “flashover” occurs. Everything in the room where the fire originated will ignite, with the temperature exceeding 1,400°F.
- At 3:50 minutes, two minutes after the smoke detector went off, the only possible way out is the second exit.
- At 4:33 minutes, flames will have engulfed the home’s exterior. Rescue is no longer possible.
It takes less than five minutes for a fire to completely engulf most homes. There is not much time to decide what to do. Fire waits for no man. It is critical to make a plan in advance. Hesitation could mean the difference between life and death.
If you do experience a fire, Utah fire restoration teams are poised to help with clean up. At Disaster Company, we handle Layton and Bountiful fire clean up quickly and efficiently.
It is important to learn how to prevent the fire from getting uncontrollable. There are things that can help you from doing that such as using a small fire detector to warn your family in case a fire breaks out anywhere in the house. Also, having a fire extinguisher and fire blanket in the kitchen; the most susceptible place to fire; can be a big help in putting out the fire. Check this ifographic.

Previous Post Must-Have Items for Repairing Your Home After a Disaster
Next post uv safety month.
Comments are closed.
2492 W Custer Road Salt Lake City, UT 84104
We Serve Cities Throughout Utah
Salt Lake City Ogden Orem Layton Morgan View all
Quick Links
Services Reviews Get a Free Inspection
Ready to Help You, 24/7
© 2024 The Disaster Company. All Rights Reserved. Terms & Conditions. Privacy Policy
- Restoration and Rebuild
- Water Damage Restoration
- Asbestos Abatement
- Pet and Pest Damage
- Roof and Shingle Damage
- Salt Lake City
- View Service Areas
- Get a Free Inspection
- 24/7 Emergency Line | 801-741-0000
Please fill out the form below and we will respond as soon as we can.
You Won't Believe How Quickly Wildfires Can Travel Across A Forest

Wildfires have always been a tremendous threat, and the changing climate is surely exacerbating this issue. In July 2023, the BBC reported that Kyriakos Mitsotakis, the Greek Prime Minister, announced that his nation was "at war and ... exclusively geared towards the fire front" as more than 80 such blazes stormed across the country. The very next month, The Independent noted Maui's own inferno was declared "the worst natural disaster that Hawaii ever faced" by Josh Green, the state governor of Hawaii.
The defining and most horrifying element of a wildfire is the sheer scale of it. This is why it can take an enormous team of professional fire crews working in tandem, along with legions of volunteers, to attempt to subdue them. Like any fire, though, they can begin from the smallest spark: the infamous Carr Fire was started by an unfortunate vehicle creating sparks when it scraped a road. Though natural events like lightning strikes can cause such fires, humans have a part to play too. The battle then becomes how to contain the rapid growth of the emerging fire because it can happen outrageously quickly.
Here's how fast wildfires can grow across a forest and the techniques firefighters use in their battle against them.
Just how fast can wildfires travel?
Wide areas of forest, sadly, are just the sorts of places that provide potential wildfires with copious amounts of fuel. When they catch hold, just like any fire, they can spread relentlessly and frighteningly quickly.
According to Mercury Insurance information from the Western Fire Chiefs Association , wildfires typically travel at around 14.3 miles per hour. That's about a mile every four minutes and 20 seconds. Grassy areas are easier for fires to spread across, but in forests, they can still zoom along at six miles per hour. In September 2017, the Eagle Creek wildfire (started by a carelessly-thrown firework) traveled across 30,000 acres of land in around four days.
Naturally, the speed of a given fire will depend on a wide range of factors, from the wind direction and general weather conditions as it develops to the changing ground it burns through. One thing's certain, though — six miles per hour may sound like a modest speed, but considering that an average walking pace is about 3–4 miles per hour, wildfires are formidable forces of nature to behold. With that in mind, here are some measures we take to try to mitigate their threat.
What do we do to attempt to tackle wildfires?
The February 2017 study "Human-started wildfires expand the fire niche across the United States," by Jennifer K. Balch et al., concluded that human activity was the cause of 84% of 1.5 million recorded wildfires. Preventative measures, then, are paramount.
The wide, majestic National Parks of the United States are in constant danger from wildfires. Monitoring our behaviors is one of the most effective means of protecting them from this. For example, in June 2021, the Sequoia & Kings Canyon National Parks maxed out its danger-limiting methods. The rules, which banned smoking and campfires anywhere in the parks, were implemented "to reduce our risk from unwanted human-caused fires during the hottest and driest part of the year," fire management officer Chief John Ziegler said . Careless campfires can be fire risks just as lithium-ion batteries can.
With their rapid spread, containing a wildfire isn't a simple matter of dousing it with an awful lot of water. Wildfires, affected by winds and other natural factors, are far from predictable. Firefighters do all they can to keep themselves safe, as well as everybody else. Attempts typically focus on isolating fires using a border around them, areas starved of fuel (dug out by firefighters) that the flames will struggle to expand beyond. The logistics of this mean that it's hard to predict just how large an area a fire will devastate in the meantime. They can be so fast, sadly.
- extreme weather
Why Wildfire Smoke Travels So Far and How Long It Will Last
A s wildfires continue to burn in Canada, the Great Lakes region is seeing thick smog and record high air quality issues caused by smoke from the blazes.
Swaths across Canada, particularly in the Quebec province, began battling fires weeks ago. So far, more than 9 million acres of land have burned and over 20,000 people have evacuated, Canadian officials said.
Hundreds of miles away from the fires, in one of the smokiest areas, Chicagoans woke up to the worst air quality in the world on Tuesday morning, deemed “ very unhealthy ” by the Environmental Protection Agency. Nearby areas, including Detroit and Minneapolis, are also plagued with smog and poor air quality.
The midwestern smoke is reminiscent of the scene in New York City earlier this month when the skyline turned a dark, orange hue that people liken to Mars, and people complained of a strong cigar-like smell.
Smoke from the wildfire crisis traveled south from Canada to the U.S. in early June where it affected the northeast, the Great Lakes, and the mid-Atlantic. Philadelphia and other cities took measures like canceling outdoor school activities at the time.
Government officials warn that a cold front moving toward New York could bring unhealthy levels of smoke to the area again overnight on Tuesday, going into Wednesday.
“As we closely monitor the changing forecast, New Yorkers should be prepared for the potential return of smoke from the Canadian wildfires,” Governor Kathy Hochul said in a statement. “I encourage everyone to remain vigilant, especially if you are vulnerable to air pollution, stay up to date on the latest information and take steps to protect yourself.”
Here’s what to know about the smoke:
Why smoke can travel so far
Tom Kines, a senior meteorologist at AccuWeather, explains that the smoke people are seeing was able to spread all the way from Canada because of how copious and ongoing the fires are. “These fires are still burning up there. They’re still putting smoke into the sky, and as long as you have a source of smoke it’s going to be an issue,” Kines says. Canada’s wildfires have been exacerbated by extremely dry conditions and warm temperatures. There were 493 active fires in Canada as of Monday, at least 259 of which were deemed out of control.
Read more: What Wildfire Smoke Does to the Human Body
The smoke’s trajectory follows the wind, which is currently traveling north to south, and as a result, bringing smoke from fires in Canada, towards the U.S. “All the smoke that gets deposited up in the air gets caught in the wind flow, and pushed out into the states,” Kines says. “That’s basically what’s been happening.”
Is smoke worse at higher or lower elevations?
Kines says that smoke levels are generally greater in high-elevation areas than low ones, but not always. “Usually when you get smoke it’s higher up in the atmosphere and it comes across as haze,” he says. “But in this particular instance, there’s so much smoke, it’s close to the ground. And not only is it reducing visibility, it’s causing air quality issues, and also you can smell the smoke.”
Smog had already been plaguing the northeastern U.S. from late May fires in Nova Scotia when plumes came again in June. Although the current fires are much stronger, the compounding smoke influx contributed to straining air quality throughout both countries.
How long will the smoke last?
Meteorologists predict that smoke around the Great Lakes will slowly dissipate today and tomorrow, leaving the skies mostly clear by late Wednesday.
Read more: Even As Smoke Engulfs Us, We Can’t Wrap Our Heads Around Climate Change
While there are signs of hope, the weather could still change, experts note. “Sometime next week, the winds become more northerly [blowing from north to south] again. If the fires are still burning, we could have more smoke issues again,” Kines says.
More from TIME
Government officials in affected states and counties are urging people to stay indoors as much as possible, especially children, senior citizens, and people with asthma or other lung and heart conditions.
“The City of Chicago is carefully monitoring and taking precautions,” Chicago Mayor Brandon Johnson said in a statement on Tuesday. “As these unsafe conditions continue, the city will continue to provide updates and take swift action to ensure that vulnerable individuals have the resources they need to protect themselves and their families.”
More Must-Reads from TIME
- Melinda French Gates Is Going It Alone
- How to Buy Groceries Without Breaking the Bank
- Lai Ching-te Is Standing His Ground
- How to Cool Your Body Down Fast
- Forget Having It All . Let’s Try Having Enough
- 4 Signs Your Body Needs a Break
- The 15 Best Movies to Watch on a Plane
- Want Weekly Recs on What to Watch, Read, and More? Sign Up for Worth Your Time
Contact us at [email protected]
- Skip to main content
- Skip to "About this site"
- Departments
Language selection
- Search and menus
Fire Behavior Normals

Rate of Spread (ROS) is the predicted speed of the fire at the front or head of the fire (where the fire moves fastest), and takes into account both crowning and spotting. It is measured in metres per minute and is based on the Fuel Type, Initial Spread Index, Buildup Index, and several fuel-specific parameters such as phenological state (leafless or green) in deciduous trees, crown base height in coniferous trees, and percent curing in grasses.
More information about the Canadian Forest Fire Weather Index (FWI) System is available in the Background Information .
Fire Behavior Normals represent the average value of a fire behavior element over the 30-year period from 1981 to 2010.
How Fast Does Smoke Travel: The Science Behind Smoke Dispersion
How Fast Does Smoke Travel?
Have you ever wondered how fast smoke travels? It’s a common question, and the answer may surprise you. Smoke can travel at speeds of up to 100 miles per hour, depending on the conditions. This means that it can spread quickly and can be a serious hazard.
In this article, we’ll take a closer look at how smoke travels, what factors affect its speed, and why it’s important to be aware of the risks. We’ll also provide some tips on how to stay safe in the event of a fire.
So if you’re curious about how fast smoke travels, read on!
Smoke is a mixture of gases and particles that is produced when something burns. The speed at which smoke travels depends on a number of factors, including the wind speed, temperature, humidity, and air pressure.
Factors Affecting Smoke Travel Speed
- Wind speed is the most important factor affecting smoke travel speed. The faster the wind, the faster the smoke will travel. This is because the wind provides a force that pushes the smoke particles away from the source of the fire.
- Temperature also affects smoke travel speed. Warmer air is less dense than cooler air, so it rises more quickly. This means that smoke from a fire will rise more quickly when the air is warm.
- Humidity affects smoke travel speed in a similar way to temperature. Moist air is less dense than dry air, so it rises more quickly. This means that smoke from a fire will rise more quickly when the air is humid.
- Air pressure also affects smoke travel speed. High-pressure air is denser than low-pressure air, so it sinks more quickly. This means that smoke from a fire will sink more quickly when the air pressure is high.
- Other factors that can affect smoke travel speed include the terrain and the presence of buildings. For example, smoke will travel more slowly over rough terrain than over flat terrain. Smoke will also travel more slowly around buildings than it will over open ground.
How Smoke Travels
Smoke travels through the atmosphere by three main mechanisms: buoyancy, diffusion, and convection.
- Buoyancy is the tendency of a fluid to rise or sink due to differences in density. Smoke is less dense than air, so it rises through the atmosphere by buoyancy.
- Diffusion is the process by which particles spread out from a high concentration to a lower concentration. Smoke particles diffuse through the atmosphere by colliding with other particles and exchanging places.
- Convection is the movement of heat through a fluid. When air is heated, it becomes less dense and rises. This causes the cooler air around it to sink, which in turn causes the heated air to rise even more. This process creates a convection current that can carry smoke particles upward.
The speed at which smoke travels depends on the combination of these three mechanisms. In general, smoke will travel faster when the wind speed is high, the air is warm and humid, and the air pressure is low. Smoke will also travel faster over flat terrain and around buildings.
Smoke is a dangerous pollutant that can cause a number of health problems. It is important to be aware of the factors that affect smoke travel speed so that you can take steps to protect yourself from its harmful effects.
- Stay indoors when there is smoke in the air. If you must go outside, wear a mask that covers your nose and mouth.
- Close all windows and doors to keep smoke from entering your home.
- Turn off your air conditioner and fans. This will help to keep smoke from circulating through your home.
- Vent your dryer outside. Do not use your dryer if there is smoke in the air.
- Keep children and pets indoors. Smoke can be especially harmful to children and pets.
- If you have any health problems, talk to your doctor about how to protect yourself from smoke.
Smoke is a mixture of gases and particles that is produced when something burns. The speed at which smoke travels depends on a number of factors, including the type of fuel that is burning, the temperature of the fire, and the wind speed.
The type of fuel that is burning is one of the most important factors that affects the speed of smoke travel. Solid fuels, such as wood and coal, produce more smoke than liquid fuels, such as gasoline and diesel. This is because solid fuels release more volatile organic compounds (VOCs) when they burn. VOCs are small molecules that evaporate easily and can travel long distances in the air.
The temperature of the fire also affects the speed of smoke travel. The hotter the fire, the faster the smoke will travel. This is because heat causes the gases in smoke to expand and become less dense. Less dense gases rise more quickly, so they travel faster than denser gases.
The wind speed is another important factor that affects the speed of smoke travel. Wind can carry smoke away from the fire, or it can cause smoke to swirl and travel in unpredictable directions. Wind speeds of 10 miles per hour (16 km/h) or more can significantly increase the speed of smoke travel.
The following table provides a general overview of how the speed of smoke travel is affected by the type of fuel, the temperature of the fire, and the wind speed.
| Type of fuel | Temperature of fire | Wind speed | Speed of smoke travel | |—|—|—|—| | Solid fuel | High | High | Fast | | Solid fuel | High | Low | Slow | | Solid fuel | Low | High | Slow | | Solid fuel | Low | Low | Very slow | | Liquid fuel | High | High | Fast | | Liquid fuel | High | Low | Slow | | Liquid fuel | Low | High | Slow | | Liquid fuel | Low | Low | Very slow |
Measuring Smoke Travel Speed
There are two main ways to measure smoke travel speed: direct measurement and indirect measurement.
Direct measurement involves using a device to track the movement of smoke particles. One common method of direct measurement is to use a smoke tracer. A smoke tracer is a small device that emits a stream of smoke. The smoke from the tracer can be tracked using a smoke detector or a camera.
Another method of direct measurement is to use a smoke meter. A smoke meter is a device that measures the concentration of smoke particles in the air. The speed of smoke travel can be calculated by measuring the change in the concentration of smoke particles over time.
Indirect measurement involves using a model to predict the speed of smoke travel. A smoke model is a mathematical equation that describes how smoke particles move through the air. The speed of smoke travel can be calculated by solving the smoke model.
The following table provides a comparison of the two methods of measuring smoke travel speed.
| Method | Advantages | Disadvantages | |—|—|—| | Direct measurement | Provides accurate measurements | Can be difficult to set up and use | | Indirect measurement | Can be used in areas where direct measurement is not possible | Less accurate than direct measurement |
Applications of Smoke Travel Speed
The speed of smoke travel is used in a variety of applications, including firefighting, air quality monitoring, and weather forecasting.
Firefighting
The speed of smoke travel is an important factor in firefighting. Firefighters need to know how fast smoke is traveling in order to determine how quickly they need to evacuate a building. Smoke that travels quickly can create a dangerous situation for firefighters and civilians.
Firefighters use a variety of tools to measure smoke travel speed, including smoke meters and smoke tracers. Smoke meters measure the concentration of smoke particles in the air, and smoke tracers emit a stream of smoke that can be tracked using a smoke detector or a camera.
Air quality monitoring
The speed of smoke travel is also used in air quality monitoring. Smoke can contain harmful pollutants, such as particulate matter and carbon monoxide. The speed of smoke travel can affect the distribution of these pollutants in the air.
Air quality monitors measure the concentration of pollutants in the air. The speed of smoke travel can be calculated by tracking the movement of smoke plumes using a smoke detector or a camera.
Weather forecasting
The speed of smoke travel is also used in weather forecasting. Smoke can affect the formation of clouds and fog. Smoke can also trap heat in the atmosphere, which can lead to warmer temperatures.
Weather forecasters use a variety of tools to measure smoke travel speed, including smoke meters and smoke tracers. Smoke meters measure the concentration of smoke particles in the air, and smoke tracers emit a stream of smoke that can be tracked using a smoke detector or a camera.
How fast does smoke travel?
The speed of smoke depends on a number of factors, including the temperature of the smoke, the density of the smoke, and the wind speed. In general, smoke travels at a speed of about 10-15 feet per second. However, this speed can vary significantly depending on the conditions.
What factors affect the speed of smoke?
The following factors affect the speed of smoke:
- Temperature: The hotter the smoke, the faster it will travel. This is because hot air is less dense than cold air, and so it rises more quickly.
- Density: The denser the smoke, the slower it will travel. This is because dense smoke is more difficult to move through.
- Wind speed: The wind speed will also affect the speed of smoke. If the wind is blowing, it will carry the smoke along with it.
What are the implications of smoke travel speed?
The speed of smoke travel can have a number of implications, including:
- Fire spread: The faster smoke travels, the more quickly a fire can spread. This is because smoke can carry heat and embers, which can ignite new fires.
- Health risks: Smoke can contain harmful chemicals, such as carbon monoxide and particulate matter. The faster smoke travels, the more people it can expose to these harmful chemicals.
- Visibility: Smoke can reduce visibility, which can make it difficult to see and navigate. This can be a safety hazard, especially for drivers and pilots.
How can I reduce the speed of smoke travel?
There are a number of things you can do to reduce the speed of smoke travel, including:
- Keep your home well-ventilated. This will help to disperse smoke and prevent it from building up.
- Install smoke alarms. Smoke alarms can alert you to a fire early, giving you time to evacuate and escape the smoke.
- Be aware of the weather conditions. If there is a high wind, be prepared for smoke to travel quickly.
Here are some key takeaways from this article:
- Smoke is a mixture of gases and particles that is produced when something burns.
- The speed of smoke depends on a number of factors, including the temperature of the smoke, the density of the smoke, and the presence of wind.
- Smoke can travel at speeds of up to 100 miles per hour.
- Smoke can be a serious hazard, so it is important to be aware of its risks and take steps to protect yourself from it.
Author Profile

Latest entries
- January 19, 2024 Hiking How to Lace Hiking Boots for a Perfect Fit
- January 19, 2024 Camping How to Dispose of Camping Propane Tanks the Right Way
- January 19, 2024 Traveling Information Is Buffalo Still Under Travel Ban? (Updated for 2023)
- January 19, 2024 Cruise/Cruising Which Carnival Cruise Is Best for Families?

Are Fire Engines Speed Restricted? How Fast Can They Go?
When motorists hear sirens, they are supposed to move over and allow the emergency vehicle to pass. Unfortunately, this does not always happen. When drivers do not get out of the way of emergency vehicles, it creates an unsafe situation for drivers, firefighters, and those needing assistance. Firetruck drivers have numerous factors to contend with to minimize the risk of an accident.
Local laws define the rules governing the speed of a fire truck, but the expectation is the driver should not exceed a safe speed. This safe speed is determined by weather conditions and other circumstances, including the design of the vehicle and how familiar the driver is with the vehicle.
In this article, the regulations and policies regarding fire engines and truck speeds will be explained, as well as general courtesies that other motorists on the road are expected to give emergency vehicles.
Your # 1 priority is keeping your family safe. As a firefighter, I recommend everyone has updated smoke detectors that don’t require battery changes, like these ones from Kidde , a fire extinguisher, like this one from Amerex , and a fire escape ladder if you have bedrooms above the first floor, I recommend this one from Hausse.
To learn about the differences between a fire engine and a fire truck, read: What’s the Difference Between a Fire Engine and a Fire Truck?
Posted Speed Limits and Traffic Laws

The rules for the speed of fire engines depend on their location. Fire departments can establish their own rules regarding the maximum speed of a fire engine.
According to the International Association of Fire Chiefs’ “ Guide to IAFC Model Policies and Procedures For Emergency Vehicle Safety ,” they all follow similar guidelines. States have specific laws regarding provisions made for those responding to an emergency, but the fire department’s expectations are often more stringent than state law.
Failure to Obey – Consequences
There are times that drivers do not obey the laws, and their vehicles get in the way of the fire department arriving at their destination.
- Officers of fire departments can remove vehicles on public or private property that get in the way of firefighters responding to an emergency.
- A police officer may give a citation to the person who does not obey the laws when a firefighter is on their way to an emergency or taking someone to a hospital.
Other Drivers on the Road
One of the contributing factors to dangerous road conditions for fire engines is the failure of other motorists to yield to the sirens and lights of emergency vehicles. Motorists should pull to the right edge of the road and come to a stop. If that is not possible, drivers should slow down and leave a path free for the fire truck or other emergency vehicles to get through.
Many people will move to the right, but instead of stopping will just slow down, waiting till the emergency vehicle passes so they can be the first back on the road. Please do not do this, as it can’t make the situation more dangerous for all drivers. By coming to a stop, the drivers of the fire apparatus are able to safely negotiate around everyone and get where they need to go, without anyone else being hurt.
Move Over Laws
Though the details of these laws vary from one state to another, motorists need to know that fire trucks and other emergency vehicles have the right of way, and according to “ State Move Over Laws .”
- If the vehicle is on the road and sees flashing emergency lights behind them, that is a signal that the cars on the road should move over to the right and stop.
Move Over Laws are enforced in all 50 states and failure to abide by them can result in fines from $50 – $10,000, up to 90-day license suspension, or even up to 60 days in jail.
Time, Pressure, and Consequences
When fire trucks and other emergency personnel are on the road with sirens on (called Code 3), they are typically on their way to help someone else who is experiencing a crisis. If these emergency vehicles are in accidents themselves, it delays the response to the crisis at hand.
According to Hongwei Hsiao, et al. in the research titled “ Preventing Emergency Vehicle Crashes: Status and Challenges of Human Factors: Status and Challenges of Human Factors Issues ,” time pressure is one of the most dangerous characteristics of driving an emergency vehicle.
The sense of urgency to get to the destination causes drivers to want to speed. This urgency, in turn, which leads to a higher likelihood of crashes. The pressure of time is also known to impact decision-making and increases the possibility that a driver will take risks.
The goal of firefighters driving a fire engine is to arrive safely at their destination. Usually, they are on their way to help with a crisis of someone in the community who might be facing a catastrophic incident. We are trained to remain calm, make good, safe decisions and remember that the call we are responding to is not our emergency; so we need to get there safely in order to be of any help.
There are local rules in place to ensure firefighters arrive at their destination safely. Generally, these expectations include extreme diligence to safety rules on the road. It has been researched and recognized that firefighters can sometimes be under stress while on their way to emergencies, and improvements are being made regarding training and warning lights.
How to Reduce Accidents

According to research performed by Kelly Donoughe, et al. for the Associate for the Advancement of Automotive Medicine titled “ Analysis of Fire Truck Crashes and Associated Firefighter Injuries in the United States ,” fire apparatus crashes happen at a rate of about 30,000 a year. Though this is less than 1% of the total 6 million car accidents in the US each year, it is a number that should be improved upon.
This high level of crashes leads to significant consequences for many members of the community because the firetrucks are on their way to provide emergency assistance elsewhere in the community.
Also, data shows firefighters frequently fail to use their seatbelts when driving or riding in a fire truck , putting themselves at significant risk for life-threatening injuries when accidents happen. Many fire departments, including the one I work for, have installed seatbelt alarms to ensure all members are safely restrained while the vehicle is moving.
The United States Fire Administration’s (USFA) research shows that 16% of firefighter deaths in the line of duty were the result of motor vehicle crashes. This research prompted the USAF to start new projects to address the problem by doing a risk assessment.
Response Policies to Reduce Accidents
Because of the frequency of accidents, while firefighters were responding to emergencies, policies were put into place as a response. Davis P. Bui et al. discusses the risk management and decisions to help protect the community in his research titled, “ Risk management of emergency service vehicle crashes in the United States fire service: process, outputs, and recommendations .”
The research discovered high priority issues such as turning and rear-end crashes, as well as weather and road conditions impacting accidents. These findings led to new policies and procedures to help drivers. For instance, in some areas, backup cameras were installed, and firefighters saw an increase in training.
In “ Alive on Arrival ,” the USAF gives further recommendations to keep emergency personnel safe when operating a fire engine:
- Drive carefully and assume other drivers cannot see you.
- Do not drive faster than the speed limit.
- Stop at intersections.
- Be cautious at railways with no guards.
- Park off the road if possible and use emergency warning if parking on the roadway is necessary.
Currently, the USAF is working on a project involving emergency vehicle warning light systems to help drivers’ confusion when they see lights. If technology is improved, it is expected that communities will be safer.
Conclusion
The United States Fire Administration is working with local fire departments and communities to educate the general public on how to behave on the roadways when a fire engine is trying to get to a destination in an emergency.
Local fire departments have set up their own rules regarding roadway safety for the drivers of the fire engines. Often, these rules are stricter than those defined by individual state law. Drivers are expected to drive the speed limit, observe all traffic laws, and keep weather and road conditions in mind while making decisions.
In the end, the goal is for the public to be mindful and aware of what they should do on the road, so the firefighters on the fire engine can arrive at their destination safely to ensure the best outcome for those who are waiting for emergency help.
Related Articles
How to Become a Firefighter Driver/Engineer
The 11 Best Firefighter Documentaries
How Wide and Long Is A Fire Truck/Engine?
Related Posts
Do Firefighters Sleep at the Station?
Why Firefighters Are Always Washing Their Trucks
About the author.

Leave a Comment
Your email address will not be published. Required fields are marked *
Houston soars in Forbes' top 10 best cities for summer travel

HOUSTON, Texas (KTRK) -- Looks like people from all over the country will be flocking to Houston this summer - at least according to a new report by Forbes Advisor.
The report listed the best and worst cities for summer travel and Houston fared surprisingly well, coming in as the No. 10 best summer travel destination in the nation.
The study, published June 1, compared 43 of the most populous U.S. cities across 16 metrics in three major categories: City experience, air travel experience, and driving experience.
To read the rest of this story, visit our partners at Houston CultureMap .
Related Topics
What June's solstice strawberry moon means for your zodiac

Water safety: Expert shares mistakes to avoid amid rise in drownings

Expert hydration tips to stay cool amid sweltering heat this summer

Best beach towels 2024
Top stories.
3 adults dead after home invasion in west Houston, HPD says

Texas A&M's 5-run 3rd inning tops Tennessee in MCWS Final Game 1
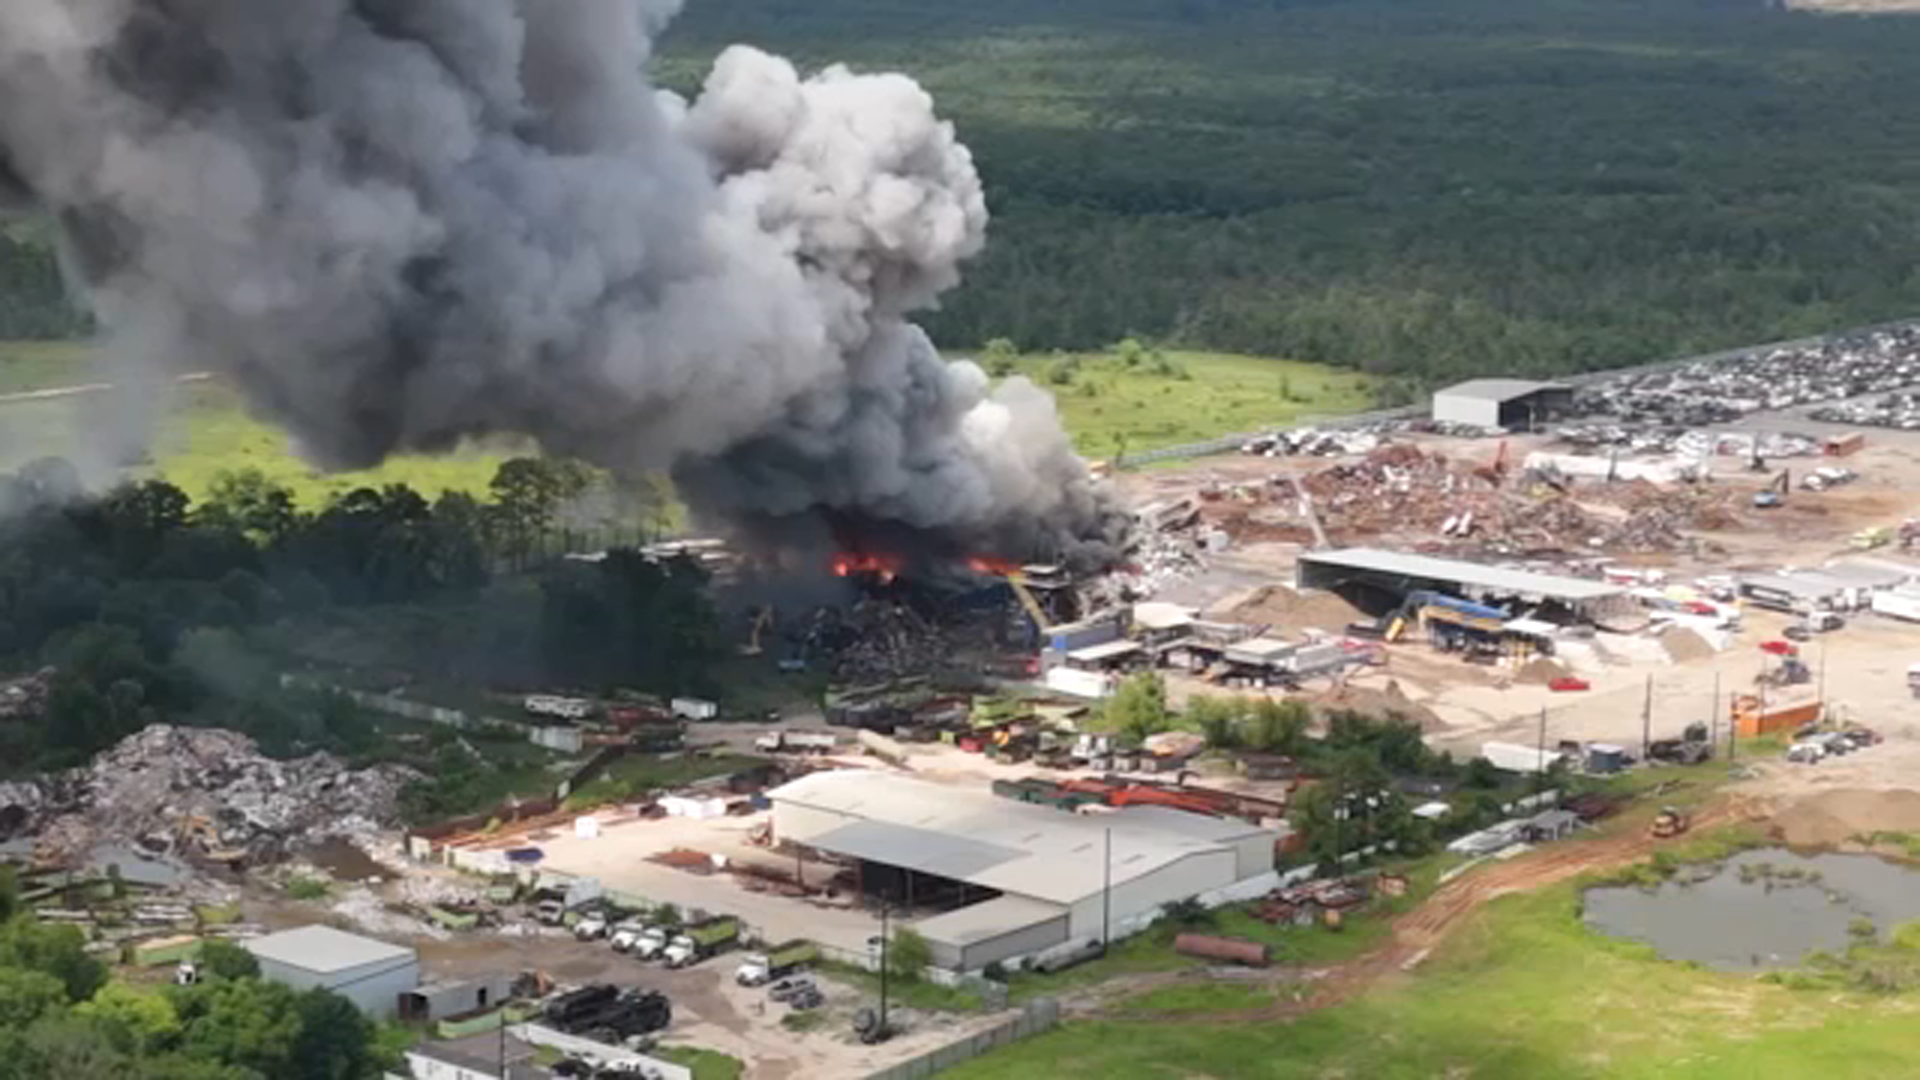
4 injured in recycling plant fire, dark smoke visible in NE Harris Co.

Houston's New Faces of Pride parade welcomed by thousands
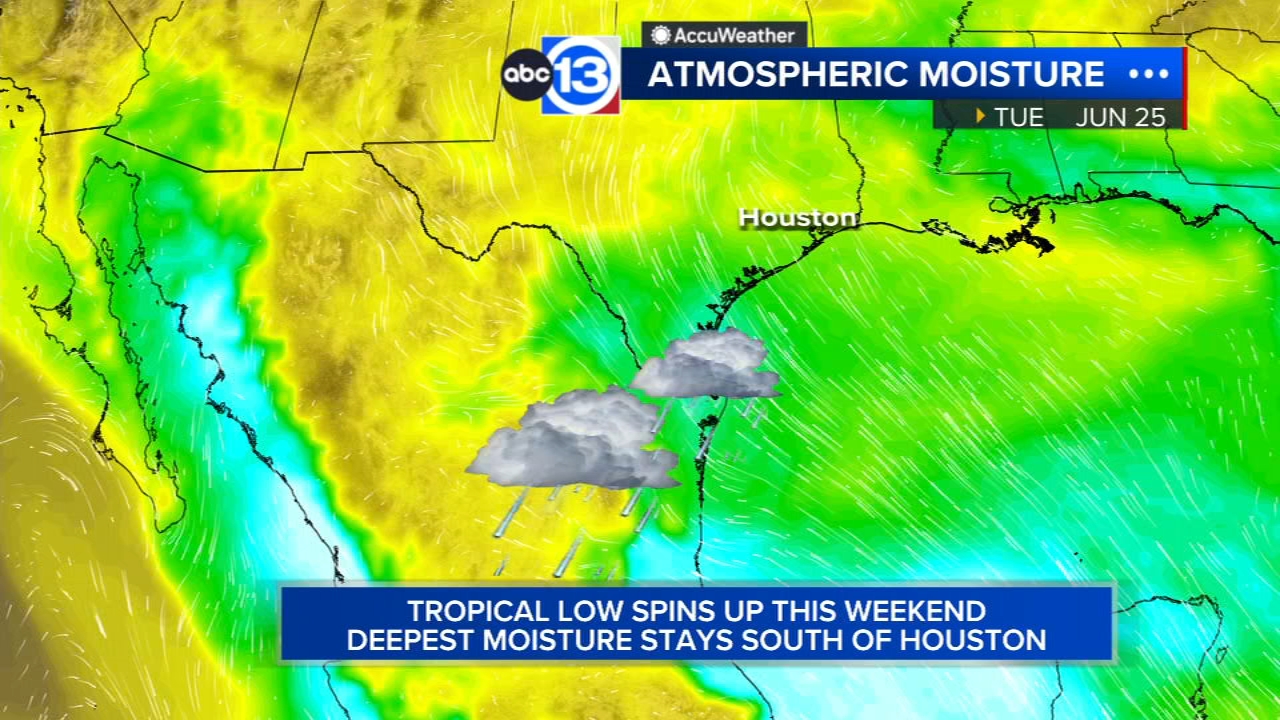
Eye on the Gulf: New zone to watch for tropical development
Summertime heat returns, mainly dry with a stray shower for Sunday
2 suspects in Jocelyn Nungaray case no-shows in court: officials
Man killed in Hwy 99 hit-and-run, suspect vehicle parts at scene: HPD
IMAGES
VIDEO
COMMENTS
Wildfire Speed Explained. Wildfires spread at an average of 14.27 miles per hour. 1 However, this can vary hugely depending on a number of factors, such as weather conditions, fuel type, and terrain. As a human observer, it can be very difficult to accurately estimate how fast a wildfire is encroaching, and it is common for people to ...
A wildfire's speed is often judged as its forward rate of spread, which describes the pace at which its leading edge advances perpendicular to the fire front. The authors of the book "Grassfires: Fuel, Weather and Fire Behaviour" indicate that the general maximum speed of between 16 and 20 kilometers per hour (9 to 12.5 mph) for wildfires.
The rates of fire spread and corresponding wind speeds ranged from 0.8-8.0 km/h (0.5-5.0 mi/h) and 30- 100 km/h (19-62 mi/h), respectively. ... THE DOMINANT CONTROL OF WIND SPEED DURING SEVERE BURNING CONDITIONS The results of the Cruz et al. (2020) study have substantiated the strong control that wind speed exerts on the forward spread rate of ...
Country Fire Authority (CFA) / Victoria State Government, Australia. Fires can travel quickly: up to 6 miles-per-hour in forests and up to 14 miles-per-hour in grasslands. If you have an upward ...
Once a fire begins, it can spread at a rate of up to 14.29 miles per hour (23 kph), consuming everything in its path. ... (328 feet) at a speed of 100 mph (161 kph). These bursts leave a scorched region and lead to fire spread. ... Unlike humans, fires usually travel uphill much faster than downhill. The steeper the slope, the faster the fire ...
Downslope winds are very shallow and of a slower speed than upslope winds, generally 2-5mph. The cooled denser air is stable and the downslope flow, therefore, tends to be laminar. Valley Winds are similar to and linked with slope winds. Their development each day generally lags 1-3 hours behind that of slope winds.
Wikipedia says this about the rate at which a wildfire can spread: They can move as fast as 10.8 kilometers per hour (6.7 mph) in forests and 22 kilometers per hour (14 mph) in grasslands. This ...
8.3 Rate of Spread. The rate of spread is in chains per hour (ch/h) and is defined as the speed with which the fire is moving away from the site of origin. Wind, moisture, and slope drive the fire. The flaming zone, or fire head, moves away from the origin quickly with great intensity.
The collective analysis of a relatively large number of wildfire observations documented in conifer forests, dry eucalypt forests and temperate shrublands revealed that the forward rate of fire spread is roughly 10% of the average 10-m open wind speed, provided both are expressed in the same units (e.g. km h −1 ). Knowledge of a wildfire's forward spread rate is a prerequisite for defining ...
A 10-degree increase in slope usually results in a doubling of the speed of the fire. Fire will spread up a 20-degree slope four times as fast as it will along flat ground. Fires advance at different speeds when going uphill as compared to downhill. Wind speed is the environmental variable that has the most significant effect on the spread of ...
Here's a typical timeline of a 2-story house being engulfed by fire: At 0:30 minutes, the fire starts and rapidly grows. At 1:04 minutes, the fire spreads from the initial flame, and the room begins to fill with smoke. At 1:35 minutes, the temperature of the house goes higher than 190°F while the smoke layer rapidly descends.
According to Mercury Insurance information from the Western Fire Chiefs Association, wildfires typically travel at around 14.3 miles per hour. That's about a mile every four minutes and 20 seconds ...
Tom Kines, a senior meteorologist at AccuWeather, explains that the smoke people are seeing was able to spread all the way from Canada because of how copious and ongoing the fires are. "These ...
During a fire, embers can travel up to 40 kilometres ahead of the fire front and fire speeds can reach over 25 kilometres per hour. Remember, on high-risk fire days, leaving early before a fire starts, is always the safest option. ... For every 10˚ slope, the fire will double its speed. For example, if a fire is traveling at 5 km per hour ...
Dashcam footage captured by the Dunmore Rural Fire Brigade on 4 January 2020. The footage shows just how quickly a bushfire can move when the wind changes di...
Smoke trapped at lower altitudes is far less likely to travel more than a few hundred miles. This smoke typically only affects the surrounding local communities near the fire. But larger, more powerful wildfires can launch smoke to far higher altitudes. This can result in smoke traveling thousands of miles in the earth's stratosphere.
Fire Behavior Normals. Rate of Spread (ROS) is the predicted speed of the fire at the front or head of the fire (where the fire moves fastest), and takes into account both crowning and spotting. It is measured in metres per minute and is based on the Fuel Type, Initial Spread Index, Buildup Index, and several fuel-specific parameters such as ...
Factors Affecting Smoke Travel Speed. Wind speed is the most important factor affecting smoke travel speed. The faster the wind, the faster the smoke will travel. This is because the wind provides a force that pushes the smoke particles away from the source of the fire. Temperature also affects smoke travel speed. Warmer air is less dense than ...
Minimum Travel Time Fire Spread (MTT) simulates fire spread and behavior based on user-specified ignitions and optional barriers. A single set of constant weather inputs is applied for the analysis duration. Outputs from MTT are useful in identifying potential spread pathways, rates, patterns, and distances over time. ... Wind speed (mph) 5: 14 ...
NFPA 1710 Travel Time and ISO. NFPA 1710 § 4.1.2.1 (3) establishes a travel time of 240 seconds or less for the arrival of the first arriving engine company at a fire suppression incident. Using the equation T = 0.65 + 1.7D, where D equals 1.5 miles, ISO determined that the travel time for the first arriving engine is 192 seconds (3.2 minutes).
Yes. Air pressure directly correlates with the amount of oxygen per unit of volume. Since fire burns better, the more oxygen it gets, air pressure does have an effect on the speed at which fire "travels".
Local laws define the rules governing the speed of a fire truck, but the expectation is the driver should not exceed a safe speed. This safe speed is determined by weather conditions and other circumstances, including the design of the vehicle and how familiar the driver is with the vehicle. In this article, the regulations and policies ...
The speed at which a forest fire can travel depends on a number of factors, including the type of fuel that is burning, the wind speed and direction, and the terrain. In general, fires can travel at speeds of up to 10 miles per hour. However, if the wind is blowing in the opposite direction of the fire, the fire can actually slow down.
A dangerous heat wave scorching parts of the Midwest and Northeast will ratchet up in New York and the I-95 corridor, while deadly wildfires that claimed at least two lives and destroyed over a ...
Two wildfires burned through thousands of acres in New Mexico and residents were ordered to evacuate as the fires developed rapidly. Videos show smoke from the fire billowing into the sky, looking ...
SEATAC, Wash. — A driver is in custody after a high-speed, multi-vehicle crash injured three and killed one in SeaTac late Friday afternoon. Puget Sound Fire first tweeted about the crash on the ...
The study, published June 1, compared 43 of the most populous U.S. cities across 16 metrics in three major categories: City experience, air travel experience, and driving experience.
New York City-area airports Newark and JFK saw the second and third-fastest airport Wi-Fi speeds in the US, respectively. Newark tested at 166Mbps median download and 152Mbps upload speeds, while ...
Get Sky Sports. Follow the latest football news, gossip and rumours ...
A new high-speed sleeper train service is making that possibility easier than ever. Two new overnight routes connecting the city with Beijing and Shanghai entered into service on June 15. Both ...