COVID-19 impact on tourism could deal $4 trillion blow to global economy: UN report

Facebook Twitter Print Email
The impact of the COVID-19 pandemic on tourism could result in a more than $4 trillion loss to the global economy, UN trade and development body UNCTAD said on Wednesday in a report issued jointly with the UN World Tourism Organization ( UNWTO ).
The estimate is based on losses caused by the pandemic’s direct impact on tourism and the ripple effect on related sectors, and is worse than previously expected.
𝗕𝗿𝗲𝗮𝗸𝗶𝗻𝗴. @ UNCTAD and @ UNWTO have published an update on the effects of #COVID19’s impact on tourism. The crash in international tourist arrivals since the pandemic started could cost the world economy $4 trillion by the end of 2021. https://t.co/b3NJ4CDTwD pic.twitter.com/FbfiupmRoB UNCTAD UNCTAD
Last July, UNCTAD estimated that the standstill in international tourism would cost the global economy between $1.2 trillion and $3.3 trillion.
The steep drop in tourist arrivals worldwide in 2020 resulted in a $2.4 trillion economic hit, the report said, and a similar figure is expected this year depending on the uptake in COVID-19 vaccines.

Global vaccination plan crucial
“The world needs a global vaccination effort that will protect workers, mitigate adverse social effects and make strategic decisions regarding tourism, taking potential structural changes into account,” said Isabelle Durant, the UNCTAD Acting Secretary-General.
“Tourism is a lifeline for millions, and advancing vaccination to protect communities and support tourism’s safe restart is critical to the recovery of jobs and generation of much-needed resources, especially in developing countries, many of which are highly dependent on international tourism,” the UNWTO Secretary-General Zurab Pololikashvili added.

Developing countries hit hard
International tourist arrivals declined by about 1 billion, or 73 per cent, last year, while in the first quarter of 2021 the drop was around 88 per cent, the report said.
Developing countries have borne the brunt of the pandemic’s impact on tourism, with estimated reductions in arrivals of between 60 per cent and 80 per cent.
They have also been hurt by vaccine inequity. The agencies said the “asymmetric roll-out” of COVID-19 vaccines has magnified the economic blow to the tourism sector in these nations, as they could account for up to 60 per cent of global GDP losses.
Rebound amid losses
It is expected that tourism will recover faster in countries with high vaccination rates, such as France, Germany, the United Kingdom and the United States.
However, international tourist arrivals will not return to pre-pandemic levels until 2023 or later, due to barriers such as travel restrictions, slow containment of the virus, low traveller confidence and a poor economic environment.
While a tourism rebound is anticipated in the second half of this year, the report expects a loss of between $1.7 trillion and $2.4 trillion in 2021, based on simulations which exclude stimulation programmes and similar policies.
As tourism falls world GDP takes a hit in 2021

Likely outcomes
The authors outline three possible scenarios for the tourism sector this year, with the most pessimistic reflecting a 75 per cent reduction in international arrivals.
This scenario sees a drop in global tourist receipts of nearly $950 billion, which would cause a loss in real GDP of $2.4 trillion, while the second reflects a 63 per cent reduction in international tourist arrivals.
The third considers varying rates of domestic and regional tourism. It assumes a 75 per cent reduction in tourism in countries where vaccine rates are low, and 37 per cent reduction in countries with relatively high vaccination levels, mainly developed countries and some smaller economies.
- Regional Support Office for Asia and the Pacific (RSOAP)
- Member States in Asia and the Pacific
- SUSTAINABLE TOURISM OBSERVATORIES (INSTO)

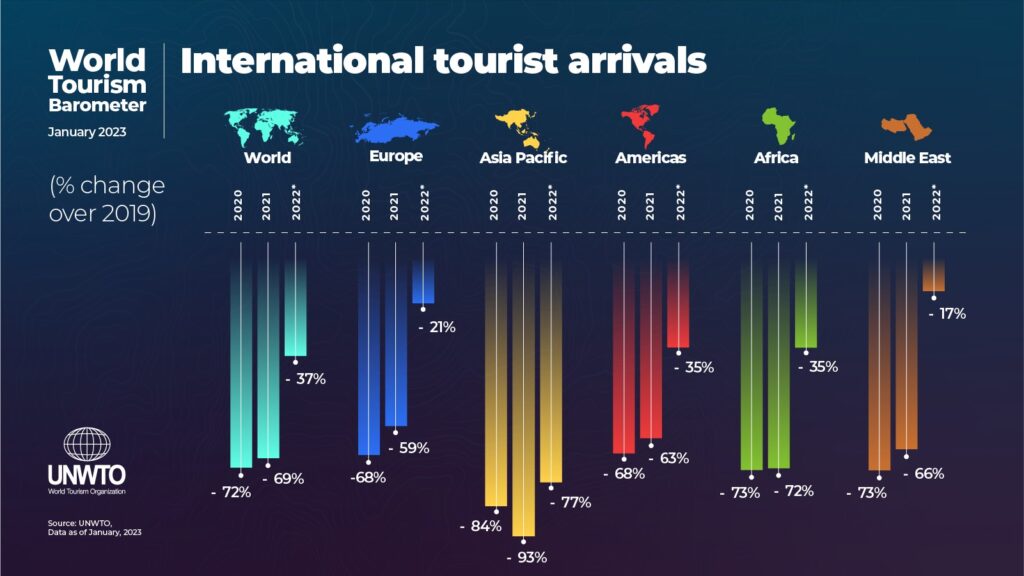
According to new data from UNWTO , more than 900 million tourists traveled internationally in 2022 – double the number recorded in 2021.
Tourism recovery is foreseen to continue throughout 2023 even as the sector faces economic, health and geopolitical challenges. The recent lifting of COVID-19 related travel restrictions in China, the world’s largest outbound market in 2019, is a significant step for the recovery of the tourism sector in Asia, the Pacific, and worldwide.
All regions enjoyed significant increases in 2022 over the previous year, and are well on their way to seeing pre-pandemic tourist arrivals.
The resumption of travel from China is likely to benefit Asian destinations in particular. However, the choice of destinations will be shaped by the availability and cost of air travel, visa regulations, and processes, as well as COVID-19-related restrictions. Current travel restrictions can be found in the UNWTO/IATA Destination Tracker .
Based on UNWTO’s scenarios for 2023, international tourist arrivals could reach 80% to 95% of pre-pandemic levels this year, with Europe and the Middle East expected to reach those levels. However, important risks remain ahead, especially economic and geopolitical.
According to the latest survey of the Panel of Experts, the challenging economic environment including high inflation and interest rates, the spike in oil and food prices, as well as the fears of a global recession, continues to be the main factor weighing on the recovery of tourism.

An excerpt of the World Tourism Barometer issue for January 2023 is available here .
And updated information on destination tourism performance can be found on UNWTO’s Recovery Tracker .
LEAVE A REPLY Cancel reply
Save my name, email, and website in this browser for the next time I comment.
Regional Support Office in Asia and the Pacific (RSOAP)
Rsoap a to z.
- Sustainable Tourism Observatories(INSTO)
UNWTO A to Z
- About UNWTO
- Affiliate Members
- Member States
- Tourism in the 2030 Agenda
- World Tourism Day
- Technical Cooperation
- ASIA AND THE PACIFIC
- MIDDLE EAST
- RESOURCES/SERVICES
- Sustainable Development of Tourism
- Ethics, Culture and Social Responsibility
- Market Intelligence
- Tourism Data Dashboard
- Publications
- UNWTO Academy
Partners links

© UNWTO Regional Support Office for Asia and the Pacific (RSOAP)

- Press Releases
- Press Enquiries
- Travel Hub / Blog
- Brand Resources
- Newsletter Sign Up
- Global Summit
- Hosting a Summit
- Upcoming Events
- Previous Events
- Event Photography
- Event Enquiries
- Our Members
- Our Associates Community
- Membership Benefits
- Enquire About Membership
- Sponsors & Partners
- Insights & Publications
- WTTC Research Hub
- Economic Impact
- Knowledge Partners
- Data Enquiries
- Hotel Sustainability Basics
- Community Conscious Travel
- SafeTravels Stamp Application
- SafeTravels: Global Protocols & Stamp
- Security & Travel Facilitation
- Sustainable Growth
- Women Empowerment
- Destination Spotlight - SLO CAL
- Vision For Nature Positive Travel and Tourism
- Governments
- Consumer Travel Blog
- ONEin330Million Campaign
- Reunite Campaign

Economic Impact Research
- In 2023, the Travel & Tourism sector contributed 9.1% to the global GDP; an increase of 23.2% from 2022 and only 4.1% below the 2019 level.
- In 2023, there were 27 million new jobs, representing a 9.1% increase compared to 2022, and only 1.4% below the 2019 level.
- Domestic visitor spending rose by 18.1% in 2023, surpassing the 2019 level.
- International visitor spending registered a 33.1% jump in 2023 but remained 14.4% below the 2019 total.
Click here for links to the different economy/country and regional reports
Why conduct research?
From the outset, our Members realised that hard economic facts were needed to help governments and policymakers truly understand the potential of Travel & Tourism. Measuring the size and growth of Travel & Tourism and its contribution to society, therefore, plays a vital part in underpinning WTTC’s work.
What research does WTTC carry out?
Each year, WTTC and Oxford Economics produce reports covering the economic contribution of our sector in 185 countries, for 26 economic and geographic regions, and for more than 70 cities. We also benchmark Travel & Tourism against other economic sectors and analyse the impact of government policies affecting the sector such as jobs and visa facilitation.
Visit our Research Hub via the button below to find all our Economic Impact Reports, as well as other reports on Travel and Tourism.

Travel & Tourism Development Index 2024

The Travel & Tourism Development Index (TTDI) 2024 is the second edition of an index that evolved from the Travel & Tourism Competitiveness Index (TTCI) series, a flagship index of the World Economic Forum that has been in production since 2007. The TTDI is part of the Forum’s broader work with industry and government stakeholders to build a more sustainable, inclusive, and resilient future for economies and local communities.
- Publications
- Interactive data and economy profiles
Travel & Tourism Development Index 2024

1. About the Travel & Tourism Development Index 2024
The index provides a strategic benchmarking tool for business, governments, international organizations and others to develop the travel & tourism sector..

First introduced in 2022, the Travel & Tourism Development Index (TTDI) benchmarks and measures the set of factors and policies that enable the sustainable and resilient development of the Travel & Tourism (T&T) sector, which in turn contributes to the development of a country. The index is a direct evolution of the Travel & Tourism Competitiveness Index (TTCI), which has been published biennially since 2007. By allowing cross-country comparison and by benchmarking countries’ progress on the drivers of T&T development, the index informs policies and investment decisions related to the development of T&T businesses and the sector as a whole. It also offers unique insights into the strengths and areas for improvement of each country to support their efforts to enhance the long-term growth of their T&T sector in a sustainable and resilient manner. In particular, the TTDI provides a strategic and holistic overview of the tourism economy, including internal and external enablers of T&T development and their interdependent nature. Furthermore, it provides a valuable platform for multistakeholder dialogue, enabling stakeholders to formulate appropriate policies and actions at local, national, regional and global levels.
The 2024 edition of the TTDI was produced in collaboration with the University of Surrey. As the index knowledge partner, the university provided valuable technical and strategic support for the TTDI and related content. This edition of the index also includes several improvements that are designed to take advantage of newly available data such as the World Travel and Tourism Council (WTTC)’s recently developed indicators on the environmental and social impact of T&T, to make the index more T&T-specific, concise and consistent in its country coverage.
Please note that the changes made to the index limit its comparability to the previously published TTDI 2021. Therefore, this release of the index includes recalculated 2019 and 2021 results, using new adjustments. TTDI 2024 results reflect the latest available data at the time of collection (end of 2023) .
Many of the improvements made to the index are based on stakeholder feedback and input from the TTDI Advisory Group, which includes representatives from Bloom Consulting, the European Travel Commission (ETC), the Global Sustainable Tourism Council (GSTC), the Hong Kong Polytechnic University, the International Air Transport Association (IATA), JLL Hotels & Hospitality Group, Mastercard, New York University, the Pacific Asia Travel Association (PATA), Trip.com Group, the United Nations World Tourism Organization (UN Tourism), the University of Surrey, Visa, the World Bank and WTTC.
In addition, the index relies on close collaboration with the following data partners: AirDNA, Bloom Consulting, CoStar, Euromonitor International, GlobalPetrolPrices.com, IATA, the International Civil Aviation Organization (ICAO), the International Union for Conservation of Nature (IUCN), MMGY TCI Research, Tripadvisor, UN Tourism and WTTC.
For more detailed information on the TTDI methodology and the new framework, country peer and income-group classification, indicator details and partner information, and to explore the index results through interactive data visualizations, please visit the index website or see the Technical notes and methodology section of the report.

1.1 Index overview
The index is comprised of five dimensions, 17 pillars and 102 individual indicators, distributed among the different pillars. However, the five dimensions are not factored into the calculation of the index and are used only for presentation and categorization purposes.
Figure 1: TTDI framework

The Enabling Environment dimension captures the general conditions necessary for operating and investing in a country and consists of five pillars:
- Business Environment : This pillar captures the extent to which a country’s policy environment is conducive to companies doing business and investing.
- Safety and Security : This pillar measures the extent to which a country exposes locals, tourists and businesses to security risks.
- Health and Hygiene : This pillar measures healthcare infrastructure and accessibility and health security.
- Human Resources and Labour Market : This pillar measures the availability of quality employees and the dynamism, resilience and equality of the labour market, as well as the level of protection for workers. It consists of the Qualification of the Labour Force, Labour Market Dynamics and Labour Market Resilience and Equality subpillars.
- ICT Readiness : This pillar measures the availability and use of information and communication technology infrastructure and digital services.

The T&T Policy and Enabling Conditions dimension captures specific policies or strategic aspects that affect the T&T sector more directly and consists of three pillars:
- Prioritization of T&T : This pillar measures the extent to which the government actively promotes, tracks and invests in the development of the T&T sector.
- Openness to T&T : This pillar measures how open a country is to visitors and facilitating cross-border travel.
- Price Competitiveness : This pillar measures how costly it is to travel or operate in a country.
The Infrastructure and Services dimension captures the availability and quality of physical infrastructure and tourism services and consists of three pillars:
- Air Transport Infrastructure : This pillar measures the extent to which a country’s infrastructure offers sufficient air connectivity and access for travellers domestically and internationally.
- Ground and Port Infrastructure : This pillar measures the availability of efficient and accessible ground and port transportation services and infrastructure.
- Tourist Services and Infrastructure : This pillar measures investment in, and the availability and productivity of, tourist services and infrastructure.
The Travel & Tourism Resources dimension captures the principal “reasons to travel” to a destination and consists of three pillars:
- Natural Resources : This pillar measures the available natural capital as well as the development of outdoor tourism activities. Natural capital is defined in terms of landscape, natural parks and the richness of the fauna. To an extent, this pillar captures how natural resources are promoted rather than the actual existing natural heritage of a country.
- Cultural Resources : This pillar measures the availability of cultural resources such as archaeological sites and entertainment facilities. To an extent, this pillar captures how cultural resources are promoted and developed rather than the actual existing cultural heritage of a country.
- Non-Leisure Resources : This pillar measures the extent and attractiveness of factors that drive business and other non-leisure travel, including the presence of global cities, major corporations and leading universities.
The Travel & Tourism Sustainability dimension captures the current or potential sustainability challenges and risks facing T&T and consists of three pillars:
- Environmental Sustainability : This pillar measures the travel and tourism sector’s energy sustainability and the general sustainability of an economy’s natural environment and the protection of natural resources. It consists of the T&T Energy Sustainability, Pollution and Environmental Conditions, and Preservation of Nature subpillars.
- T&T Socioeconomic Impact : This pillar measures the economic and social impact of T&T, including induced economic contribution, the provision of high-wage jobs and workforce gender equality.
- T&T Demand Sustainability : This pillar measures factors that may indicate the existence of, or risk related to, overcrowding, demand volatility and other potentially unsustainable demand trends.
1.2 Data and methodology
Most of the dataset for the TTDI is statistical data from international organizations, with the remainder based on survey data from the World Economic Forum’s annual Executive Opinion Survey, which is used to measure concepts that are qualitative in nature or for which internationally comparable statistics are not available for enough countries.
The sources of statistical data include, but are not limited to, AirDNA, Bloom Consulting, Euromonitor International, IATA, ICAO, the International Labour Organization (ILO), the International Telecommunications Union (ITU), the IUCN, CoStar, Tripadvisor, the United Nations Educational, Scientific and Cultural Organization (UNESCO), UN Statistics Division, UN Tourism, the World Health Organization (WHO), the World Bank, the CIA World Factbook, the World Trade Organization (WTO), WTTC and the World Database on Protected Areas (WDPA).
The overall TTDI score is computed through successive aggregations of scores, from the indicator level (e.g. the lowest, most disaggregated level) through the pillar levels, using a simple average (i.e. the arithmetic mean) to combine the components. Scores on each indicator are first normalized and rated on a common scale of 1 to 7, with 1 being the worst and 7 being the best outcome.
1.3 Economy coverage
The TTDI covers 119 economies. Economies that were covered in the TTDI 2021 but are not covered in the TTDI 2024 are Cape Verde, Chad, Hong Kong SAR, Lesotho and Yemen. Economies added to the 2024 TTDI are Algeria, Barbados, Iran, Jamaica, Oman, Uzbekistan and Zimbabwe.

Now boarding: Faces, places, and trends shaping tourism in 2024
After falling by 75 percent in 2020, travel is on its way to a full recovery by the end of 2024. Domestic travel is expected to grow 3 percent annually and reach 19 billion lodging nights per year by 2030. 1 Unless otherwise noted, the source for all data and projections is Oxford Economics. Over the same time frame, international travel should likewise ramp up to its historical average of nine billion nights. Spending on travel is expected to follow a similar trajectory, with an estimated $8.6 trillion in traveler outlays in 2024, representing roughly 9 percent of this year’s global GDP.
About the authors
This article is a collaborative effort by Caroline Tufft , Margaux Constantin , Matteo Pacca , and Ryan Mann , with Ivan Gladstone and Jasperina de Vries, representing views from McKinsey’s Travel, Logistics & Infrastructure Practice.
There’s no doubt people still love to travel and will continue to seek new experiences in new places. But where will travelers come from, and where will they go? We developed a snapshot of current traveler flows, along with estimates for growth through 2030. For the purposes of this report, we have divided the world into four regions—the Americas, Asia, Europe, and the Middle East and Africa.
Our analysis identifies three major themes for industry stakeholders to consider:
- The bulk of travel spending is close to home. Stakeholders should ensure they capture the full potential of domestic travel before shifting their focus to international travelers. And they should start with international travelers who visit nearby countries—as intraregional trips represent the largest travel segment after domestic trips.
- Source markets are shifting. Although established source markets continue to anchor global travel, Eastern Europe, India, and Southeast Asia are all becoming fast-growing sources of outbound tourism.
- The destinations of the future may not be the ones you imagine. Alongside enduring favorites, places that weren’t on many tourists’ maps are finding clever ways to lure international travelers and establish themselves as desirable destinations.
The bulk of travel spending is close to home
International travel might feel more glamorous, but tourism players should not forget that domestic travel still represents the bulk of the market, accounting for 75 percent of global travel spending (Exhibit 1). Domestic travel recovered from the COVID-19 pandemic faster than international travel, as is typical coming out of downturns. And although there has been a recent boom in “revenge travel,” with travelers prioritizing international trips that were delayed by the pandemic, a return to prepandemic norms, in which domestic travel represents 70 percent of spending, is expected by 2030.
The United States is the world’s largest domestic travel market at $1 trillion in annual spending. Sixty-eight percent of all trips that start in the United States remain within its borders. Domestic demand has softened slightly, as American travelers return abroad. 2 Dawit Habtemariam, “Domestic U.S. tourism growth levels off as Americans head overseas,” Skift, August 18, 2023. But tourism players with the right offerings are still thriving: five national parks broke attendance records in 2023 (including Joshua Tree National Park, which capitalized on growing interest from stargazers indulging in “dark sky” tourism 3 Scott McConkey, “5 national parks set attendance records in 2023, and the reasons may surprise you,” Wealth of Geeks, April 16, 2024. ).
China’s $744 billion domestic travel market is currently the world’s second largest. Chinese travelers spent the pandemic learning to appreciate the diversity of experiences on offer within their own country. Even as borders open back up, Chinese travelers are staying close to home. And domestic destinations are benefiting: for example, Changchun (home to the Changchun Ice and Snow Festival) realized 160 percent year-on-year growth in visitors in 2023. 4 Shi Xiaoji, “Why don’t Chinese people like to travel abroad anymore? The global tourism industry has lost 900 billion yuan. What is the situation?,” NetEase, February 12, 2024. In 2024, domestic travel during Lunar New Year exceeded prepandemic levels by 19 percent.
China’s domestic travel market is expected to grow 12 percent annually and overtake the United States’ to become the world’s largest by 2030. Hotel construction reflects this expectation: 30 percent of the global hotel construction pipeline is currently concentrated in China. The pipeline is heavily skewed toward luxury properties, with more than twice as many luxury hotels under construction in China as in the United States.
India, currently the world’s sixth-largest domestic travel market by spending, is another thriving area for domestic travel. With the subcontinent’s growing middle class powering travel spending growth of roughly 9 percent per year, India’s domestic market could overtake Japan’s and Mexico’s to become the world’s fourth largest by 2030. Domestic air passenger traffic in India is projected to double by 2030, 5 Murali Krishnan, “Can India’s airports cope with rapid passenger growth?,” Deutsche Welle, February 7, 2024. boosted in part by a state-subsidized initiative that aims to connect underserved domestic airports. 6 “India is seeing a massive aviation boom,” Economist , November 23, 2023.
When travelers do go abroad, they often stay close to home (Exhibit 2).
Europe and Asia, in particular, demonstrate strong and growing intraregional travel markets.
Recognizing this general trend, stakeholders have been funneling investment toward regional tourism destinations. An Emirati wealth fund, for instance, has announced its intent to invest roughly $35 billion into established hospitality properties and development opportunities in Egypt. 7 Michael Gunn and Mirette Magdy, “UAE’s $35 billion Egypt deal marks Gulf powers’ buying spree,” Bloomberg, April 27, 2024.
Europe has long played host to a high share of intraregional travel. Seventy percent of its travelers’ international trips stay within the region. Europe’s most popular destinations for intraregional travelers are perennial warm-weather favorites—Spain (18 percent), Italy (10 percent), and France (8 percent)—with limited change to these preferences expected between now and 2030.
Despite longer travel distances between Asian countries, Asia’s intraregional travel market is beginning to resemble Europe’s. Intraregional travel currently accounts for about 60 percent of international trips in Asia—a share expected to climb to 64 percent by 2030. As in Europe in past decades, Asian intraregional travel is benefiting from diminishing visa barriers and the development of a low-cost, regional flight network.
Thailand is projected to enjoy continued, growing popularity with Asian travelers. Thailand waived visa requirements for Chinese tourists in 2023 and plans to do the same for Indian tourists starting in 2024. It has aggressively targeted the fast-growing Indian traveler segment, launching more than 50 marketing campaigns directed at Indians over the past decade. The investment may be paying off: Bangkok recently overtook Dubai as the most popular city destination for Indian tourists. 8 “Bangkok overtakes Dubai as top destination for Indians post visa relaxation, reveals Agoda,” PR Newswire, January 18, 2024.
A McKinsey ConsumerWise survey on consumer sentiment, conducted in February 2024, suggests that Chinese travelers are also exhibiting high interest in international travel, with 36 percent of survey respondents indicating that they intend to spend more on international travel in the next three months. 9 Daniel Zipser, “ China brief: Consumers are spending again (outside of China) ,” McKinsey, April 8, 2024. Much of this interest is directed toward regional destinations such as Southeast Asia and Japan, with interest in travel to Europe down from previous years. 10 Guang Chen, Zi Chen, Steve Saxon, and Jackey Yu, “ Outlook for China tourism 2023: Light at the end of the tunnel ,” McKinsey, May 9, 2023.
Given travelers’ preference for proximity, how can tourism stakeholders further capitalize on domestic and intraregional travel demand? Here are a few strategies:
- Craft offerings that encourage domestic tourists to rediscover local gems. Destinations, hotels, and transportation providers can encourage domestic tourists to integrate lesser-known cultural landmarks into their trips to visit friends and relatives. In France, the upscale hotel chain Relais & Châteaux markets historic properties that lie far from classic tourist sights—such as Château Saint-Jean in rural Auvergne—as a welcome escape from the bustle of Paris. In Mexico, the Pueblos Mágicos program has successfully boosted domestic tourist visits to a set of “magical towns” that showcase Mexican heritage.
- Fold one-off domestic destinations into fuller itineraries. Route 66 in the United States is a classic road trip pathway, which spurs visits to attractions all along the highway’s length. Tourism stakeholders can collaborate to create similar types of domestic itineraries around the world. For instance, Mexico has expanded on its Pueblos Mágicos concept by branding coordinated visits to multiple villages as “magical routes.” In France, local tourism boards and vineyards have collaborated to promote bucket list “wine routes” around the country.
- Make crossing borders into neighboring countries seamless. Removing logistical barriers to travel can nudge tourists to upgrade a one-off trip to a single attraction into a bucket list journey across multiple, less-trodden destinations. In Africa, for example, Ethiopian Airlines is facilitating cross-border travel to major regional tourist sites through improved air connectivity. In Asia, Thailand has announced its intent to create a joint visa easing travel among Cambodia, Laos, Malaysia, Myanmar, Thailand, and Vietnam.
Source markets are shifting
The United States, Germany, the United Kingdom, China, and France remain the world’s five largest sources of travelers, in that order. These countries collectively accounted for 38 percent of international travel spending in 2023 and are expected to remain the top five source markets through 2030. But interest in travel is blossoming in other parts of the world—causing a shift in the balance of outbound travel flows (Exhibit 3).
North Americans’ travel spending is projected to hold steady at roughly 3 percent annual growth. US consumers voice growing concerns about inflation, and the most cost-constrained traveler segments are reducing travel, which is affecting ultra-low-cost airlines and budget hotels. Most travelers, however, plan to continue traveling: McKinsey research suggests that American consumers rank international and domestic travel as their highest-priority areas for discretionary spending. Instead of canceling their trips, these consumers are adapting their behavior by traveling during off-peak periods or booking travel further in advance. Travel spending by Europeans paints a slightly rosier picture, with roughly 5 percent projected annual growth. Meanwhile, the projected 12 percent annual growth in Chinese travelers’ spending should anchor substantial increases in travel spending across Northeast Asia.
Alongside these enduring traveler segments, new groups of travelers are emerging. Eastern Europe, India, and Southeast Asia are still comparatively small source markets, but they are developing fast-growing pools of first-time tourists (Exhibit 4).
India’s breakneck GDP growth of 6 percent year over year is bolstering a new generation of travelers, 11 Benjamin Laker, “India will grow to become the world’s third-largest economy by 2027,” Forbes , February 23, 2024. resulting in a projected annual growth in travel spending of 9 percent between now and 2030. Indian air carriers and lodging companies are making substantial investments to meet projected demand. Budget airline IndiGo placed the largest aircraft order in commercial aviation history in 2023, when it pledged to buy 500 Airbus A320 planes 12 Anna Cooban, “Biggest plane deal in history: Airbus clinches massive order from India’s IndiGo,” CNN, June 19, 2023. ; that same week, Air India nearly equaled IndiGo’s order size with purchase agreements for 250 Airbus and 220 Boeing jets. IndiGo later added an order for 30 additional Airbus A350 planes, well suited to serving both domestic and international routes. 13 “Airbus confirms IndiGo's A350 aircraft order,” Economic Times , May 6, 2024. The Indian Hotels Company Limited is ramping up its hotel pipeline, aiming to open two new hotels per month in the near future. International players are not sitting on the sidelines: seven hotel chains are launching new brands in India in 2024, 14 Peden Doma Bhutia, “Indian Hotels expansion plans: 2 new brands launching, 2 hotels opening every month,” Skift, February 2, 2024. including Marriott’s first Moxy- and Tribute-branded hotels in India and entrants from Hilton’s Curio and Tapestry brands. 15 Forum Gandhi, “Check-in frenzy: International hotel giants unleash fresh brands in India’s booming hospitality landscape,” Hindu Businessline , February 13, 2024. Development focus has shifted away from major metropolises such as Mumbai and Delhi and toward fast-developing, smaller cities such as Chandigarh and Hyderabad.
Southeast Asian travel spending is projected to grow at roughly 7 percent per year. Pockets of particularly high growth exist in Cambodia, Malaysia, and the Philippines. To capitalize on this blossoming source market, neighboring countries are rolling out attractive visa arrangements: for example, China has agreed to reciprocal visa waivers for short-term travelers from Malaysia, Singapore, and Thailand. 16 Julienna Law, “China launches ‘visa-free era’ with Southeast Asia. Will travel retail boom?,” Jing Daily , January 30, 2024.
Travel spending by Eastern Europeans is expected to grow at 7 percent per year until 2030—two percentage points higher than spending by Western Europeans. Areas of especially high growth include the Czech Republic, Hungary, and Poland, where middle-class travelers are increasingly venturing farther afield. Major tourism players, including the TUI Group, have tapped into these new source markets by offering charter flights to warm-weather destinations such as Egypt. 17 Hildbrandt von Klaus, “TUI develops Czech Republic as a new source market,” FVW, December 22, 2023.
Although the number of travelers from these new source markets is growing, their purchasing power remains relatively limited. Compared with Western European travelers (who average $159 per night in total travel spending), South Asians spend 20 percent less, Eastern Europeans spend 40 percent less, and Southeast Asians spend 55 percent less. Only 3 percent of the current Asian hotel construction pipeline caters to economy travelers, suggesting a potential supply gap of rooms that could appeal to budget-constrained tourists.
While acknowledging that historical source markets will continue to constitute the bulk of travel spending, tourism players can consider actions such as these to capitalize on growing travel demand from newer markets:
- Reduce obstacles to travel. Countries can look for ways to strategically invest in simplifying travel for visitors from growing source markets. In 2017, for example, Azerbaijan introduced express processing of electronic visas for Indian visitors; annual arrivals from India increased fivefold in two years. Requirements regarding passport photocopies or in-person check-ins can similarly be assessed with an eye toward reducing red tape for travelers.
- Use culturally relevant marketing channels to reach new demographics. Unique, thoughtful marketing strategies can help destinations place themselves on first-time travelers’ bucket lists. For example, after the release of Zindagi Na Milegi Dobara , a popular Bollywood movie shot in Spain with support from the Spanish Ministry of Tourism, Indian tourism to Spain increased by 65 percent. 18 “ Zindagi Na Milegi Dobara part of syllabus in Spain colleges,” India Today , June 6, 2004.
- Give new travelers the tech they expect. Travelers from newer source markets often have access to tech-forward travel offerings. For example, Indian travelers can travel anywhere within their country without physical identification, thanks to the Digi Yatra app. The Southeast Asian rideshare app Grab has several helpful travel features that competitors lack, such as automated menu translation and currency conversion. Tourism stakeholders should consider how to adapt to the tech expectations of newer travelers, integrating relevant offerings that ease journeys.
- Create vibrant experiences tailored to different price points. Crafting lower-budget offerings for more cost-constrained travelers doesn’t need to result in giving them a subpar experience. Capsule hotels, in which guests sleep in small cubbies, began as a response to the high cost of accommodations in Japan, but they have become an attraction in their own right—appearing on many must-do lists. 19 Philip Tang, “24 of the best experiences in Japan,” Lonely Planet, March 23, 2024.
The places you’ll go: The destinations of the future may not be the ones you imagine
The world’s top ten destination countries (the United States, Spain, China, France, Saudi Arabia, Türkiye, Italy, Thailand, Japan, and India, in that order) currently receive 45 percent of all travel spending, including for domestic travel. But some new locales are gaining traction (Exhibit 5).
A significant number of travelers are expanding their horizons, booking journeys to less visited countries that are near to old standbys. For instance, Laos and Malaysia, which both border Thailand—an established destination that is home to Bangkok, the world’s most visited city 20 Katherine LaGrave, “This is the world’s most visited city,” AFAR , January 31, 2024. —are up a respective 20 percent and 17 percent, respectively, in year-over-year international travel spending.
The world’s top ten destination countries currently receive 45 percent of all travel spending, including domestic-travel spending. But some new locales are gaining traction.
Several other countries that have crafted thoughtful tourism demand generation strategies—such as Peru, the Philippines, Rwanda, and Vietnam—are also expected to reap benefits in the coming years. Vietnam logged a remarkable 40 percent increase in tourism spending in the five years before the pandemic. Postpandemic, it has rebounded in part by waiving visa requirements for European travelers (while indicating intent to offer similar exemptions in the future for Chinese and Indian travelers). 21 Ashvita Singh, “Vietnam looks to offer visa-free entry to Indians: India report,” Skift, November 20, 2023. The Philippines has made a concerted effort to shift its sun-and-beach branding toward a more well-rounded image, replacing its long-standing “It’s more fun in the Philippines” tourism slogan with “Love the Philippines.” Peru is highlighting less visited archeological sites while also marketing itself as a top-notch culinary destination through the promotion of Peruvian restaurants abroad. Rwanda is investing in infrastructure to become a major African transit hub, facilitated by Qatar Airways’ purchase of a 60 percent stake in the country’s major airport. 22 Dylan Cresswell, “Rwanda plots ambitious tourism recovery,” African Business , July 28, 2022. Rwanda has also successfully capitalized on sustainable tourism: by charging $1,500 per gorilla trekking permit, for instance, it has maximized revenue while reducing environmental impact.
Tourism players might consider taking some of these actions to lure tourists to less familiar destinations:
- Collaborate across the tourism ecosystem. Promotion is not solely the domain of destination marketing organizations. Accommodation, transportation, and experience providers can also play important roles. In Singapore, for instance, the luxury resort Marina Bay Sands partners extensively with Singapore Airlines and the Singapore Tourism Board to offer compelling tourism offerings. Past collaborations have included flight and stay packages built around culinary festivals and a Lunar New Year drone show. 23 “Singapore Tourism Board, Marina Bay Sands & UOB partner to enliven Marina Bay precinct,” Singapore Tourism Board news release, January 25, 2024.
- Use infrastructure linkage to promote new destinations. By extending route options, transportation providers can encourage visitors to create itineraries that combine familiar destinations with new attractions. In Asia, Thailand’s tourism authority has attempted to nudge visitors away from the most heavily trafficked parts of the country, such as Bangkok and Phuket, and toward less popular destinations.
- Deploy social media to reach different demographics. Innovative social media campaigns can help put a destination on the map. Australia launched its “Ruby the kangaroo” campaign in China to coincide with the return of postpandemic air capacity between the two places. A video adapted for Chinese context (with appropriate gestures and a hashtag in Mandarin) garnered more than 20 million views in a single day on one of China’s largest social media platforms. 24 Nicole Gong, “Can Ruby the kangaroo bring Chinese tourists hopping back to Australia?,” SBS, June 5, 2023.
- Embrace unknown status. “Off the beaten path” messaging can appeal to widely traveled tourists seeking fresh experiences. Saudi Arabia’s “#WhereInTheWorld” campaign promoted the country’s tourist spots by acknowledging that they are less familiar to travelers, using a series of images that compared these spots with better-known destinations.
As tourism stakeholders look to the future, they can take steps to ensure that they continue to delight existing travelers while also embracing new ones. Domestic and intraregional tourism remain major opportunities—catering to local tourists’ preferences while building infrastructure that makes travel more seamless within a region could help capture them. Creative collaboration among tourism stakeholders can help put lesser-known destinations on the map. Travel tides are shifting. Expertly navigating these currents could yield rich rewards.
Caroline Tufft is a senior partner in McKinsey’s London office, Margaux Constantin is a partner in the Dubai office, Matteo Pacca is a senior partner in the Paris office, Ryan Mann is a partner in the Chicago office, Ivan Gladstone is an associate partner in the Riyadh office, and Jasperina de Vries is an associate partner in the Amsterdam office.
The authors wish to thank Abdulhadi Alghamdi, Alessandra Powell, Alex Dichter, Cedric Tsai, Diane Vu, Elisa Wallwitz, Lily Miller, Maggie Coffey, Nadya Snezhkova, Nick Meronyk, Paulina Baum, Peimin Suo, Rebecca Stone, Sarah Fellay, Sarah Sahel, Steffen Fuchs, Steffen Köpke, Steve Saxon, Sophia Wang, and Urs Binggeli for their contributions to this article.
This article was edited by Seth Stevenson, a senior editor in the New York office.
Explore a career with us
Related articles.

The future of tourism: Bridging the labor gap, enhancing customer experience

The promise of travel in the age of AI

From India to the world: Unleashing the potential of India’s tourists
UN Tourism | Bringing the world closer
Share this content.
- Share this article on facebook
- Share this article on twitter
- Share this article on linkedin
International tourism reached 97% of pre-pandemic levels in the first quarter of 2024
- All Regions
- 21 May 2024
International tourist arrivals reached 97% of pre-pandemic levels in the first quarter of 2024. According to UN Tourism, more than 285 million tourists travelled internationally in January-March, about 20% more than the first quarter of 2023, underscoring the sector’s near-complete recovery from the impacts of the pandemic.
In 2023 international tourist arrivals recovered 89% of 2019 levels and export revenues from tourism 96%, while direct tourism GDP reached the same levels as in 2019.
UN Tourism’s projection for 2024 points to a full recovery of international tourism with arrivals growing 2% above 2019 levels. In line with this, the newest data released by the UN specialized agency for tourism show that:
Yet it also recalls the need to ensure adequate tourism policies and destination management, aiming to advance sustainability and inclusion, while addressing the externalities and impact of the sector on resources and communities
- The Middle East saw the strongest relative growth, with international arrivals exceeding by 36% pre-pandemic levels in Q1 2024, or 4% above Q1 2023. This follows an extraordinary performance in 2023, when the Middle East became the first world region to recover pre-pandemic numbers (+22%).
- Europe , the world's largest destination region, exceeded pre-pandemic levels in a quarter for the first time (+1% from Q1 2019). The region recorded 120 million international tourists in the first three months of the year, backed by robust intra-regional demand.
- Africa welcomed 5% more arrivals in the first quarter of 2024 than in Q1 2019, and 13% more than in Q1 2023.
- The Americas practically recovered pre-pandemic numbers this first quarter, with arrivals reaching 99% of 2019 levels.
- International tourism is experiencing a rapid recovery in Asia and the Pacific where arrivals reached 82% of pre-pandemic levels in Q1 2024, after recovering 65% in the year 2023.
UN Tourism Secretary-General Zurab Pololikashvili said: "The recovery of the sector is very welcome news for our economies and the livelihoods of millions. Yet it also recalls the need to ensure adequate tourism policies and destination management, aiming to advance sustainability and inclusion, while addressing the externalities and impact of the sector on resources and communities".
By subregions, North Africa saw the strongest performance in Q1 2024 with 23% more international arrivals than before the pandemic, followed by Central America (+15%), the Caribbean and Western Europe (both +7%). Southern Mediterranean Europe exceeded pre-pandemic levels by 1%, while South America virtually reached 2019 levels. Northern Europe recovered 98% of pre-pandemic levels, while Subsaharan Africa and North America both recovered 95%.
According to available data, many destinations across the world continued to achieve strong results in Q1 2024, including Qatar (+177% versus Q1 2019), Albania (+121%), Saudi Arabia (+98%), El Salvador (+90%), Tanzania (+53%), Curaçao (+45%), Serbia (+43%), Turks and Caicos (+42%), Guatemala (+41%) and Bulgaria (+38%).
The robust performance of international tourism can also be seen in the UN Tourism Confidence Index which reached 130 points (on a scale of 0 to 200) for the period January-April, above the expectations (122) expressed for this period in mid-January.
International tourism receipts reached USD 1.5 trillion in 2023, meaning a complete recovery of pre-pandemic levels in nominal terms, but 97% in real terms, adjusting for inflation.
By regions, Europe generated the highest receipts in 2023, with destinations earning USD 660 billion, exceeding pre-pandemic levels by 7% in real terms. Receipts in the Middle East climbed 33% above 2019 levels. The Americas recovered 96% of its pre-pandemic earnings in 2023 and Africa 95%. Asia and the Pacific earned 78% of its pre-crisis receipts, a remarkable result when compared to its 65% recovery in arrivals last year.
Total export revenues from international tourism, including both receipts and passenger transport, reached USD 1.7 trillion in 2023, about 96% of pre-pandemic levels in real terms. Tourism direct GDP recovered pre-pandemic levels, reaching an estimated USD 3.3 trillion in 2023, equivalent to 3% of global GDP.
Several destinations achieved remarkable results in terms of receipts in the first quarter of 2024 as compared to 2019 levels based on available data, including Serbia (+127%), Türkiye (+82%), Pakistan (+72%), Tanzania (+62%), Portugal (+61%), Romania (+57%), Japan (+53%), Mongolia (+50%), Mauritius (+46%) and Morocco (+44%).
Looking ahead to a full recovery globally in 2024
International tourism is expected to recover completely in 2024 backed by strong demand, enhanced air connectivity and the continued recovery of China and other major Asian markets.
The latest UN Tourism Confidence Index shows positive prospects for the upcoming summer season, with a score of 130 for the period May-August 2024 (on a scale of 0 to 200), reflecting more upbeat sentiment than earlier this year. Some 62% of tourism experts participating in the Confidence survey expressed better (53%) or much better (9%) expectations for this 4-month period, covering the Northern Hemisphere summer season, while 31% foresee similar performance as in 2023.
Challenges remain
According to the UN Tourism Panel of Experts, economic and geopolitical headwinds continue to pose significant challenges to international tourism and confidence levels.
IMF's latest World Economic Outlook (April 2024) points to a steady but slow economic recovery, though mixed by region. At the same time, persisting inflation, high interest rates, volatile oil prices and disruptions to trade continue to translate into high transport and accommodations costs.
Tourists are expected to continue to seek value for money and travel closer to home in response to elevated prices and the overall economic challenges, while extreme temperatures and other weather events could impact the destination choice of many travellers. This is increasingly mentioned by the UN Tourism Panel of Experts as a concern for the sector.
Uncertainty derived from the Russian aggression against Ukraine, the Hamas-Israel conflict and other mounting geopolitical tensions, are also important downside risks for international tourism.
As international tourism continues to recover and expand, fuelling economic growth and employment around the world, governments will need to continue adapting and enhancing their management of tourism at the national and local level to ensure communities and residents are at the center of this development.
Related links
- Download News Release on PDF
- Excerpt | World Tourism Barometer - Volume 22 • Issue 2 • May 2024
Category tags
Related content, international tourism to reach pre-pandemic levels in 2024, international tourism to end 2023 close to 90% of pre-p..., tourism’s importance for growth highlighted in world ec..., international tourism swiftly overcoming pandemic downturn.
IMAGES
COMMENTS
Tourism Statistics. Get the latest and most up-to-date tourism statistics for all the countries and regions around the world. Data on inbound, domestic and outbound tourism is available, as well as on tourism industries, employment and complementary indicators. All statistical tables available are displayed and can be accessed individually ...
The UNWTO Statistics Department is committed to developing tourism measurement for furthering knowledge of the sector, monitoring progress, evaluating impact, promoting results-focused management, and highlighting strategic issues for policy objectives.. The department works towards advancing the methodological frameworks for measuring tourism and expanding its analytical potential, designs ...
International Tourism and COVID-19. Export revenues from international tourism dropped 62% in 2020 and 59% in 2021, versus 2019 (real terms) and then rebounded in 2022, remaining 34% below pre-pandemic levels. The total loss in export revenues from tourism amounts to USD 2.6 trillion for that three-year period. Go to Dashboard.
World Tourism Organization ( UNWTO ) Tel.: ( +34 ) 915 67 81 00 Calle del Poeta Joan Maragall, 42 Fax: ( +34 ) 915 71 37 33 28020 Madrid Website: www.unwto.org
International Tourism Highlights, 2020 Edition. Published: January 2021 Pages: 23. eISBN: 978-92-844-2245-6 | ISBN: 978-92-844-2244-9. Abstract: 2019 was another year of strong growth, though international arrivals grew below the exceptional rates seen in 2017 (+7%) and 2018 (+6%). Demand was somewhat weaker for travel to advanced economy ...
Opens Calls for Best Tourism Villages 2024. According to the first UNWTO World Tourism Barometer of the year, international tourism ended 2023 at 88% of pre-pandemic levels, with an estimated 1.3 billion international arrivals. The multi-dimensional nature of the tourism sector, combined with the dynamics of the source of investment capital ...
Report of the World Tourism Organization on tourism statistics : note / by the Secretary-General
International tourism maintains strong momentum with 84% recovery up to July 2023. Travel demand continued to show remarkable resilience and sustained recovery, amid economic and geopolitical challenges. An estimated 700 million tourists travelled internationally from January to July 2023, 43% higher than in 2022 although 16% less compared to 2019.
Read more on the UNWTO Tourism Barometer (May 2023 excerpt) here. The UNWTO World Tourism Barometer is a publication of the World Tourism Organization (UNWTO) that monitors short-term tourism trends on a regular basis to provide global tourism stakeholders with up-to-date analysis of international tourism. The information is updated several times a year and includes an analysis of the latest ...
As such, international tourism can generate a tourism trade surplus when receipts exceed expenditure, or a deficit (vice versa) in the travel balance of countries. In 2019, the United States of America had the world's largest travel surplus with USD 62 billion, resulting from tourism receipts of USD 214 billion and expenditure of USD 152 billion.
According to the first UNWTO World Tourism Barometer of the year, international tourism ended 2023 at 88% of pre-pandemic levels, with an estimated 1.3 billion international arrivals.The unleashing of remaining pent-up demand, increased air connectivity, and a stronger recovery of Asian markets and destinations, are expected to underpin a full recovery by the end of 2024 (UNWTO Tourism ...
The UN World Tourism Organization released encouraging news on Monday, with its latest World Tourism Barometer, which shows that international tourism arrivals almost tripled in the first seven months of 2022 (compared to the same period in 2021).Cautious optimism. The agency's Panel of Tourism Experts expressed cautious confidence for the rest of year, and into 2023, despite the uncertain ...
29 June 2021 Economic Development. The impact of the COVID-19 pandemic on tourism could result in a more than $4 trillion loss to the global economy, UN trade and development body UNCTAD said on Wednesday in a report issued jointly with the UN World Tourism Organization ( UNWTO ). The estimate is based on losses caused by the pandemic's ...
UN Tourism (UNWTO until 2023) is a specialized agency of the United Nations which promotes responsible, sustainable and universally-accessible tourism.Its headquarters are in Madrid, Spain.Other offices include: a Regional Support Office for Asia and the Pacific in Nara, Japan and a Regional Office for the Middle East in Riyadh, Saudi Arabia.. UN Tourism serves as a global forum for tourism ...
The Travel & Tourism Development Index (TTDI) 2024 is the second edition of an index that evolved from the Travel & Tourism Competitiveness Index (TTCI) series, a flagship index of the World Economic Forum that has been in production since 2007. Created in collaboration with the University of Surrey and with input from leading Travel & Tourism ...
According to new data from UNWTO, more than 900 million tourists traveled internationally in 2022 - double the number recorded in 2021.. Tourism recovery is foreseen to continue throughout 2023 even as the sector faces economic, health and geopolitical challenges. The recent lifting of COVID-19 related travel restrictions in China, the world's largest outbound market in 2019, is a ...
Source: World Tourism Organization (UNWTO) and World Trade Organization (WTO). Note: Ranking of export categories for 2018 will be available in late 2019. Tourism is the world's third largest export category after chemicals and fuels, and ahead of automotive products and food (2017) Chemicals 1,993 Fuels 1,960 International tourism 1,586
The UNWTO Tourism Data Dashboard - provides statistics and insights on key indicators for inbound and outbound tourism at the global, regional and national levels. Data covers tourist arrivals, tourism receipts, tourism share of exports and contribution to GDP, source markets, seasonality, domestic tourism and data on accommodation and employment.
In 2023, the Travel & Tourism sector contributed 9.1% to the global GDP; an increase of 23.2% from 2022 and only 4.1% below the 2019 level. In 2023, there were 27 million new jobs, representing a 9.1% increase compared to 2022, and only 1.4% below the 2019 level. Domestic visitor spending rose by 18.1% in 2023, surpassing the 2019 level.
The latest Annual One Planet network report to the High-Level Political Forum (HLPF) of the United Nations Economic and Social Council (ECOSOC) was released in April 2020 and it is based on the Sustainable Tourism Programme's Progress Report 2019.. The reports to the HLPF provide yearly updates on the collective progress made by the members of the six programmes in the One Planet network.
The Travel & Tourism Development Index (TTDI) 2024 is the second edition of an index that evolved from the Travel & Tourism Competitiveness Index (TTCI) series, a flagship index of the World Economic Forum that has been in production since 2007. The TTDI is part of the Forum's broader work with industry and government stakeholders to build a ...
1. UNWTO Tourism Highlights. 2018 Edition. 2. International Tourism Trends 2017. • Highest growth in international tourist arrivals in seven years since 2010. • Recovery of destinations suffering from security challenges in recent years. • Economic upswing resulting in strong outbound demand from major source markets.
First introduced in 2022, the Travel & Tourism Development Index (TTDI) benchmarks and measures the set of factors and policies that enable the sustainable and resilient development of the Travel & Tourism (T&T) sector, which in turn contributes to the development of a country. The index is a direct evolution of the Travel & Tourism Competitiveness Index (TTCI), which has been published ...
2022 has been the year to rethink tourism. Countries around the world turned UNWTO's vision for a greener, smarter and more inclusive sector into real action. 2020 showed the relevance of tourism for sustainable development. 2021 laid the foundations for the transformation of the sector. In 2022, we made it happen. 2022 began on a positive note.
International tourism up 4% in 2021 but still 72% below pre-pandemic levels Global tourism experienced a mild 4% upturn in 2021, with 15 million more international tourist arrivals (overnight visitors) than in 2020 but remained 72% below the levels of pre-pandemic year 2019 according to preliminary estimates. This follows a 73% plunge in international travel in 2020, the worst year on record ...
After falling by 75 percent in 2020, travel is on its way to a full recovery by the end of 2024. Domestic travel is expected to grow 3 percent annually and reach 19 billion lodging nights per year by 2030. 1 Over the same time frame, international travel should likewise ramp up to its historical average of nine billion nights.
January - March. As global tourism faced up to a second year of unprecedented crisis, UNWTO began 2021 by counting the cost so far.At the same time, however, the emergence of vaccines brought hope.The Global Tourism Crisis Committee met to explore what this meant for safe travel and the restart of tourism, while the announcement of the winners of the UNWTO Global Start-up Competition ...
21 May 2024. International tourist arrivals reached 97% of pre-pandemic levels in the first quarter of 2024. According to UN Tourism, more than 285 million tourists travelled internationally in January-March, about 20% more than the first quarter of 2023, underscoring the sector's near-complete recovery from the impacts of the pandemic. In ...