- Monthly unique regional population estimates (MURPEs)
- TECT data download
- Accommodation Survey (July 1996-September 2019)

International Visitor Survey data release materials
- IVS survey quality
- IVS analysis and research
- IVS methodology
- IVS questionnaire and brochures
- IVS classifications and definitions
- IVS data available from Stats NZ
- Background and revisions to the IVS
IVS data download
- Tourism and the economy
- International travel
- Tourism employment earnings and filled jobs
- Cruise data
- October 2020 Monthly Regional Tourism Estimates (MRTEs)
- Revisions and improvements
- Regional Tourism Estimates
- Regional Tourism Indicators (RTIs)
- Monthly Regional Tourism Estimates (MRTEs)
- Business Events Activity Survey (2009-2019)
- Business Events Delegate Survey (2009-2019)
- Methodology
- Data reliability
- Definitions and classifications
- Revised Domestic Travel Survey data series
On this page, we provide a link to the new data visualisations for the March 2024 quarter (Q1) and year ending March 2024. Summaries of previous releases are also provided.
On this page
2024 quarter 1 release.
Data visualisations for the year ending March 2024, the March quarter 2024, and for previous quarters, can be found on the Tourism Evidence and Insights Centre (TEIC). Commentary on high level results and a printable PDF containing top-line results are also available here.
International Visitor Survey (IVS) (external link) — TEIC
The June 2024 release contains the following charts for the year ending March 2024 (April 2023 to March 2024).
- Total spend
- Spend by product category e.g. accommodation, entertainment
- Length of stay
- Median total and daily spend per visitor
- Mean total and daily spend per visitor
- Māori cultural experiences
- Visitor satisfaction
- Accommodation use
New visualisations were added to the TEIC each quarter from September 2022. From December quarter 2023 results onward, there are no new quarter visualisations.
High-level results are published on the TEIC. Micro data can be found on the IVS data download page.
Visitor numbers and composition type are recovering to pre-pandemic levels. International visitor spend is now in line with visitor numbers. Visitor arrivals returned to 82% of pre-pandemic levels while overall visitor spend returned to 80% of pre-pandemic levels.
For year end March 2024, visitor numbers were 3.18 million compared with 3.87 million for year end March 2019. Flight capacity for year-end March 2024 was 88% of year-end March 2019 levels. Visitor numbers from some markets remained lower but are strongly growing to pre-pandemic levels. For example, Chinese visitors increased to 48% of pre-pandemic levels for year-end March 2024, up from 28% for year-end December 2023.
Proportionally, more visitors still come to New Zealand to visit family and friends. This proportion increased in recent years but is now returning to pre-pandemic levels (28% in March 2024 quarter compared to 25% in March 2019 quarter). These visitors traditionally spend less than visitors travelling for a holiday.
Historical data on the IVS data page
2020 and previous releases
International Visitor Survey (IVS) data is presented in the following user-friendly formats.
- Infographic : provides a visual summary of international visitor expenditure and arrival numbers by key markets.
- Key data table : provides a summary of international visitor expenditure by key markets and purpose of visit.
- Pivot tables : provide estimates of international visitor expenditure, and margins of error, by key overseas markets and purpose of visit for every year.
March 2020 data release
International visitor survey infographic year ending March 2020 [PDF, 1.4 MB]
International visitor survey key data year ending March 2020 [PDF, 198 KB]
International visitor survey pivot table March 2020 [XLSX, 206 KB]
December 2019 data release
International visitor survey infographic year ending December 2019 [PDF, 2.7 MB]
International visitor survey key data year ending December 2019 [PDF, 332 KB]
International visitor survey pivot table December 2019 [XLSX, 266 KB]
September 2019 data release
International visitor survey infographic year ending September 2019 [PDF, 553 KB]
International visitor survey key data year ending September 2019 [PDF, 194 KB]
International visitor survey pivot table September 2019 [XLSX, 207 KB]
Please exercise caution when using Chinese expenditure estimates this quarter.
For the September 2019 quarter, the sample size for visitors from China was smaller compared to previous quarters (97 respondents against our target of 275). The IVS data is collected through a voluntary survey that visitors are encouraged to complete. The quality of the data relies in getting an appropriate sample size for the segment we're measuring. We're working with our service provider to investigate the reasons for the low sample size, and how to ensure better response rates in the future.
The IVS data is presented as an annual figure that includes results from the last 4 quarters. For the September 2018 quarter, spend figures for Chinese visitors were lower than other quarters. Given that the lower-spend September 2018 quarter is no longer included in the annual result for the year ended September 2019, this has led to a corresponding rise in Chinese spend.
Earlier releases
Data summaries from earlier releases are grouped below by year and summary type.
June 2019 data release
International visitor survey infographic year ending June 2019 [PDF, 470 KB]
International visitor survey key data year ending June 2019 [PDF, 177 KB]
International visitor survey pivot table June 2019 [XLSX, 174 KB]
March 2019 data release
International visitor survey year ending March 2019 [PDF, 482 KB]
International visitor survey key data year ending March 2019 [PDF, 176 KB]
International visitor survey pivot table March 2019 [XLSX, 181 KB]
December 2018 data release
International visitor survey year ending December 2018 [PDF, 488 KB]
International visitor survey key data year ending December 2018 [PDF, 171 KB]
Pivot table December 2018 [XLSX, 234 KB]
September 2018 data release
International visitor survey year ending September 2018 [PDF, 540 KB]
International visitor survey key data year ending September 2018 [PDF, 188 KB]
Pivot table September 2018 [XLSX, 234 KB]
June 2018 data release
International visitor survey year ending June 2018 [PDF, 443 KB]
International visitor survey key data year ending June 2018 [PDF, 185 KB]
Pivot table June 2018 [XLSX, 175 KB]
March 2018 data release
International visitor survey year ending March 2018 [PDF, 506 KB]
International visitor survey key data year ending March 2018 [PDF, 181 KB]
Pivot table March 2018 [XLSX, 234 KB]
December 2017 data release
International visitor survey year ending December 2017 [PDF, 358 KB]
International visitor survey key data year ending December 2017 [PDF, 187 KB]
Pivot table December 2017 [XLSX, 230 KB]
September 2017 data release
International visitor survey year ending September 2017 [PDF, 477 KB]
International visitor survey key data year ending September 2017 [PDF, 171 KB]
Pivot table September 2017 [XLSX, 230 KB]
June 2017 data release
International visitor survey key data year ending June 2017 [PDF, 171 KB]
Pivot table June 2017 [XLSX, 230 KB]
International visitor survey year ending March 2017 [PDF, 174 KB]
Pivot table March 2017 [XLSX, 230 KB]
2016 key data tables
2016 pivot tables
IVS pivot table December 2016 [XLSX, 227 KB]
IVS pivot table September 2016 [XLSX, 233 KB]
IVS pivot table June 2016 [XLSX, 232 KB]
IVS pivot table March 2016 [XLSX, 233 KB]
2015 key data tables
2015 pivot tables.
IVS pivot table December 2015 [XLSX, 229 KB]
IVS pivot table September 2015 [XLSX, 229 KB]
IVS pivot table June 2015 [XLSX, 230 KB]
IVS pivot table March 2015 [XLSX, 234 KB]
2014 key data tables
2014 pivot tables.
IVS pivot table December 2014 [XLSX, 207 KB]
Crown copyright © 2024
https://www.mbie.govt.nz/immigration-and-tourism/tourism-research-and-data/tourism-data-releases/international-visitor-survey-ivs/international-visitor-survey-data-release-materials Please note: This content will change over time and can go out of date.
- Get datasets
- Catalogue guide
- Data toolkit
- Activity Stream
New Zealand Household Travel Survey
An ongoing survey of household travel in New Zealand
Data and Resources
- More information
- Go to resource
- public transport
- ministry of transport
Additional Info
View all Ministers
View all Portfolios
Travel survey goes digital
The NZ Household Travel Survey is going digital, meaning more data can be collected faster, Associate Transport Minister Craig Foss says.
“Moving the survey online makes it easier and more convenient for participants. It also means it can be expanded — surveying seven days’ travel instead of two,” Mr Foss says.
“The NZ Household Travel Survey, running since 1989, gives transport planners important information about when, where and how Kiwis travel. It will now be more accurate and more cost-effective.
“Delivering better online services is a key focus of the Government’s Better Public Services programme.”
The Ministry of Transport is using the move online to work more closely with regional councils, initially in Auckland, Wellington and Canterbury. The new survey method allows regional and local councils to buy extra surveying in their area to better understand local travel patterns and needs.
The Ministry will release a publication in late November summarising NZ Household Travel Survey results from the last 25 years.
More information about the survey is available at: www.transport.govt.nz/research/travelsurvey/

Data releases
International visitor survey (quarterly), 4 june 2024.
We advise caution when using and interpreting IVS quarterly-level results. Quarterly level statistics have a higher margin of error than annual level statistics. More information on data quality, including sample sizes, response rates, and margins of error can be found in the Survey quality for the International Visitor Survey page on MBIE's website.
The International Visitor Survey, produced by MBIE, measures the expenditure, characteristics and behaviours of international visitors to New Zealand. More information can be found on MBIE's website .
MBIE has worked with key stakeholders to revise parts of the questionnaire, with a greater focus on sustainability, new information needs due to COVID-19, and meeting new expenditure data requirements by Stats NZ. Stats NZ and MBIE have collaborated on a survey design that better accounts for ongoing changes to border policies and flight schedules as the New Zealand border reopens. MBIE will continue to monitor the current environment over the next few months to enable sample design updates and adjustments until overseas tourism stabilises.
Related views from the Sustainable Tourism Explorer:
Related resources from the tourism evidence and insights centre:.
SCAM ALERTS: We’ve seen an increase in scam texts and emails claiming to be from NZTA, asking for payments. Learn more about the latest phishing scams or report a phishing scam to us
Online services
- Renew vehicle licence (rego)
- Book, change or cancel a driving test
- Bought a vehicle
- Sold a vehicle
- Change your address
- Buy road user charges (RUC)
- Order replacement labels
- Report a phishing scam
- Access all online services
Household travel in our major urban areas
Published: February 2023 | Category: Guidance for specialists | Audience: General
This report analyses light vehicle use in our major urban areas .
WSP was commissioned by Waka Kotahi NZ Transport Agency to conduct analysis of the NZ Household Travel Survey data in determining light vehicle use in our Tier1 and Tier 2 Council areas and assess the possibility of mode shift, the suitability of mode substitution based on journey purpose and distance.
This work was to inform the scale of the Light-VKT reduction challenge for the New Zealand transport sector.
This strategic insight report is available for viewing.

Publication details
- Author: Waka Kotahi NZ Transport Agency
- Published: February 2023
- Version: Revision 2
Browse section/chapter
- Household travel in our major urban areas — 35 pages, 1.6 MB
How much does a trip to New Zealand cost? Annual survey reveals visitor spend

Sarah Pollok
Share this article
Tourists from Germany spend the most, on average, during trips around New Zealand, according to data from MBIE. Photo / 123rf
Visitors travelling from overseas to visit New Zealand have long made a significant contribution to the economy and so far 2024 is looking no different.
International tourism was the country’s second-highest export earner at the year-end of March 2024, and visitors spent $11.2 billion.
In the most recent quarter, January 1 to March 31, visitors spent $4.5 billion, a 34 per cent increase compared to the same period in 2023.
However, the nosier question some may have is, what visitors are spending the most?
To find out, we dive into the Government’s International Visitor Survey, which ranks New Zealand’s largest visitor markets; Australia, Asia, US, UK, Germany, Canada, rest of Europe and rest of world.
Total spend goes to Aussies
Visitors from Australia boasted the largest total cash spend during the year ending March 31, 2024, dropping $11.2b; an amout largely correlated to the massive number of Aussies who visited during the year.
Asia was in second place with $2.7b and the US was in third with $1.6b.
At the bottom of the list, Germany was the second lowest spending with a total of $463 million, and Canada spent the least ($240m).
However, when spend is broken down by the amount individual visitor typically spends, Germany shoots straight to the top of the list.
Germans spend the most
Each visitor from Germany typically spent $6373 during a holiday in New Zealand, equal to pre-pandemic levels.
The rest of Europe took second place ($4355) and Canada in third ($3469).
Yet, according to the Ministry of Business Innovation and Employment, higher media spend per visitor tends to correlate with how long they stay; the longer the trip, the higher the overall spend.
This checks out; German visitors stayed the longest of any visitor with a median stay length of 28.3 days. The rest of Europe follow behind (22.3 days) and the UK (19.5 days).
Australia had the shortest median stay, typically visiting for 7.5 days due to the short distance to New Zealand.
The median holiday length has dropped from 12 days in 2019 to 9.5 days, which MBIE claims has been driven by Asia visitors dropping their stay length.
Short stays spend big
While Germans prefer to stretch their money out over a month, other nationalities prefer to blow through a stack of cash in just a few days.
Visitors from Asia typically stay a little over 10 days but spend $294 each day of their visit, beaten only by the Americans who drop $349 per day.
Brits were the tightest, typically spending $177 per day, followed by the Germans who spent $196.
What visitors are the best value?
Money is one way to measure a tourist’s value (and a very easy measure at that) but it isn’t the only way. The ability to spend a lot of money doesn’t necessarily mean a tourist will treat our environment or people well, travel and spend money in lesser-known cities or respect our culture.
While some industry experts use ‘spend’ to dictate who Aotearoa should welcome or woo, current Minister for Tourism and Hospitality Matt Doocey appears to have a more inclusive perspective.
“Something you won’t hear from me is value-laden judgment statements about who is a deserving or undeserved tourist,” he said during a tourism conference in May .
“The beauty of tourism and hospitality in New Zealand is we have a range of different types of tourists who come to New Zealand.”
Latest from Travel
After a taste of retro-cool in australia head to this 80s style hotel, ‘i can’t fly without this’: cabin crew reveal how to stay flawless even after a long-haul flight, is disneyland really the happiest place on earth, have the holiday of your dreams with my queensland.

With sunset markets, ocean views and a blackjack table downstairs, why stay anywhere else?
Food on the global menu: Five tips for travelling in other countries with dietary requirements
Time to get away?
- Data by theme
- Popular queries
New Zealand Household Travel Survey: Regional results (3-year moving average)
- New Zealand Household Travel Survey: Travel to work, by main urban area results (3-year moving average)
- Detailed industry by region for geographic units- (ANZSIC06) 2000-13
- Employment size groups for geographic units (ANZSIC06) 2000-13
- Exports for Overseas Merchandise Trade (fob NZ$): Country of Destination by Commodity (HS2) and Period
- Key Labour Force Measures by Qualification, Age and Sex
- Area Unit Population Projections by Territorial Authorities, Age and Sex, 2006(base)-2031 update
- Imports for Overseas Merchandise Trade (cif NZ$): Country of Origin by Commodity (HS2) and Period
- Annual Recorded Offences for the latest Calendar Years (ANZSOC)
- Detailed industry for enterprises (ANZSIC06) 2000-13
- Annual Recorded Offences for the latest Fiscal Years (ANZSOC)
- Annual Apprehensions for the latest Fiscal Years (ANZSOC)
- Region [15 / 15]
- Years [9 / 9]
- Mode of travel [8 / 8]
- Measure [11 / 11]
- Table options
- Text file (CSV)
- Related files
Information
- About the indicators
- Air quality
- Alcohol-related harm
- Border health
- Climate change
- Hazardous substances
- Indoor environment
- Māori health
- Population vulnerability
- About transport and health
- Road traffic injury deaths and hospitalisations
- Household travel time by mode of transport
Main mode of transport to work
- Active transport to and from school
- Unmet need for GP services due to a lack of transport
- Motor vehicles
- Health burden of road transport
- View an interactive regional map and dashboard
- UV exposure
This section presents statistics on the main mode of transport that people used to travel to work.
Using active transport (such as walking and cycling) to get to work is a useful way to get some physical activity each day. With the high adult obesity rate in Aotearoa New Zealand, this is a relatively easy way to increase physical activity in adults.
Motorised forms of transport (such as cars, vans and motorcycles) also contribute to air pollution, noise pollution and greenhouse gases.
Surveillance Reports and Metadata
On this page:
Private motorised vehicles are the predominant method of commuting
In 2015–18, New Zealanders spent an average of 150.4 million hours travelling to work every year. Most of this time was spent as the driver of a private motor vehicle (73.5% of all commuting time), with an extra 6.4% spent as a passenger in such vehicles (Figure 1).
Around 9.2% of all commuting time was spent engaged in pedestrian travel and a further 6.5% of was spent on public transport. Commuting via bicycle represented 2.1% of all commuting time.
According to the 2013 census, four in five commuters (81.7%) used a car, truck or van as their main mode of transport to get to work on Census day (i.e. to travel the longest distance). Overall, 9.7% of commuters used active transport (walking, jogging or cycling). A further 5.7% of commuters used public transport (public bus or train).
Time spent commuting by all modes of transport stayed stable over time
From 2003–07 to 2010–14, the percentage of time spent commuting by active and public transport modes stayed fairly consistent (Figure 2). There was also little change in the use of private vehicles, which stayed around 85.6% (driver and passenger travel combined) throughout this period.
Women and 15–19-year-olds used more active and public transport
A fractionally larger percentage of women used active transport as their main mode of transport to work on Census day 2013 (9.8%) compared to men (9.6%). Use of public transport was also more prevalent among women (7.1%) than men (4.6%).
People aged 15–19 years had the highest use of active transport (19.6% of commuters) and public transport (11.0%) (Figure 3). Use of active and public transport declined quickly with age up to the age of 40. People aged 40+ years had the lowest use of active and public transport.
Time spent commuting by active and public transport varied between regions
In 2010–14, the Wellington region had the highest percentage of commuting time spent on public transport (14.4%). The Gisborne region had the highest percentage of time spent using active transport (16.5%). Wellington also had the highest percentage of overall commuting time spent on both active transport and public transport combined (23.9% of all travel time).
Regional councils with low percentages of commuting time using active transport and/or public transport included Northland, West Coast and Bay of Plenty regional councils, all of which had less than 5% of overall commuting time spent on active and public transport combined (Figure 4).
2018 Census data quality
Stats NZ has noted that the 2018 Census had a lower than expected response rate resulting in the introduction of new methods to produce the dataset, including using data from alternative sources. Stats NZ and the 2018 Census External Data Quality Panel (EDQP) have produced a rating system to help the users understand the quality-related issues and impacts of the 2018 Census dataset.
EHI have decided not to update the 'Main mode of transport to work on Census day' indicator and its associated Surveillance report based on the documentation relating to the 'main mode of transport to work' indicator. The EDQP rating for this indicator was “poor” and the response rate was 81%, with particularly high rates of data imputation for Māori and Pacific respondents. Additionally, the phrasing of the relevant census question was changed to a degree that prevents comparison between the 2018 Census and previous releases for this indicator. Further information about the Stats NZ and EDQP documentation can be found at https://www.stats.govt.nz/2018-census/data-quality-for-2018-census
In the interim, a supplementary report based on the New Zealand Household Travel Survey has been published to fill the gap between the 2013 and 2023 Censuses.
Information about the data
Main mode of transport to work on census day.
Source: New Zealand Census of Population and Dwellings (2001, 2006, 2013) – Statistics New Zealand
Definition: For this indicator, 'commuters' are defined as the employed usually resident population aged 15 years and over who travelled to work on Census day (therefore, this excludes people who did not work on Census day, or who worked from home).
Transport modes include walking, jogging, cycling, using a public bus or train, and using a private or commercial vehicle (car, truck or van). 'Main mode of travel' is defined as the transport mode used to travel the longest distance to their place of employment.
For more information, visit Statistics New Zealand's NZ.Stat website , and look under the 'Census' section.
Mode share of travel to work
Source : New Zealand Household Travel Survey - Ministry of Transport
Definition: This indicator presents the share of household travel time spent travelling to work, by mode of transport, from the New Zealand Household Travel Survey.
‘Motor vehicles’ includes driving or being a passenger in a car, van or motorbike, ‘active transport’ includes walking and cycling, and ‘public transport’ includes travel by bus, train or ferry. ‘Pedestrian’ includes travel by foot, or foot-propelled devices such as skateboards. ‘Other’ includes travel by aircraft, boat (other than ferries) and less conventional forms such as horse riding.
For more information, visit the Ministry of Transport's Transport Dashboard and look under the 'Household Travel' section.
Useful links
The Spinoff

OPINION Politics March 9, 2023
How a rogue survey over public transport funding reveals a stark generational divide.

- Share Story
A contested Ministry of Transport survey shows a major division between young renters and older homeowners on public transport – and how we should pay for it.
This is an edited version of a post first published on Bernard Hickey’s newsletter, The Kākā .
A survey ordered by the Ministry of Transport has found more than 80% of young people want a wealth tax, congestion charges and/or pollution pricing to pay for improvements in public transport, walking and cycling. This is a sharp change from the current system, which funds public transport only through fuel taxes.
However, the University of Auckland survey of over 400 people late last year also found less than a third of older respondents wanted a wealth tax – and barely a half wanted congestion charges, pollution pricing or increased contributions from developers.
The Ministry of Transport said it did not suggest the taxes to those surveyed and was not “at this stage” suggesting such measures. Transport minister Michael Wood batted the question back to the ministry yesterday when asked about the survey by Thomas Coughlan for the NZ Herald . However National party finance spokeswoman Nicola Willis suggested Labour was still eyeing up some sort of wealth tax.
Coughlan unearthed the survey under the OIA, with it assessing 436 people in October and November of last year. Conducted by the university’s Koi Tū: The Centre for Informed Futures using pol.is, it found a range of ideas on how to develop public transport and how to pay for it. The survey was of ‘stakeholder groups’ who understood the issues, which may have been skewed towards public transport users and advocates, the survey report writers said.
The engagement did not attempt to achieve representativeness in the participant sample; rather it focused on stakeholder groups, many of whom it believed would have knowledge of or interest in how the transport system is evolving. The vast majority of participants were between 26 and 64 years of age (fairly evenly spread between 26-39 and 40-64 year brackets), with a 60% male skew. With regard to transport modes, about a quarter of participants regularly used a bicycle, scooter or other personal transport mode, which is broadly in line with Waka Kotahi’s regular household travel survey . Walking was a regular transport mode for 19%.
While it is likely that most people use private vehicles to some extent, only 48% of respondents signalled that cars were their “main” mode of transport. This backs up the survey authors’ note around self-selection of the group surveyed, as the much larger household travel survey suggests cars remain by far the dominant transport mode at a national level. 82% of those surveyed live in suburban or urban areas of New Zealand, which is also more than the national average.
A total of 436 people voted on at least one of the 106 statements that were moderated into the Koi Tū survey . The survey grouped the respondents into three buckets. Group A were mostly younger respondents and much less likely to use cars. Group B sat in the middle, while group C were largely older respondents, two-thirds of which used cars to get around.
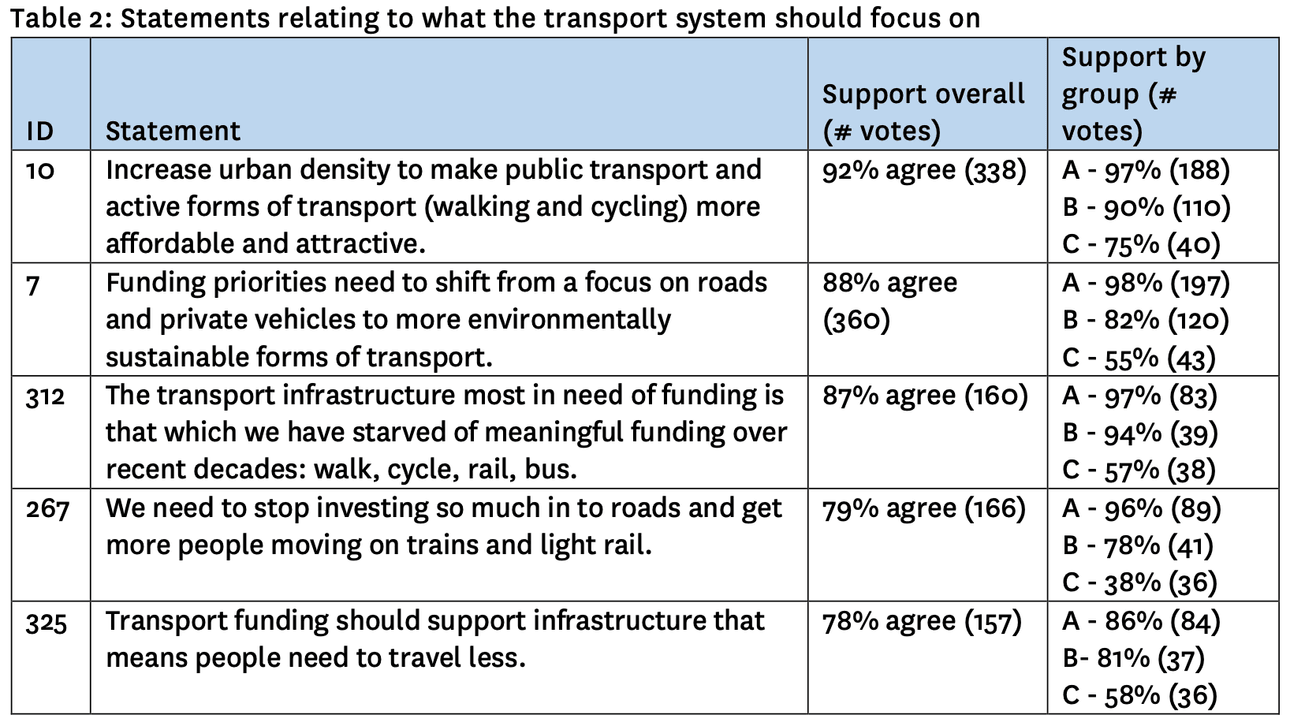
There was broad-based support for a statement of support for increased density, but other questions revealed a far more divided set of respondents. For example, the idea of “stopping investing so much into roads” in favour of rail was supported by 96% of group A, but just 38% of group C. And a wealth tax on “the ultra-rich” received the backing of 81% of group A, while less than a third of group C agreed with the idea.
Transport minister Michael Wood’s office was quoted in Thomas’ piece as referring questions back to the Ministry, while the Ministry said it had not suggested the wealth tax idea. Willis was quoted as saying even studying such options was wasteful. “How loosey-goosey have contracting arrangements got that public money is being used to poll people on a wealth tax that the government promised it wouldn’t be implementing?”
Is it a dodgy survey?
In my view, the survey results show the huge appetite for changing how public transport and mode shift is done which exists among young city-dwellers, while older home-owners in suburbs and provincial towns are just fine with the status quo. This survey was not a representative survey done in a non-self-selecting way online, so it can’t be said to represent the views of most voters, even in each age group.
But even the mere mention of these options was enough to light up the third rails of Aotearoa’s political economy around wealth taxes and repurposing roads and fuel taxes for mode shift and public transport. This is now a key culture war of our age.
For now, Ford Ranger Man is winning because the politicians of both National and Labour understand how to win MMP elections. They know there are more swinging median voters who own homes in suburbs and provincial towns than there are non-car-driving renters in the big cities. That won’t change until the electoral demographics change, which would require more than 500,000 non-voting young renters to vote, and for several hundred thousand older swinging voters to not vote.
Follow Bernard Hickey’s When the Facts Change on Apple Podcasts , Spotify or your favourite podcast app.
The Spinoff’s political coverage is powered by the generous support of our members . If you value what we do and believe in the importance of independent and freely accessible journalism – tautoko mai, donate today .
These are the best airlines in the world, according to a survey of travelers — see the full list
- Airline ratings company Skytrax has released its 2024 list of the best airlines in the world.
- Qatar Airways took the top spot from Singapore Airlines, 2023's winner.
- No airlines from the US made it in the top 20.
Qatar Airways has reclaimed the title of best airline in the world after losing out in 2023, according to travel industry rating company Skytrax.
Skytrax announced the results of the World Airline Awards, which polled travelers from over 100 countries on their impressions of more than 350 airlines, at a gala on Monday in London.
Once again, airlines from Asia and the Middle East dominated the awards, sweeping the top six spots and taking 12 of the top 20.
European carriers accounted for seven of the top 20 spots, with Turkish Airlines ranked highest in seventh.
No airlines from the US made the top 20 after Delta Air Lines fell one spot in this year's rankings to 21st. Delta was one of only two US airlines to crack the top 50, with United in 42nd.
Here's a closer look at the 20 best airlines in the world for 2024 according to Skytrax:
20. Saudia (Saudi Arabian Airlines)
Saudia , which changed its name from Saudi Arabian Airlines last year, jumped up three spots to finish 20th in this year's rankings.
Saudia is Saudi Arabia's flag carrier and is a member of the Sky Team alliance. It's also one of the few major airlines in the world the not serve any alcohol on board its flights.
19. Etihad Airways
Abu Dhabi's Etihad Airways fell six spots in this year's rankings but managed to stay in the top 20 at 19th.
Etihad reintroduced its Airbus A380 fleet and its luxurious The Residence suite after a four year hiatus.
18. Lufthansa
Lufthansa jumped three spots to 18 this year. The German national airline is a member of the Star Alliance and recently introduced its first new aircraft with the long-awaited Allegris cabin .
17. Virgin Atlantic Airways
Virgin Atlantic jumped up five spots to 17th in this year's rankings. The British carrier, co-owned by Sir Richard Branson's Virgin Group and Delta Air Lines, is celebrating the 40th anniversary of its founding this year.
16. Vistara
Vistara is ranked 16th for the second consecutive year and remains India's top airline. The carrier, founded in 2013 as a joint venture between Tata Group and Singapore Airlines, is in the process of merging with Air India .
Spain's Iberia fell one spot to 15th in this year's rankings. The Spanish national carrier is an Oneworld alliance member alongside its International Airlines Group sibling, British Airways.
14. Fiji Airways
Fiji Airways moved up one spot this year to 14th. Fiji Airways is now Oceania's only representative in the top 20 after Air New Zealand fell to 23rd this year.
13. British Airways
British Airways moved up five spots in the rankings to 13th place. BA is the highest-ranked of the International Airlines Group (IAG) carriers, which also include Iberia (15th), Aer Lingus (49th), and Vueling (56th).
British Airways also won this year's award for the world's most family friendly airline.
12. Hainan Airlines
Hainan Airlines dropped one spot to 12th this year. Hainan has consistently been China's highest-rated carrier and the only one of the country's four major airlines not owned by the Chinese central government.
11. Korean Air
Korean Air slipped one spot to 11th place this year. South Korea's largest airline is still awaiting final approval from the US government for its proposed merger with Asiana, which was announced in late 2020.
10. Swiss International Air Lines
Swiss International Airlines jumped two spots in the 2024 ranking to 10th place. Swiss, founded in 2002 following Swissair's bankruptcy, is the highest-ranking member of the Lufthansa Group, which includes Lufthansa (18th), Austrian (28th), and Eurowings (70th).
9. Air France
Air France slipped two spots to 9th place this year despite winning a host of awards, including the world's best first-class catering, best first-class lounge dining, and best airline in Western Europe.
Taiwanese carrier EVA Air moved up one spot to 8th this year. The carrier is a subsidiary of container shipping giant Evergreen Group.
7. Turkish Airlines
In seventh place is Turkish Airlines . It's once again Europe's highest-ranked airline.
6. Japan Airlines
Japan Airlines dropped one spot to sixth this year. The Japanese flag carrier also won this year's award for the world's best premium economy cabin.
5. Cathay Pacific Airways
Hong Kong's Cathay Pacific moved into the top five this year, up from eighth position in 2023. Cathay also took home the prize for this year's best economy-class cabin.
4. All Nippon Airways (ANA)
All Nippon Airways or ANA fell one spot to fourth place this year. Despite that, the Japanese carrier managed to snag awards for the world's best airport services and the best airline staff service in Asia.
3. Emirates
Dubai's Emirates Airline moves into the top 3 this year after spending 2023 in fourth position. Emirates remains the world's largest operator of the A380 Superjumbo, with more than 100 in its fleet.
2. Singapore Airlines
After spending 2023 as the world's best airline, Singapore Airlines is back in second place, a position it also held in 2022 and 2021. Second place is nothing to scoff at. The airline also picked up honors for the world's best cabin staff and the world's best first-class cabin.
1. Qatar Airways
Qatar Airways takes the No. 1 spot again after falling second behind Singapore Airlines last year. It's a familiar position for the airline, which also claimed top honors in 2022, 2021, and 2019.
This year, Qatar Airways also won awards for the best business class cabin and lounge.
- Main content
IMAGES
COMMENTS
The New Zealand Travel Survey provided data to help develop policy and evaluate programmes relating to road use and safety. It was a one-off survey using similar methodology to the 1989/90 Household Travel Survey. Approximately, 14,000 people were interviewed from 7,000 randomly selected households over between June 1997 and July 1998, and ...
The New Zealand Household Travel Survey is an ongoing survey of household travel conducted for the Ministry of Transport. From 2018 onwards, each year people in over 2,000 households throughout New Zealand are invited to participate in the survey, by recording all their travel over a 2-day period. Each person in the household was asked about ...
The New Zealand Household Travel Survey measures the travel New Zealanders do by asking everyone in randomly selected households to record their travel over 2 days. The survey is conducted by Ipsos, (formerly CBG Research). Participants should contact Ipsos if they have any question about the survey. Telephone: 0800 478 783. Ipsos.
The New Zealand Household Travel Survey (HTS) is run by the Ministry of Transport. Ministry of Transport New Zealand Household Travel Survey (external link) Information for participants. Ministry of Transport's Household Travel Survey is a continuous ongoing survey, it has been running for over 20 years. Households are randomly selected ...
As a substitute, from April until August 2020, we ran a panel survey (C19TS) of previous NZHTS participants. Transport Knowledge Hub Webinar series 2020 - Forecasting Household travel in NZ under COVID 19. We surveyed 1,275 unique participants and completed 4,177 interviews across the alert levels. First C19TS interviews Sat 25 April.
International Visitor Survey (IVS) — TEIC. The June 2024 release contains the following charts for the year ending March 2024 (April 2023 to March 2024). New visualisations were added to the TEIC each quarter from September 2022. From December quarter 2023 results onward, there are no new quarter visualisations.
Attitudes from people in the New Zealand Household Travel Survey TKC2019 2017 2018 28% 33% 3% 1% Transport sharing survey November 2017, 639 people responded. Survey November 2018, 638 people responded. Results refer to use of app based ride hailing eg Uber, Zoomy, Ola and bike sharing schemes.
New Zealand Household Travel Survey - Dataset - data.govt.nz - discover and use data. Organisations. Ministry of Transport. New Zealand Household Travel Survey. Dataset. Groups.
New Zealand Household Travel Survey An ongoing survey of household travel in New Zealand. Data and Resources. New Zealand Household Travel Survey HTML. Explore More information Go to resource Main urban areas spreadsheet 2003-14 XLSX. Explore Preview Download ...
National travel survey 1989/90, 1997/98 and 2003-2014 Face to face recruitment, 2 day travel diary, personal interview 2015-2018 Face to face recruitment, 7 day online travel diary, with option of GPS memory prompt Maintaining core data requirements How, when, where and why people travel: Lessons learned from the NZHTS -7 day online GPS
The NZ Household Travel Survey is going digital, meaning more data can be collected faster, Associate Transport Minister Craig Foss says. "Moving the survey online makes it easier and more convenient for participants. It also means it can be expanded — surveying seven days' travel instead of two," Mr Foss says. "The NZ Household Travel Survey, running since 1989, gives transport ...
New Zealand Household Travel Survey: Regional results (3-year moving average) New Zealand Household Travel Survey: Travel to work, by main urban area results (3-year moving average) Most visited. Detailed industry by region for geographic units- (ANZSIC06) 2000-13;
The New Zealand Household Travel Survey is an ongoing survey of household travel conducted for the Ministry of Transport. Each year, people in . 4,600. 2 households throughout New Zealand are invited to participate in the survey by recording all their travel over a two-day period. Each person in the household is then interviewed about their travel.
The New Zealand Household Travel Survey (HHTS) shows that of the estimated 6000 million plus trips made by New Zealand households annually, nearly one in five (17 percent) was made by walking. [1] New Zealanders spend 205 million hours annually as pedestrians in the road environment and walk an estimated 807 million kilometres per year.
New Zealand Household Travel Survey The survey collects information about day-to-day household travel in New Zealand - such as, how, where and when we travel. The results provide a picture of the travel patterns and choices of all types of people - information which is vital for developing transport policy including road safety, public ...
The International Visitor Survey, produced by MBIE, measures the expenditure, characteristics and behaviours of international visitors to New Zealand. More information can be found on MBIE's website. MBIE has worked with key stakeholders to revise parts of the questionnaire, with a greater focus on sustainability, new information needs due to ...
WSP was commissioned by Waka Kotahi NZ Transport Agency to conduct analysis of the NZ Household Travel Survey data in determining light vehicle use in our Tier1 and Tier 2 Council areas and assess the possibility of mode shift, the suitability of mode substitution based on journey purpose and distance. This work was to inform the scale of the ...
Each visitor from Germany typically spent $6373 during a holiday in New Zealand, equal to pre-pandemic levels. The rest of Europe took second place ($4355) and Canada in third ($3469).
New Zealand Household Travel Survey: Regional results (3-year moving average) Customise. Export. Region. New Zealand Northland Auckland Waikato Bay of Plenty Gisborne Hawkes Bay Taranaki Manawatu/Wanganui Wellington Nelson/Marlborough/Tasman West Coast Canterbury Otago Southland. Years.
In the interim, a supplementary report based on the New Zealand Household Travel Survey has been published to fill the gap between the 2013 and 2023 Censuses. Information about the data Main mode of transport to work on Census day. Source: New Zealand Census of Population and Dwellings (2001, 2006, 2013) - Statistics New Zealand
Enquires relating to the New Zealand Household Travel Survey may be directed to the Ministry of Transport, PO Box 3175, Wellington, or by email to [email protected] or [email protected] . 3 New Zealand Household Travel Survey Questionnaire 2019-20 Household Questionnaire
A survey ordered by the Ministry of Transport has found more than 80% of young people want a wealth tax, congestion charges and/or pollution pricing to pay for improvements in public transport ...
Survey Helpline: 0800 478 783. Sign In. User Name:
Airline ratings company Skytrax has released its 2024 list of the best airlines in the world. Qatar Airways took the top spot from Singapore Airlines, 2023's winner. No airlines from the US made ...