National Geographic content straight to your inbox—sign up for our popular newsletters here


Inside the Controversial World of Slum Tourism
People have toured the world’s most marginalized, impoverished districts for over a century.
Hundreds of shanty towns line the riverbanks, train tracks, and garbage dumps in the Filipino capital—the most jammed-packed areas in one of the world’s most densely populated cities. Around a quarter of its 12 million people are considered “informal settlers.”
Manila is starkly representative of a global problem. According to the United Nations , about a quarter of the world’s urban population lives in slums—and this figure is rising fast.
Rich cultural heritage brings visitors to Manila, but some feel compelled to leave the safety of the historic center sites to get a glimpse of the city’s inequality. Tour operators in the Philippines —as well as places like Brazil and India —have responded by offering “slum tours” that take outsiders through their most impoverished, marginalized districts.
Slum tourism sparks considerable debate around an uncomfortable moral dilemma. No matter what you call it—slum tours, reality tours, adventure tourism, poverty tourism—many consider the practice little more than slack-jawed privileged people gawking at those less fortunate. Others argue they raise awareness and provide numerous examples of giving back to the local communities. Should tourists simply keep their eyes shut?

Around a quarter of Manila's 12 million people are considered “informal settlers."

Rich cultural heritage brings visitors to Manila, but some feel compelled to leave the safety of the historic center sites to get a glimpse of the city’s inequality.
Slumming For Centuries
Slum tourism is not a new phenomenon, although much has changed since its beginning. “Slumming” was added to the Oxford English Dictionary in the 1860s, meaning “to go into, or frequent, slums for discreditable purposes; to saunter about, with a suspicion, perhaps, of immoral pursuits.” In September 1884, the New York Times published an article about the latest trend in leisure activities that arrived from across the pond, “‘Slumming’ will become a form of fashionable dissipation this winter among our Belles, as our foreign cousins will always be ready to lead the way.”
Usually under the pretense of charity and sometimes with a police escort, rich Londoners began braving the city’s ill-reputed East End beginning around 1840. This new form of amusement arrived to New York City from wealthy British tourists eager to compare slums abroad to those back home. Spreading across the coast to San Francisco, the practice creeped into city guide books. Groups wandered through neighborhoods like the Bowery or Five Points in New York to peer into brothels, saloons, and opium dens.
Visitors could hardly believe their eyes, and justifiably so. “I don’t think an opium den would have welcomed, or allowed access to, slummers to come through if they weren’t there to smoke themselves,” Chad Heap writes in his book Slumming: Sexual and Racial Encounters in American Nightlife , 1885–1940 . Recognizing the business opportunity, outsiders cashed in on the curiosity by hiring actors to play the part of addicts or gang members to stage shoot-’em-ups in the streets. After all, no one wanted the slum tourists to demand a refund or go home disappointed.

Smokey Tours does not allow participants to take photos, but this policy proves difficult to enforce.

The city of San Francisco eventually banned such mockery of the poor, the New York Times reported in 1909: “This is a heavy blow to Chinatown guides, who have collected a fee of two dollars each. The opium smokers, gamblers, blind paupers, singing children, and other curiosities were all hired.”
Tours also brought positive results, as Professor of History Seth Koven highlights in his research of slumming in Victorian London. Oxford and Cambridge Universities opened study centers in the late 19th-century to inform social policy, which was only possible by seeing the underprivileged neighborhoods firsthand.
Popularity waned after World War II with the creation of welfare and social housing—then rose again in the 1980s and 1990s as those state provisions declined and labor demands increased.
Presenting Poverty
Plastic arrives from all over India to the dark alleys and corrugated shacks of Dharavi in Mumbai —the second-largest slum on the continent of Asia (after Orangi Town in Pakistan ) and third-largest slum in the world. Ushered around by the company Reality Tour and Travel , tourists see a thriving recycling industry which employs around ten thousand to melt, reshape, and mould discarded plastic. They stop to watch the dhobiwallahs , or washermen, scrub sheets from the city’s hospitals and hotels in an open-air laundry area.
In a TripAdvisor review, one recent participant from Virginia appreciated the focus on community. “It was great to hear about the economy, education and livelihood of the residents,” she writes. “The tour group doesn't allow photography or shopping which I think is really important. It didn't feel exploitative, it felt educational.”
One traveler from London commented on the extremity of the scene. "Had to stop after about 20 minutes into it due to the overbearing nature of the surroundings. The tour is not for the faint hearted. I would've liked a few more disclaimers on the website to warn us about the nature of it." Another guest from the United Kingdom expressed disappointment over the so-called family meal. “This was in the home of one of the guides and, whilst his mum made lunch a delicious meal that we ate in her house, she didn’t eat with us so it wasn’t really what I had expected from a family lunch (or the photos promoting such on the website).”

Smokey Tours enters the Manila North Cemetery, inhabited by some of Manila's poorest people.

Children jump from grave to grave in the city’s largest cemetery.
Reality Tours hopes to challenge the stereotypical perception of slums as despairing places inhabited by hopeless people. The tour presented slum residents as productive and hardworking, but also content and happy. Analyzing more than 230 reviews of Reality Tour and Travel in her study , Dr. Melissa Nisbett of King’s College London realized that for many Dharavi visitors, poverty was practically invisible. “As the reviews show, poverty was ignored, denied, overlooked and romanticized, but moreover, it was depoliticized.” Without discussing the reason the slum existed, the tour decontextualized the plight of the poor and seemed only to empower the wrong people–the privileged, western, middle class visitors.
With good intentions, the company states that 80 percent of the profits benefit the community through the efforts of its NGO that works to provide access to healthcare, organize educational programs, and more. Co-founder Chris Way spoke to National Geographic after his company surged in popularity from the sleeper hit Slumdog Millionaire . “We do try and be as transparent as possible on our website, which does allay many people’s fears.” Way personally refuses a salary for his work.
No Two Cities Alike
The main question should be: Is poverty the central reason to visit?
Other cities take different approaches to slum tourism. In the early 1990s, when black South Africans began offering tours of their townships—the marginalized, racially-segregated areas where they were forced to live—to help raise global awareness of rampant human rights violations. Rather than exploitation inflicted by outsiders, local communities embraced slum tourism as a vehicle to take matters of their traditionally neglected neighborhoods into their own hands.
- Nat Geo Expeditions
Some free tours of favelas in Rio de Janeiro provided an accessible option to the crowds that infiltrated the city during the World Cup and Summer Olympics, while most companies continue to charge. Tour manager Eduardo Marques of Brazilian Expeditions explains how their authenticity stands out, “We work with some local guides or freelancers, and during the tour we stop in local small business plus [offer] capoeira presentations that [support] the locals in the favela. We do not hide any info from our visitors. The real life is presented to the visitors.”
Smokey Tours in Manila connected tourists with the reality facing inhabitants of a city landfill in Tondo (until 2014 when it closed) to tell their stories. Now the company tours around Baseco near the port, located in the same crowded district and known for its grassroots activism. Locally-based photographer Hannah Reyes Morales documented her experience walking with the group on assignment for National Geographic Travel. “I had permission to photograph this tour from both the operator and community officials, but the tour itself had a no photography policy for the tourists.” With the policy difficult to enforce, some guests secretly snapped photos on their phones. “I observed how differently tourists processed what they were seeing in the tour. There were those who were respectful of their surroundings, and those who were less so.”
All About Intention
Despite sincere attempts by tour operators to mitigate offense and give back to locals, the impact of slum tourism stays isolated. Ghettoized communities remain woven into the fabric of major cities around the world, each with their individual political, historical, and economic concerns that cannot be generalized. Similarly, the motivations behind the tourism inside them are as diverse as the tour participants themselves. For all participants involved, operators or guests, individual intentions matter most.

The Baseco neighborhood is located on the Pasig river near the city port, but lacks access to clean drinking water.
Better connections between cities allow more people to travel than ever before, with numbers of international tourists growing quickly every year. While prosperity and quality of life have increased in many cities, so has inequality. As travelers increasingly seek unique experiences that promise authentic experiences in previously off-limits places, access through tours helps put some areas on the map.
Travel connects people that would otherwise not meet, then provides potential to share meaningful stories with others back home. Dr. Fabian Frenzel, who studies tourism of urban poverty at the University of Leicester, points out that one of the key disadvantages of poverty is a lack of recognition and voice. “If you want to tell a story, you need an audience, and tourism provides that audience.” Frenzel argues that even taking the most commodifying tour is better than ignoring that inequality completely.
For the long-term future of these communities, the complex economic, legal, and political issues must be addressed holistically by reorganizing the distribution of resources. While illuminating the issue on a small scale, slum tourism is not a sufficient answer to a growing global problem.
Related Topics
- TRAVEL PHOTOGRAPHY
- PHOTOGRAPHY
You May Also Like

Photo story: wild beauty in eastern Sardinia, from coast to mountains

How I got the shot: Richard James Taylor on capturing Mekong sunset magic in Laos
For hungry minds.

How I got the shot: Dikpal Thapa on risking it all for one image

How to visit Grand Teton National Park

These are the best travel photos of 2022

How I got the shot: Richard James Taylor on capturing Dubrovnik's golden hour

The Masterclasses 2023: 10 practical tips to help you succeed as a travel photographer
- Paid Content
- Environment
- Photography
- Perpetual Planet
History & Culture
- History & Culture
- History Magazine
- Mind, Body, Wonder
- Terms of Use
- Privacy Policy
- Your US State Privacy Rights
- Children's Online Privacy Policy
- Interest-Based Ads
- About Nielsen Measurement
- Do Not Sell or Share My Personal Information
- Nat Geo Home
- Attend a Live Event
- Book a Trip
- Inspire Your Kids
- Shop Nat Geo
- Visit the D.C. Museum
- Learn About Our Impact
- Support Our Mission
- Advertise With Us
- Customer Service
- Renew Subscription
- Manage Your Subscription
- Work at Nat Geo
- Sign Up for Our Newsletters
- Contribute to Protect the Planet
Copyright © 1996-2015 National Geographic Society Copyright © 2015-2024 National Geographic Partners, LLC. All rights reserved
Advertisement
The relationship between tourism development and multidimensional poverty reduction: A decoupling analysis
- Published: 09 September 2021
- Volume 56 , pages 2501–2518, ( 2022 )
Cite this article

- Xia Wang ORCID: orcid.org/0000-0002-6111-2298 1 &
- Peiru Cai 1
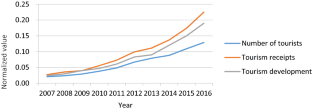
Despite the importance of tourism for poverty relief, limited studies have investigated the relationship between tourism development and multidimensional poverty reduction. The present work investigated the tourism–poverty nexus from the perspective of multidimensional poverty (including poverty related to economic, education, health care and social welfare dimensions) on the basis of a decoupling analysis in 74 national poverty-stricken counties of Southwest China over the period of 2007–2016. The results reveal the following regularities. First, a positive synchronisation relationship exists between tourism development and multidimensional poverty reduction. Second, the relationship between tourism development and multidimensional poverty reduction is unstable, and the poverty reduction effects of tourism have been shrinking over the past decade. Third, with the development of tourism, the poverty reduction in economic, health care and the social welfare dimensions have made achievements in general, whereas the poverty reduction of education demonstrated an opposite trend. The outcomes and implications of this study provide essential insights to the tourism–poverty nexus debate and offer directions for policies to alleviate poverty through tourism development.
This is a preview of subscription content, log in via an institution to check access.
Access this article
Price includes VAT (Russian Federation)
Instant access to the full article PDF.
Rent this article via DeepDyve
Institutional subscriptions
The Effect of Tourism Growth on Local Economic Development: A Conceptual Review of Vietnam Concept

Sustainable Tourism and Poverty Reduction in Selected ASEAN Member Countries
Developing the tourism sector for poverty reduction and inclusive sustainable growth in thailand.
Alkire, S., Fang, Y.: Dynamics of multidimensional poverty and uni-dimensional income poverty: An evidence of stability analysis from China. Soc. Indic. Res. 142 (1), 25–64 (2019)
Article Google Scholar
Alkire, S., Foster, J.: Counting and multidimensional poverty measurement. J. Public Econ. 95 (7), 476–487 (2011)
Alkire, S., Santos, M.E.: Measuring acute poverty in the developing world: Robustness and scope of the multidimensional poverty index. World Dev. 59 , 251–274 (2014)
Alkire, S., Roche, J.M., Vaz, A.: Changes over time in multidimensional poverty: Methodology and results for 34 countries. World Dev. 94 , 232–249 (2017)
Anderson, W.: Cultural tourism and poverty alleviation in rural Kilimanjaro. Tanzania. J. Tour. Cult. Chang. 13 (3), 208–224 (2015)
Antonakakis, N., Dragouni, M., Eeckels, B., Filis, G.: The tourism and economic growth enigma: Examining an ambiguous relationship through multiple prisms. J. Travel Res. 58 (1), 3–24 (2019)
Ashley, C., Roe, D., Goodwin, H.: Pro-poor tourism strategies: Making tourism work for the poor: A review of experience (No. 1). London: Overseas Development Institute (2001)
Ashley, C., Roe, D.: Making tourism work for the poor: Strategies and challenges in southern Africa. Dev. South. Afr. 19 (1), 61–82 (2002)
Battiston, D., Cruces, G., Lopez-Calva, L.F., Lugo, M.A., Santos, M.E.: Income and beyond: Multidimensional poverty in six Latin American countries. Soc. Indic. Res. 112 (2), 291–314 (2013)
Blake, A.: Tourism and income distribution in East Africa. Int. J. Tour. Res. 10 (6), 511–524 (2008)
Bowden, J.: Pro-poor tourism and the Chinese experience. Asia Pac. J. Tour. Res. 10 (4), 379–398 (2005)
Carter, A.P.: The economics of technological change. Sci. Am. 214 (4), 25–31 (1966)
Chen, J., Wang, Y., Wen, J., Fang, F., Song, M.: The influences of aging population and economic growth on Chinese rural poverty. J. Rural Stud. 47 , 665–676 (2016)
Climent, F., Pardo, A.: Decoupling factors on the energy-output linkage: The Spanish case. Energy Policy 35 , 522–528 (2007)
Comerio, N., Strozzi, F.: Tourism and its economic impact: A literature review using bibliometric tools. Tour. Econ. 25 (1), 109–131 (2019)
Croes, R.: The role of tourism in poverty reduction: An empirical assessment. Tour. Econ. 20 (2), 207–226 (2014)
Croes, R., Rivera, M.A.: Tourism’s potential to benefit the poor: A social accounting matrix model applied to Ecuador. Tour. Econ. 23 (1), 29–48 (2017)
Croes, R., Vanegas, M.: Cointegration and causality between tourism and poverty reduction. J. Travel Res. 47 (1), 94–103 (2008)
Deller, S.: Rural poverty, tourism and spatial heterogeneity. Ann. Touris. Res. 37 (1), 180–205 (2010)
Ding, J.: Comparative analysis on poverty degree of China’s 11 contiguous destitute areas: With view of comprehensive development index. Sci. Geogr. Sinica. 34 (12), 1414–1427 (2014)
Google Scholar
Ferraro, P.J., Hanauer, M.M.: Quantifying causal mechanisms to determine how protected areas affect poverty through changes in ecosystem services and infrastructure. Proc. Natl. Acad. Sci. u. s. a. 111 (11), 4332–4337 (2014)
Folarin, O., Adeniyi, O.: Does tourism reduce poverty in Sub-Saharan African countries? J. Travel Res. 59 (1), 140–155 (2020)
Fowowe, B., Shuaibu, M.I.: Is foreign direct investment good for the poor? New evidence from African countries. Econ. Chang. Restruct. 47 (4), 321–339 (2014)
Freitas, L.C., Kaneko, S.: Decomposing the decoupling of CO 2 emissions and economic growth in Brazil. Ecol. Econ. 70 , 1459–1469 (2011)
Gartner, C., Cukier, J.: Is tourism employment a sufficient mechanism for poverty reduction? A case study from Nkhata Bay. Malawi. Curr. Issues Tour. 15 (6), 545–562 (2012)
Gough, I., McGregor, J.A.: Wellbeing in developing countries: From theory to research. Cambridge University Press (2007)
Guiasu, S.: Weighted entropy. Rep. Math. Phys. 2 (3), 165–179 (1971)
Holden, A., Sonne, J., Novelli, M.: Tourism and poverty reduction: An interpretation by the poor of Elmina. Ghana. Tour. Plann. Develo. 8 (3), 317–334 (2011)
International Trade Centre.: Tourism-led Poverty Reduction Programme (TPRP), Programme proposal. Geneva. http://www.intracen.org/exporters/tourism/ (2009)
Jamieson, W., Goodwin, H., Edmonds, C.M.: Contribution of tourism to poverty alleviation: Pro-poor tourism and the challenge of measuring impacts. University of Hawaii at Manoa (2004)
Jiang, M., DeLacy, T., Mkiramweni, N.P., Harrison, D.: Some evidence for tourism alleviating poverty. Ann. Touris. Res. 38 (3), 1181–1184 (2011)
Kim, N., Song, H.J., Pyun, J.H.: The relationship among tourism, poverty, and economic development in developing countries: A panel data regression analysis. Tour. Econ. 22 (6), 1174–1190 (2016)
Liu, C.: On the impact of tourism industry development, price effect and its social welfare. Tour. Sci. 27 (6), 25–38 (2013)
Llorca-Rodríguez, C.M., Casas-Jurado, A.C., García-Fernández, R.M.: Tourism and poverty alleviation: An empirical analysis using panel data on Peru’s departments. Int. J. Tour. Res. 19 (6), 746–756 (2017)
Ma, B., Cai, Z., Zheng, J., Wen, Y.: Conservation, ecotourism, poverty, and income inequality - A case study of nature reserves in Qinling. China. World Dev. 115 , 236–244 (2019a)
Ma, M., Cai, W., Cai, W., Dong, L.: Whether carbon intensity in the commercial building sector decouples from economic development in the service industry? Empirical evidence from the top five urban agglomerations in China. J. Clean Prod. 222 , 193–205 (2019b)
Manwa, H., Manwa, F.: Poverty alleviation through pro-poor tourism: The role of Botswana forest reserves. Sustainability 6 (9), 5697–5713 (2014)
Manyara, G., Jones, E.: Community-based tourism enterprises development in Kenya: An exploration of their potential as avenues of poverty reduction. J. Sustain. Tour. 15 (6), 628–644 (2007)
Mazzanti, M.: Is waste generation de-linking from economic growth? Empirical evidence for Europe. Appl. Econ. Lett. 15 (4), 287–291 (2008)
Mazzanti, M., Zoboli, R.: Waste generation, waste disposal and policy effectiveness: Evidence on decoupling from the European Union. Resour. Conserv. Recycl. 52 (10), 1221–1234 (2008)
Mbaiwa, J.E.: The problems and prospects of sustainable tourism development in the Okavango Delta. Botswana. J. Sustain. Tour. 13 (3), 203–227 (2005)
Medina-Muñoz, D.R., Medina-Muñoz, R.D., Gutiérrez-Pérez, F.J.: The impacts of tourism on poverty alleviation: An integrated research framework. J. Sustain. Tour. 24 (2), 270–298 (2016)
Mitchell, J., Ashley, C.: Can tourism help reduce poverty in Africa? Overseas Development Institute, London (2006)
Mitchell, J., Ashley, C.: Tourism and poverty reduction: Pathways to prosperity. Earthscan, London (2010)
Muchapondwa, E., Stage, J.: The economic impacts of tourism in Botswana, Namibia and South Africa: Is poverty subsiding? Nat. Resour. Forum 37 (2), 80–89 (2013)
Mutana, S., Chipfuva, T., Muchenje, B.: Is tourism in Zimbabwe developing with the poor in mind? Assessing the pro-poor involvement of tourism operators located near rural areas in Zimbabwe. Asian Soc. Sci. 9 (5), 154–161 (2013)
Njoya, E.T., Seetaram, N.: Tourism contribution to poverty alleviation in Kenya: A dynamic computable general equilibrium analysis. J. Travel Res. 57 (4), 513–524 (2018)
OECD. Indicators to Measure Decoupling of Environmental Pressure from Economic Growth (Report No. SG/SD (2002) 1). Paris: OECD (2002)
Oh, C.O.: The contribution of tourism development to economic growth in the Korean economy. Tourism Manage. 26 (1), 39–44 (2005)
Oviedo-García, M.Á., González-Rodríguez, M.R., Vega-Vázquez, M.: Does sun-and-sea all-inclusive tourism contribute to poverty alleviation and/or income inequality reduction? The case of the Dominican Republic. J. Travel Res. 58 (6), 995–1013 (2019)
Poverty. United Nations Educational, Scientific and Cultural Organization. www.unesco.org . http://www.unesco.org/new/en/social-and-human-sciences/themes/international-migration/glossary/poverty/ (2019). Accessed 29 December 2019
Rakotondramaro, H., Andriamasy, L.: Multivariate Granger Causality among tourism, poverty and growth in Madagascar. Tour. Manage. Perspect. 20 , 109–111 (2016)
Reeder, R.J., Brown, D.M.: Recreation, tourism, and rural well-being. US Department of Agriculture, Economic Research Service, Washington (2005)
Riddington, G., McArthur, D., Harrison, T., Gibson, H.: Assessing the economic impact of wind farms on tourism in Scotland: GIS, surveys and policy outcomes. Int. J. Tour. Res. 12 (3), 237–252 (2010)
Sabates, R.: The impact of lifelong learning on poverty reduction (Doctoral dissertation). https://www.learningandwork.org.uk/wp-content/uploads/2017/01/The-Impact-of-Lifelong-Learning-on-Poverty-Reduction-Public-Value-Paper-1.pdf (2008). Accessed 29 December 2019
Scheyvens, R.: Exploring the tourism-poverty nexus. Curr. Issues Tour. 10 (2–3), 231–254 (2007)
Scheyvens, R.: Tourism and Poverty. Routledge, New York, NY (2012)
Book Google Scholar
Scheyvens, R., Hughes, E.: Can tourism help to “end poverty in all its forms everywhere”? The challenge of tourism addressing SDG1. J. Sustain. Tour. 27 (7), 1061–1079 (2019)
Sen, A.: Development as Freedom. Oxford University Press, Oxford (1999)
Sharpley, R.: The challenges of economic diversification through tourism: The case of Abu Dhabi. International. Int. J. Tour. Res. 4 (3), 221–235 (2002)
Sharpley, R., Naidoo, P.: Tourism and poverty reduction: The case of Mauritius. Tour. Hosp. Plann. Dev. 7 (2), 145–162 (2010)
Shen, Y., Alkire, S., Peng, Z.: Measurement and decomposition of multi-dimensional poverty in China. Chin. Econ. 14 (2), 12–28 (2019)
Snyman, S.L.: The role of tourism employment in poverty reduction and community perceptions of conservation and tourism in southern Africa. J. Sustain. Tour. 20 (3), 395–416 (2012)
Spenceley, A., Meyer, D.: Tourism and poverty reduction: Theory and practice in less economically developed countries. J. Sustain. Tour. 20 (3), 297–317 (2012)
Tang, Z., Shang, J., Shi, C., Liu, Z., Bi, K.: Decoupling indicators of CO2 emissions from the tourism industry in China: 1990–2012. Ecol. Indic. 46 , 390–397 (2014)
Tapio, P.: Towards a theory of decoupling: Degrees of decoupling in the EU and the case of road traffic in Finland between 1970 and 2001. Transp. Policy 12 (2), 137–151 (2005)
United Nations Development Programme.: Human Development Report 2010: The real wealth of nations: Pathways to human development. New York: UNDP (2010a)
United Nations Development Programme.: Human Development to Eradicate Poverty. New York: Oxford University Press (1997)
United Nations Development Programme.: What will it take to achieve the Millennium Development Goals? An international assessment. New York: UNDP (2010b)
United Nations World Tourism Organization.: Tourism and poverty alleviation. Madrid (2002)
Vanegas, M., Sr., Gartner, W., Senauer, B.: Tourism and poverty reduction: An economic sector analysis for Costa Rica and Nicaragua. Tour. Econ. 21 (1), 159–182 (2015)
Wang, R., Cheng, J., Zhu, Y., Lu, P.: Evaluation on the coupling coordination of resources and environment carrying capacity in Chinese mining economic zones. Resour. Policy 53 , 20–25 (2017a)
Wang, X., Zhen, F., Shen, L., Wu, X.: Evaluation of tourism poverty alleviation based on the perspective of poor residents. Geogr. Res. 36 (12), 2355–2368 (2017b)
Wang, Y., Qian, L., Chen, Y., Hu, Z.: Multidimensional and comprehensive poverty measurement of poverty-stricken counties from the perspective of ecological poverty. Chin. J. Appl. Ecol. 28 (8), 2677–2686 (2017c)
Wang, K., Gan, C., Chen, L., Voda, M.: Poor residents’ perceptions of the impacts of tourism on poverty alleviation: from the perspective of multidimensional poverty. Sustainability. 12 , 7515 (2020)
Winters, P., Corral, L., Mora, A.M.: Assessing the role of tourism in poverty alleviation: A research agenda. Dev. Policy Rev. 31 (2), 177–202 (2013)
Xue, J.: Indicators of decoupling housing-related environmental impacts from economic growth. J. Hous. Built Environ. 27 (4), 495–516 (2012)
Yang, F., Chen, L., Zhuang, T., Zeng, S.: Study on multidimensional poverty measurement and spatio-temporal evolution based on the sustainable livelihood framework. Soft Sci. 31 (10), 38–42 (2017)
Yuan, Y., Wang, Y., Ma, J., Wei, H., Peng, J.: Multidimensional evaluation of county poverty degree in Hebei Province. Prog. Geogr. 33 (1), 124–133 (2014)
Zeng, B., Ryan, C.: Assisting the poor in China through tourism development: A review of research. Tourism Manage. 33 (2), 239–248 (2012)
Zeng, B., Carter, R.W., Lacy, T., Bauer, J.: Effects of tourism development on the local poor people: Case study in Taibai Region China. J. Serv. Res. 5 , 131–148 (2005)
Zhao, W., Ritchie, J.B.: Tourism and poverty alleviation: An integrative research framework. Curr. Issues Tour. 10 (2–3), 119–143 (2007)
Zhao, X., Zhang, X., Shao, S.: Decoupling CO 2 emissions and industrial growth in China over 1993–2013: The role of investment. Energy Econ. 60 , 275–292 (2016)
Download references
Funding for this research was provided by the National Natural Science Foundation of China (Grant No. 41871134).
Author information
Authors and affiliations.
School of Geography and Ocean Science, Nanjing University, Nanjing, 210023, China
Xia Wang & Peiru Cai
You can also search for this author in PubMed Google Scholar
Corresponding author
Correspondence to Xia Wang .
Ethics declarations
Conflict of interest.
The authors declare that they have no conflict of interest.
Additional information
Publisher's note.
Springer Nature remains neutral with regard to jurisdictional claims in published maps and institutional affiliations.
Rights and permissions
Reprints and permissions
About this article
Wang, X., Cai, P. The relationship between tourism development and multidimensional poverty reduction: A decoupling analysis. Qual Quant 56 , 2501–2518 (2022). https://doi.org/10.1007/s11135-021-01233-4
Download citation
Accepted : 02 September 2021
Published : 09 September 2021
Issue Date : August 2022
DOI : https://doi.org/10.1007/s11135-021-01233-4
Share this article
Anyone you share the following link with will be able to read this content:
Sorry, a shareable link is not currently available for this article.
Provided by the Springer Nature SharedIt content-sharing initiative
- Tourism development
- Multidimensional poverty reduction
- Decoupling analysis
- Find a journal
- Publish with us
- Track your research
ORIGINAL RESEARCH article
A study on the efficiency of tourism poverty alleviation in ethnic regions based on the staged dea model.

- School of Business Administration, Guizhou University of Finance and Economics, Guiyang, China
Poverty alleviation through tourism is an important way for China to achieve targeted poverty alleviation and win the battle of poverty alleviation. As a region with deep poverty and great difficulty in poverty alleviation, whether tourism development has injected key impetus into ethnic minority areas needs to be tested by both qualitative analysis and quantitative measurement. This paper takes eight ethnic provinces (regions) in China as an example to conduct an empirical study. Based on the Data Envelopment Analysis (DEA)-BCC model and Malmquist index, it evaluates the tourism investment and tourism poverty alleviation efficiency of the ethnic regions in the two stages of tourism poverty alleviation, and analyzes them by classification. The results of the study show: (1) The pure technical efficiency in the first stage is relatively high, but the total factor productivity of each region is declining; (2) The pure technical efficiency in the second stage is also relatively high, but the scale efficiency is low, and the change rate of total factor productivity of the provinces in China has increased significantly; (3) The “double high” type includes Guangxi, Inner Mongolia, and Guizhou, and the “double low” type includes Qinghai, Yunnan, Tibet, Xinjiang, and Ningxia. The results of the study generally show that tourism poverty alleviation has brought about the improvement of the living standards of residents and the development of local economy, but the efficiency of tourism poverty alleviation needs to be improved. On this basis, the article puts forward corresponding improvement measures, in order to further help the ethnic minority areas get rid of poverty in a comprehensive way by promoting the efficient and sustainable development of tourism.
Introduction
Poverty is one of the major social problems facing humankind, a severe test that China faces in building a moderately prosperous society in an all-round way, and the focus of attention for all sectors of society in order to achieve social stability, enhance people's well-being, and promote human development and progress ( Davidson and Sahli, 2015 ). Practice has proved that poverty alleviation by tourism has become an important way for poverty-stricken areas to escape the poverty trap and is a regional development model that drives poor areas with better tourism resources to develop their economy and achieve prosperity ( Medina Muñoz and Gutiérrez Pérez, 2016 ). The tourism poverty alleviation of China began to rise at the end of the last century. In recent years, the slogan of “targeted poverty alleviation” has been put forward and further refined, and the development of tourism industry in poverty-stricken areas has been promoted through the development of characteristic cultural tourism. From 2010 to 2014, more than 10% of the poor people were lifted out of poverty through the development of tourism across the country, and more than 10 million people were lifted out of poverty through tourism ( He and Wang, 2019 ). Winning the battle against poverty is the bottom line task of building a moderately prosperous society in an all-round way as scheduled in 2020. As of May 16, 2020, there are still 52 state-level poverty-stricken counties in China that have not yet been lifted out of poverty. They are distributed in seven provincial administrative regions in China, including Xinjiang Uygur Autonomous Region, Yunnan Province, Guizhou Province, Guangxi Zhuang Autonomous Region, and Ningxia Hui Autonomous Region. The five provincial-level administrative regions all belong to the eight ethnic provinces (hereinafter referred to as ethnic regions), and the number of impoverished counties in ethnic regions accounts for more than 71% of the total. It can be seen that ethnic regions are currently the top priority in China's overall victory in the battle against poverty. Due to the relatively backward socioeconomic development level, inconvenient transportation, and other factors in the ethnic areas, their natural landscapes, ethnic customs, and cultural customs are relatively intact, their tourism resources are well-endowed, and tourism is developing rapidly. Tourism poverty alleviation is one of the important measures to achieve targeted poverty alleviation in China. However, whether the development of tourism can effectively alleviate poverty in ethnic areas is still doubtful. It is urgent to quantitatively measure and evaluate the efficiency of tourism poverty alleviation in ethnic areas in order to improve tourism in ethnic areas. The efficiency of poverty alleviation promotes the sustainable development of poverty alleviation by tourism in ethnic areas ( Yang et al., 2020 ).
Tourism poverty alleviation is a special development approach; there is a good synergy and coupling relationship between tourism and poverty alleviation development ( Croes and Vanegas, 2008 ; Zhang, 2019 ; Wang et al., 2020a ), which has an important impact on driving the economic development of poor regions and lifting the poor out of poverty ( Kim et al., 2016 ; Wang et al., 2020 ). Since the 1980s, tourism poverty alleviation as an effective anti-poverty measure has attracted the attention of scholars at home and abroad. After Ashley proposed “Tourism for the Poor People” (PPT) ( Ashley et al., 2001 ) and Sofield et al. proposed the concept of “Sustainable Tourism for Poverty Elimination” (ST-EP) ( Sofield et al., 2003 ), poverty alleviation by tourism has now become an important research content of the domestic and foreign tourism industry and academic circles ( Zhang and Zhang, 2005 ). Qin and others explored the relationship between tourism poverty alleviation and the local ecological environment ( Qin et al., 2020 ), Rogerson studied the effect of tourism poverty alleviation on the economic development of South Africa ( Rogerson, 2006 ), Chok et al. discussed the impact of tourism poverty alleviation on sustainable development ( Chok et al., 2007 ), and Hall focused on exploring the impact of tourism poverty alleviation on the development of southern countries' benefit ( Hall, 2007 ). In recent years, academic research on tourism poverty alleviation has gradually extended from the concept, development model ( Jin et al., 2019 ), influencing factors ( Lv et al., 2020 ), and implementation path of tourism poverty alleviation ( Guo, 2020 ) to the investigation of the efficiency of tourism poverty alleviation ( Liang et al., 2020 ). Through a review of the extensive literature, existing relevant studies have focused on measurement methods, tourism poverty alleviation regions, temporal evolution, industry sectors, and efficiency improvement measures; among them, improving tourism development capacity is an important measure ( Dias et al., 2020 ). Some scholars have found that the resource allocation and management level of tourism poverty alleviation in ethnic areas has been greatly improved, and the pure technical efficiency is relatively high, but the distribution of tourism resources still needs to be further optimized ( Zapata et al., 2011 ; Chen and Wang, 2020 ).
Most of the domestic and international scholars use Data Envelopment Analysis (DEA) for efficiency evaluation ( Habibov and Fan, 2010 ; Xu and Chen, 2015 ), and have explored the combination of traditional DEA with other methods, such as with the Malmquist index ( Chen et al., 2018 ; Lu et al., 2019 ; Yin and Tan, 2019 ), the two-stage bootstrap-DEA method ( Ren et al., 2016 ; Chaabouni, 2019 ), the three-stage DEA method ( Cao and Ma, 2017 ; Zhao H. et al., 2018 ), the Super-SBM model ( Croes and Rivera, 2017 ; Wang et al., 2019 ), and the DEA-Tobit method ( Heyuan and Xiaoling, 2016 ). Others have measured efficiency through the use of AHP hierarchical analysis ( Zhang and Xiang, 2016 ) and gray correlation analysis ( Deng et al., 2015 ). The traditional DEA method is the most commonly used method to evaluate the efficiency of tourism poverty alleviation ( Han et al., 2019 ; Wang and Li, 2019 ), but it easily leads to deviations in the measured tourism poverty alleviation efficiency value, which needs to be further optimized. The existing literature mainly covers the study area including physical and geographical regions such as the western region ( Feng et al., 2020 ) and the Wuling Mountains ( Long et al., 2015 ; Wang et al., 2020b ), as well as contiguous areas of special hardship such as the 20 poor counties (cities and districts) in the Wuling Mountains Hunan area ( Huang, 2017 ) and Dabie Mountains ( Liang et al., 2020 ). In addition, it also covers minority regions in Hainan Province ( Yan et al., 2018 ), Xiangxi Tujia and Miaoze Autonomous Prefecture ( Zhang and Xiang, 2016 ), 12 allied cities in Inner Mongolia ( Wu and Liu, 2018 ), and Enshi Tujia and Miao Autonomous Prefecture ( Wang and Lin, 2020 ). As far as the research objects are concerned, most of them are targeted at the country as a whole, individual provinces or geographically concentrated poverty-stricken regions, lacking a targeted comparative study of the efficiency of tourism poverty alleviation in various ethnic provinces (regions), weakening the reference value of improving poverty alleviation in poor ethnic regions. In terms of research content, scholars have used a variety of research methods to evaluate the efficiency of tourism poverty alleviation in multiple regions and industry sectors ( Xu and Chen, 2015 ; Wang and Guo, 2018 ), and some scholars have conducted static and dynamic analysis and evaluation in conjunction with the Malmquist index to identify the main reasons affecting the change in total factor productivity of tourism poverty alleviation ( Dias et al., 2020 ). Other scholars have studied the spatial differentiation of the efficiency of tourism poverty alleviation by combining the spatial analysis function of GIS, analyzing the global spatial autocorrelation of the overall efficiency of tourism poverty alleviation ( Deng and Zhang, 2017 ), revealing the aggregation benefits and inter-regional gaps that tourism poverty alleviation possesses in space ( Yang et al., 2018 ), and proposing corresponding measures to improve the efficiency of tourism poverty alleviation ( Sun and Zhang, 2018 ). The efficiency of tourism poverty alleviation consists of two stages: the evaluation of the efficiency of tourism development and the evaluation of the efficiency of tourism output for poverty alleviation, but most of the existing literature only studies the efficiency of the output of tourism poverty alleviation without considering the efficiency of the input stage of tourism poverty alleviation, resulting in the inability to more objectively evaluate the overall efficiency of poverty alleviation and trace the more essential influencing factors of tourism poverty alleviation.
In general, in sharp contrast to the practice of tourism poverty alleviation, relevant research on the efficiency of tourism poverty alleviation in ethnic areas is still lagging behind, especially on the input–output efficiency of tourism poverty alleviation in ethnic regions, and the relevant results are also scattered, so there is an urgent need to verify the promotion effect of relevant tourism poverty alleviation policies in greater depth, so as to scientifically propose future development strategies and development paths for tourism poverty alleviation in ethnic regions. Therefore, this paper adopts the two-stage DEA-BCC model combined with Malmquist index to conduct empirical research, using eight provinces (regions) of China's ethnic groups as case sites to study the efficiency of tourism investment and tourism poverty alleviation in two stages for quantitative measurement and evaluation, to analyze the factors influencing the efficiency of tourism poverty alleviation, and to propose effective countermeasures to promote the efficiency of tourism poverty alleviation. Through more effective research methods and a more complete research process, in order to obtain more accurate and more valuable research results, it has important theoretical and practical significance for the positioning of tourism poverty alleviation in ethnic areas, the enhancement of the efficiency of tourism poverty alleviation, and the realization of comprehensive and precise poverty alleviation strategic planning, and provides reference for the development of poverty alleviation work in poor ethnic regions in China.
Research Design
Research methodology, data envelopment analysis analysis method.
Data Envelopment Analysis analysis method, also known as DEA method, is mainly used to evaluate the efficiency of complex systems with multiple inputs and multiple outputs. The basic models include the CCR model under the assumption of constant returns to scale and the BCC model under the assumption of variable returns to scale. The biggest advantage of the BCC model is that it eliminates the assumption of constant returns to scale. Using this model, the technical effectiveness and scale effectiveness of the decision-making unit can be evaluated. Compared with the CCR model, it can provide more effective management information and evaluation results ( Zhao C. et al., 2018 ). This paper selects the BCC model to evaluate the efficiency of tourism poverty alleviation. The results of DEA include comprehensive efficiency, technical efficiency, scale efficiency, and scale returns. Comprehensive efficiency reflects the allocation, utilization, and scale agglomeration efficiency of element resources. Technical efficiency reflects the allocation and utilization efficiency of factor resources. Scale efficiency reflects the scale agglomeration efficiency of factor resources. Returns to scale are divided into three situations: increasing returns to scale (IRS), constant returns to scale (CRS), and diminishing returns to scale (DRS).
Suppose there are n DMUs representing input and output. Each DMU corresponds to m types of inputs and s types of outputs, which are represented by vectors X ij and Y rj , namely:
Among them, X ij is the i type of input of any decision-making unit DMU, and Y rj is the r type of output of any decision-making unit DMU. For each DMU, the investment-oriented BCC model is as follows:
When θ = 1 and s − = s + = 0 , the decision unit DEA is judged to be valid, indicating that the input–output of tourism poverty alleviation in the region happens to reach the optimal efficiency; when θ < 1 and s − or s + ≠ 0 , the decision unit is judged to be DEA invalid, indicating that the input–output of tourism poverty alleviation in the region has not reached the optimal efficiency.
Malmquist Index Model
The Malmquist index was first proposed by Malmquist (1953) and later improved and defined by Caves et al. (1982) . The Malmquist index is an efficiency evaluation method based on a distance function 1 that dynamically reflects the change and trend of the relative efficiency of the research object ( Zhang et al., 2013 ). The Malmquist model is based on DEA and calculates the input–output efficiency through the distance function ratio, which can reflect the dynamic changes in relative efficiency from multiple angles and levels. The model is constructed as follows:
According to the definition of the Malmquist TPF index by Caves et al. (1982) , the Malmquist TPF index based on the technology of t period is:
The same as above, the Malmquist TPF index based on technology in t + 1 period is:
In order to avoid the arbitrariness in the selection of production technology reference, the geometric mean of the two Malmquist TFP indices is used as the measurement of the input-oriented Malmquist TFP, which is:
If the value of the Malmquist TPF index is >1, it indicates that the total factor productivity level of the decision-making unit t + 1 period has increased compared with the previous period. If the value of the Malmquist TFP index is equal to 1, it indicates that the total factor productivity between the two periods is consistent. If the value of the Malmquist TPF index is <1, it means that total factor productivity has fallen.
Evaluation Index
Sample selection and data sources.
Considering the representativeness and typicality of sample selection, as well as improving the richness of tourism poverty alleviation research objects, this paper selects ethnic regions in China with more backward economic development, deeper poverty, and better tourism resource endowment to study the efficiency of tourism poverty alleviation, including the eight provinces of Guangxi Zhuang Autonomous Region, Inner Mongolia Autonomous Region, Guizhou Province, Yunnan Province, Tibet Autonomous Region, Qinghai Province, Ningxia Hui Autonomous Region, and Xinjiang Uygur Autonomous Region. Based on the stage of vigorous development of China's tourism poverty alleviation, the selection of the study period by relevant scholars, and the availability of data, this paper selects input–output indicators for ethnic regions of China from 2003 to 2017, and the following data are obtained from the China Statistical Yearbook, China Tourism Yearbook, and provincial statistical yearbooks.
Selection of Indicators
The process of tourism poverty alleviation should include the process from the input of tourism development elements to the output of tourism development level and then to the output of tourism poverty alleviation benefits, that is, the process of tourism input and output and the transformation of tourism output into tourism poverty alleviation benefits. Therefore, the evaluation of the efficiency of tourism poverty alleviation in this paper will also proceed from two stages, namely, the evaluation of tourism development efficiency and the efficiency evaluation of tourism output of poverty alleviation benefits. This is shown in Figure 1 .

Figure 1 . Two-stage model.
The first stage is the evaluation of tourism development efficiency. By consulting a large number of relevant literature, this paper selects two variables, “tourism investment” and “fixed asset investment in the tertiary industry,” as the input variables of tourism industry. “Tourism investment” refers to the financial support provided by the state for the development of tourism in various regions. “Fixed asset investment in the tertiary industry” refers to the amount of fixed asset investment in the tertiary industry, including transportation, accommodation, and catering. At present, most of the output indicators of tourism development are based on the two indicators “total tourism revenue” and “total number of tourists.” The “total tourism revenue” refers to the sum of domestic tourism revenue and inbound tourism revenue, representing the economic output of the tourism industry. The “total number of tourists” is the sum of the number of domestic tourist receptions and the number of inbound tourists, which represents the scale of tourism industry output. This paper adds “tourism employees” as an output variable of the tourism industry on the basis of these two indicators because the employment of local poor residents driven by the development of tourism can be seen as one of the contributions of tourism to poverty alleviation.
The second stage is the evaluation of the poverty alleviation efficiency of tourism output. The tourism output indicators in the first stage are the input indicators in the second stage. In order to more accurately measure the poverty alleviation efficiency of tourism output, it is necessary to separate the poverty alleviation benefits generated by the tourism industry from the data jointly produced by various sectors of the national economy. At present, some scholars regard the ratio of total tourism revenue to GDP as the economic contribution of tourism, and use the idea of equal substitution to replace the proportion of per capita disposable income from tourism with the contribution of tourism, so that we can calculate the contribution of tourism in per capita disposable income. This paper calculates the per capita disposable income tourism contribution of rural residents and the disposable income tourism contribution of urban residents in each province to express the economic benefits generated by tourism. The “urban–rural income gap” is measured by the urban–rural income gap index, which refers to the ratio of the disposable income of urban residents to the per capita net income of rural residents. The “gross regional product per capita” refers to the market value of all final products (goods and services) produced by the region's economy and society using the factors of production within a certain period of time, and is an important indicator of a region's economic situation.
Empirical Analysis
Static efficiency analysis based on variable returns to scale.
Based on the construction of the BBC model with variable returns to scale and using DEAP2.1 software, the efficiency of the first and second stages of tourism poverty alleviation in the eight ethnic provinces and regions in 2003 and 2017 was calculated. The results are shown in Tables 1 , 2 .

Table 1 . The efficiency of the first stage of poverty alleviation by tourism in the ethnic regions and its decomposition.

Table 2 . The efficiency of the second stage of poverty alleviation by tourism in the ethnic regions and its decomposition.
In Table 1 , it can be seen that the average combined efficiency of the first stage of the ethnic areas was 0.800 in 2003, and in 2017, this mean value rose to 0.932, achieving improvement. In terms of overall efficiency, four provinces reached DEA effectiveness in 2003, namely, Guangxi, Guizhou, Yunnan, and Tibet, increasing to five regions in 2017, namely, Guangxi, Guizhou, Yunnan, Qinghai, and Xinjiang. In addition, Qinghai had higher integrated efficiency in 2003, Inner Mongolia and Xinjiang had lower integrated efficiency due to lower pure technical efficiency, and Ningxia had lower pure technical efficiency and scale efficiency. The combined efficiency of Inner Mongolia, Ningxia and Xinjiang improved significantly in 2017, with Inner Mongolia and Xinjiang mainly due to the pull of pure technical efficiency, but scale efficiency did not improve much, while Ningxia improved both pure technical efficiency and scale efficiency. On the whole, the level of resource allocation and management in ethnic areas in the first stage has been improved, but the scale of resource input needs to be further optimized.
In Table 2 , it can be seen that the average combined efficiency of the second stage in the ethnic areas is 0.532 in 2003 and 0.462 in 2017, which is much lower than the average combined efficiency of the first stage. It shows that although the investment in the tourism industry in ethnic areas has contributed to the development of the tourism industry, the development of the tourism industry has not been efficient in alleviating poverty in ethnic areas. From the perspective of DEA effectiveness, Tibet, Qinghai, and Ningxia provinces reached effectiveness in 2003, and only Tibet and Ningxia provinces reached DEA effectiveness in 2017. In terms of scale payoffs, provinces with decreasing scale payoffs predominated in both 2003 and 2017, suggesting that these provinces have a relative excess of inputs and underutilized resources. Overall, most regions had lower combined efficiency in 2003, mainly due to lower scale efficiencies. Pure technical efficiency and efficiency of scale declined in some provinces in 2017, resulting in a decline in the combined efficiency of both these areas. In addition, the pure technical efficiency of the two stages is higher, but compared with the first stage, the scale efficiency of the second stage is lower. It can be seen that the low scale efficiency is an important reason hindering the efficiency improvement of the second stage.
Dynamic Efficiency Analysis Based on Malmquist Index
According to the statistics of poverty alleviation by tourism in ethnic areas from 2003 to 2017, the DEAP2.1 software is used to calculate and decompose the total factor productivity change index of the first and second stages, and further analyze the changes in the efficiency of the two stages, and the specific results of the operation are shown in Tables 3 , 4 .

Table 3 . Malmquist index and its decomposition in the first stage from 2003 to 2017.

Table 4 . Malmquist index and its decomposition in the second stage from 2003 to 2017.
In Table 3 and Figure 2 , it can be seen that the TFP index for the first stage of the 2003–2017 period is <1, except in 2003–2004 and 2013–2014 when it was >1. Its mean value is also 1, indicating a downward trend in overall TFP in the first stage over the past 15 years, with a rate of decline of 9.9%. Among them, the largest decline was in 2009–2010, reaching 28.9%, mainly due to the decline in the rate of technological progress. Further analysis shows that the mean value of the technical efficiency change index from 2003 to 2017 is 1.014, and the mean value of the technical progress index is 0.889, indicating that the fluctuation of the total factor productivity index is mainly affected by the fluctuation of the technical progress index, so the key to improving the level of total factor productivity in the first stage lies in the technological progress of the tourism industry. Since 2003, the average values of the pure technical efficiency change index and the scale efficiency change index have increased by 1.2 and 0.2%, respectively, but both have been declining for part of the period, indicating that the resource allocation and scale of tourism in ethnic areas also need further improvement in the first stage.

Figure 2 . Malmquist index and its decomposition in the first stage from 2003 to 2017.
As can be seen in Table 4 and Figure 3 , the average value of the total factor productivity (TFP) index for the second stage was 1.011 in 2003–2017, indicating that TFP grew at an average rate of 1.1% per year and that the increase was most pronounced in 2007–2008, mainly due to technological progress. Further analysis shows that the mean value of the technical efficiency change index is 0.976, the mean value of the technical progress index is 1.035, and the growth rate of technical progress in the six time periods is greater than the growth rate of technical efficiency, indicating that the improvement of total factor productivity mainly depends on technical progress. In addition, pure technical efficiency and scale efficiency generally showed a declining trend from 2003 to 2017, making the overall change in technical efficiency also declining, suggesting that the main reason hindering the growth of technical efficiency is that both pure technical efficiency and scale efficiency are low. In general, there is still a lot of room for improvement in the second stage of tourism management level and technical allocation, resource allocation, and scale. Tables 3 , 4 show the results of the calculations of the Malmquist index and its decomposition in the time dimension for the two phases, and the changes in TFP and its decomposition for specific provincial regions in the two phases are shown in Tables 5 , 6 .

Table 5 . Malmquist index and its decomposition in the first stage of ethnic regions.

Figure 3 . Malmquist index and its decomposition in the second stage from 2003 to 2017.

Table 6 . Malmquist index and its decomposition in the second stage of ethnic regions.
As can be seen in Table 5 , the annual average TFP indices for the first stage in the ethnic regions of China are all <1, indicating a downward trend in TFP in all provinces. Among them, the pure technical efficiency change index and scale efficiency change index in Inner Mongolia and Ningxia are both >1; the pure technical efficiency in Qinghai is unchanged, while the scale efficiency has improved; and the scale efficiency in Xinjiang is unchanged, while the pure technical efficiency change index is >1. At the same time, the technical efficiency change index of these four provinces is >1, but the technical progress index is <1, indicating that technological progress is the main factor affecting the changes in total factor productivity in these four regions. Although the pure technical efficiency and scale efficiency of Guangxi, Guizhou, and Yunnan remain unchanged, and their technical efficiency has not changed, the decline in technology has led to a decline in the total factor productivity of these four provinces. In addition, the low technological progress index is also the reason for the decline in Tibet's total factor productivity. On the whole, the total factor productivity of each region in the first stage was declining, mainly due to technological progress.
In Table 6 , it can be seen that the second stage of TFP in ethnic areas basically shows an increasing trend, with Tibet, Ningxia, and Xinjiang showing declines of 1.5, 4.7, and 2.2%, respectively, mainly due to the decline in the rate of change of technological progress. In terms of technical efficiency, it declined in all six provinces except Tibet and Ningxia. In terms of technological progress, except for Tibet, Ningxia, and Xinjiang, there is an upward trend in technological progress in all regions. In terms of pure technical efficiency, only Guizhou has seen an increase, indicating that both the technical and management levels in ethnic regions have yet to be improved. In terms of scale efficiency, ethnic regions show a constant or declining trend, indicating that the level of resource allocation in ethnic regions also needs to be improved. Overall, although there were differences in the rate of change in TFP in the second stage, the differences were small, only Tibet, Ningxia, and Xinjiang were <1, and almost all of the remaining provinces achieved efficiency gains. The largest increase in TFP in Guangxi was 7.3%, indicating that Guangxi contributed the most to changes in TFP in ethnic regions. Compared with the first stage, the total factor productivity change rate of the provinces in the second stage has been significantly improved due to the increase in the change rate of technological progress.
Analysis of the Efficiency Types of Tourism Poverty Alleviation
In order to facilitate the comparative analysis of the empirical results, this paper further uses the Malmquist index values of the two stages, taking the average value of the Malmquist index in the first stage (0.901) and the average value of the Malmquist index in the second stage (1.011) as the mass point coordinates, and the total factor productivity index is the horizontal axis, and the second-stage total factor productivity index is the vertical axis; the efficiency level of tourism poverty alleviation in ethnic areas is divided into four categories, namely, “double-high” type, “low-high” type, “double-low” type, and “high-low” type. It is shown in Figure 4 .

Figure 4 . The distribution of efficiency in the first and second stages of the eight ethnic provinces.
From the results of cluster classification, the total factor productivity index values of ethnic regions are concentrated in the “double high” and “double low” types. Among them, the “double high” type includes Guangxi, Inner Mongolia, and Guizhou, which are located in the upper right quadrant. Although the two-stage efficiency of these three regions is relatively high, the second-stage efficiency of these three provinces is about 1.053, while the efficiency of the first stage is only around 0.951, indicating that the three provinces should strive to improve the efficiency of the first stage while consolidating the efficiency of the second stage. The “double-low” type includes Qinghai, Yunnan, Tibet, Xinjiang, and Ningxia, which are located in the lower left quadrant. The two-stage efficiency of these five provinces is low. It shows that these five regions should first improve the efficiency of the first stage or the second stage, and then gradually develop to the stage with higher efficiency in both stages. It should be pointed out that the efficiency of the two stages is relative. Therefore, on the whole, the efficiency of the second stage in my country's ethnic regions is significantly higher than the efficiency of the first stage.
Conclusions and Recommendations
This paper establishes a two-stage evaluation model for the efficiency of tourism poverty alleviation and uses the DEA method to evaluate the efficiency of tourism poverty alleviation in China's ethnic regions from 2003 to 2017. From the above analysis, it can be seen that tourism poverty alleviation has brought about an improvement in the living standards of the residents in the ethnic regions of China and the development of the local economy, but the efficiency of tourism poverty alleviation needs to be improved. The results are as follows:
(1) In the first stage, the level of resource allocation and management in the ethnic minority areas has improved considerably, and the pure technical efficiency is relatively high, but there is still a need to further optimize the allocation of tourism resources and the scale of investment in the ethnic minority areas; in the first stage, the total factor productivity of each region has shown a downward trend, and the key to enhancing it lies in promoting the technical progress of the tourism industry.
(2) Pure technical efficiency is also high in the second stage, but scale efficiency is low, which hinders the efficiency improvement in this stage, and should focus on the management level and technical allocation of tourism, resource allocation, and scale. In the second stage, the change rate of total factor productivity in the provinces has increased significantly, and the change rate of technological progress in the tourism industry should continue to be increased.
(3) The “double-high” type includes Guangxi, Inner Mongolia, and Guizhou, indicating that these provinces should focus on improving the efficiency of the first stage while stabilizing the efficiency of the second stage. The “double-low” model includes Qinghai, Yunnan, Tibet, Xinjiang, and Ningxia, implying that these five regions should increase investment in the tourism industry, promote the development of the tourism industry, and focus on the benefits of the poor in the process of tourism development.
Recommendations
Based on the aforementioned two-stage analysis of the efficiency of tourism poverty alleviation, China has demonstrated in practice that developing tourism is one of the effective ways to help poor areas escape poverty and become rich. Tourism has the characteristics of strong pull, poverty alleviation, and benefiting a wide range of people, making it quickly become a way to alleviate poverty in several areas. Through tourism poverty alleviation, great changes have taken place in ethnic regions. Due to the different development of resources in different regions, it is necessary to take targeted measures based on the actual conditions of each province. This paper puts forward the following suggestions:
First, broaden the financing channels for tourism poverty alleviation. In addition to relying on government investment and national bank loans for funding tourism poverty alleviation, local commercial banks should appropriately expand the scale of credit for some tourism poverty alleviation to nurture the development of tourism poverty alleviation in poor areas. At the same time, ethnic regions should seize the opportunity of the country's relevant policies on poverty alleviation and actively guide investment in tourism for poverty alleviation through measures such as upward struggle, external introduction, and internal revitalization. In addition, social capital is encouraged to participate in tourism poverty alleviation fairly, and enterprises of various ownerships are encouraged to invest in tourism poverty alleviation in ethnic areas according to law. Broaden domestic and foreign financing channels, use financial funds, private capital and foreign capital, broaden diversified funding sources, cultivate and develop a group of private, foreign, and mixed economic structure investment and financing entities, improve the efficiency of capital use, and help poverty alleviation in ethnic areas raise more funds. Specifically, the government can guide social capital to increase investment in tourism poverty alleviation through financial subsidies and loan interest discounts, and guide diversified funds such as private capital and industrial funds to support tourism poverty alleviation by supporting tourism enterprises to integrate and develop with related industries through the exchange of property rights and cooperative development, and encourage private capital to intervene in government-led poverty alleviation supporting infrastructure construction through BT (build-transfer), BOT (build–operate–transfer), and other methods ( Yang and Shi, 2014 ). Attract domestic or regional enterprises with certain economic strength, good reputation, and business expansion intention to develop tourism projects in the local area. In addition, part of the national poverty alleviation funds and related enterprises with good local efficiency and support for poverty alleviation will be used to establish a tourism development poverty alleviation fund, giving priority to those poor counties that have the ability to implement the tourism poverty alleviation model and promote the development of tourism. By increasing investment in tourism, the tourism industry can play its role as a “growth pole” and drive the ethnically impoverished areas to break through the “poverty vicious circle” proposed by Nacks and jump out of the “low-level equilibrium trap” proposed by Nelson.
Second, improve pure technology and scale efficiency. Technological progress is an extremely important way to promote the efficiency of tourism poverty alleviation. Through the above empirical research results, it can be seen that the overall efficiency is affected and restricted by pure technical efficiency and scale efficiency, and their effects on tourism input and tourism output stages are different. Therefore, at the stage of investment in the tourism industry, attention should be paid in improving the pure technical efficiency of tourism poverty alleviation in various provinces. Local governments should create a favorable investment environment for investors, actively introduce various types of investment, rationally allocate tourism resources, explore the “big data + tourism” poverty alleviation development model, and improve the scientific and technological level of tourism development, so as to realize the effective utilization of economic factors, thereby enhancing the comprehensive efficiency of tourism poverty alleviation. Tourism poverty alleviation in ethnic areas needs to seize the opportunity of the central government's implementation of the digital rural strategy, make full use of the advantages of new ideas, new technologies, and new industries, combine with poverty alleviation work, boldly explore and innovate the “big data + tourism” poverty alleviation mechanism, relying on the e-commerce platform to promote the sales of tourism products and agricultural and sideline products in ethnic areas. Accelerate the construction of a comprehensive service platform for smart tourism, and at the same time carry out informatization and informatization skill poverty alleviation for the poor. Focus on integrating the power of informatization construction such as “Village to Village” and “Distance Education,” extensively utilize the advantages of big data information resources, organize network poverty alleviation training activities, and set up virtual forums for big data + tourism poverty alleviation to improve the quality of the poor, thereby improving the efficiency of tourism poverty alleviation. At the stage of tourism output, it is necessary to scientifically judge the best scale of local tourism development, actively build a complete tourism industry chain, develop distinctive tourism industry brands, and continuously improve the scale benefits of tourism development.
Third, optimize the industrial structure and protect the environment. Optimizing the industrial structure is conducive to enhancing industrial competitiveness and giving play to regional advantages. Ethnic regions should rely on their own unique resource advantages and foundations, such as unique natural landscape and climate, distinctive regional food culture, strong national culture, and unique tourism products of ethnic minorities, give full play to the characteristics of the tourism industry's high degree of relevance, low employment threshold, strong comprehensive driving force, and large radiation traction, etc., to drive regional economic growth and employment of impoverished residents. In the ever-changing market demand, giving full play to the resource allocation and regulation role of the market economy and actively promoting the integrated development of the tourism industry and other industries, especially emerging industries, such as digital information and new energy, introduce energy-saving and environmentally friendly industrial forms, and actively eliminate outdated production capacity with high-energy consumption. In the process of developing tourism for poverty alleviation in ethnic areas, they should also actively cooperate with scientific research institutions and universities to improve the level of science and technology, actively carry out environmental governance and maintenance, establish a good environment and basic conditions for the development of the tourism industry, and ensure the sustainable development of work of regional economy and tourism poverty alleviation ( Li, 2018 ).
Finally, play the synergy of multiple subjects. Government departments should play a leading role and supervisory function in the process of tourism poverty alleviation, make reasonable arrangements for poverty alleviation development in ethnic regions, and overall planning for economic development. The government should carry out tourism-related skill training in accordance with the actual conditions in ethnic areas to improve the overall quality of local residents' learning ability, service level, professional skills and management ability, and enhance their ability to work. Poverty alleviation is one of the social responsibilities that enterprises and social organizations should actively fulfill. Enterprises can help expand the sales channels of tourism products in ethnic areas based on their own advantages in technology, resources, and channels, build an information sharing platform, help promote the image of tourist destinations and enhance the popularity of local tourism, and at the same time provide training in job skills and employment opportunities for impoverished residents, helping to solve the problems of surplus labor and difficulties in starting up businesses for migrant workers. Poor residents are an important force in the fight against poverty. Considering the sustainable development of tourism poverty alleviation in ethnic areas, local residents should be encouraged to rely on their handicraft skills, land, housing, and other resources to engage in employment activities such as tourism services, the production of special handicraft products, the sale of tourism souvenirs, and the establishment of farmhouse homes, coordinating the relationship between the development of tourism poverty alleviation and the benefits to residents, and promoting their participation in tourism poverty alleviation, so that residents can lift themselves out of poverty and improve their living standards while raising the level of local economic development. Considering the sustainable development of tourism and poverty alleviation in poor areas, local residents should be encouraged to rely on their handicraft skills, land, houses, and other resources to engage in employment activities such as tourism services, production of special handicraft products, sale of tourist souvenirs, and establishment of farmhouses. In addition, the relationship between the development of tourism poverty alleviation and the benefit of poor residents should be coordinated to promote the participation of poor residents in poverty alleviation, so that poor residents can get out of poverty and improve their living standards while increasing the level of local economic development.
Research Gaps and Outlook
Due to data limitations, the research cycle of this paper is relatively short. In the future, as the data continue to improve, relevant studies may add tests for the generalizability of the conclusions in this paper to obtain more reliable conclusions. In addition, the selection of evaluation indicators was influenced by the availability of data and did not fully take into account the impact of indicators such as health, education, social welfare, etc., and more evaluation indicators could be added in the future to improve the accuracy of the results.
Data Availability Statement
The raw data supporting the conclusions of this article will be made available by the authors, without undue reservation.
Ethics Statement
The studies involving human participants were reviewed and approved by the Academic Committee of Guizhou University of Finance and Economics. Written informed consent to participate in this study was provided by the participants' legal guardian/next of kin.
Author Contributions
JY conceived the study and wrote the manuscript. YW wrote and revised the manuscript. JW analyzed the data. CW conceived the study and revised the manuscript. QW revised the manuscript. All authors contributed to the article and approved the submitted version.
This work was supported by the Humanities and Social Sciences Grant of the Chinese Ministry of Education 16YJAZH069, the Key Research Support Project for Professional Graduate Students of the Ministry of Culture and Tourism of China in 2019 WLRCY2019-037, the Guizhou University of Finance and Economics and the Ministry of Commerce Institute of International Trade and Economic Cooperation Joint Fund Project of China 2017SWBZD14, and the Humanities and Social Science Project of Higher Education Institutions of the Education Department of Guizhou Province 2019ZD10.
Conflict of Interest
The authors declare that the research was conducted in the absence of any commercial or financial relationships that could be construed as a potential conflict of interest.
1. ^ The distance function is a tool for studying multi-input and multi-output technical systems without making any assumptions about the behavior of producers.
Ashley, C., Roe, D., and Goodwin, H. (2001). Pro-Poor Tourism Strategies: Making Tourism Work for the Poor - A Review of Experience, Pro-Poor Tourism Report . London: The Russell Press.
Google Scholar
Cao, Y., and Ma, L. (2017). Evaluation on the efficiency of tourism poverty alleviation in China's ethnic regions based on the three-stage DEA. East China Econ. Manage. 31, 91–97. doi: 10.3969/j.issn.1007-5097.2017.09.012
CrossRef Full Text | Google Scholar
Caves, D. W., Christensen, L. R., and Diewert, W. E. (1982). Multilateral comparisons of output, input, and productivity using superlative index numbers. Econ. J. 92, 73–86. doi: 10.2307/2232257
Chaabouni, S. (2019). China's regional tourism efficiency: a two-stage double bootstrap data envelopment analysis. J. Destin. Market. Manage. 11, 183–191. doi: 10.1016/j.jdmm.2017.09.002
Chen, C., and Wang, Y. (2020). Evaluation and influencing factors of tourism poverty alleviation efficiency in contiguous destitute areas: empirical evidence from Luoxiaoshan area. Econ. Geography 40, 226–233. doi: 10.15957/j.cnki.jjdl.2020.01.025
Chen, G., Lu, S., and Cheng, Z. (2018). Measure and precise optimization of Tsinling mountains area tourism poverty alleviation efficiency. Resour. Dev. Market 34, 729–734. doi: 10.3969/j.issn.1005-8141.2018.05.026
Chok, S., Macbeth, J., and Warren, C. (2007). Tourism as a tool for poverty alleviation: a critical analysis of ‘pro-poor tourism’and implications for sustainability. Curr. Issues Tour. 10, 144–165. doi: 10.2167/cit303
Croes, R., and Rivera, M. A. (2017). Tourism's potential to benefit the poor. Tour. Econ. 23, 29–48. doi: 10.5367/te.2015.0495
Croes, R., and Vanegas, M. Sr. (2008). Cointegration and causality between tourism and poverty reduction. J. Travel Res. 47, 94–103. doi: 10.1177/0047287507312429
Davidson, L., and Sahli, M. (2015). Foreign direct investment in tourism, poverty alleviation, and sustainable development: a review of the Gambian hotel sector. J. Sustain. Tour. 23, 167–187. doi: 10.1080/09669582.2014.957210
Deng, A., and Zhang, X. (2017). Tourism poverty alleviation efficiency differences and spatial-temporal evolution features in the Yangtze river economic belt. J. Chong. Jiaot. Univ. 17, 42–47.
Deng, X., Zeng, L., Luo, M., and Xiao, H. (2015). Effects analysis of pro-poor tourism in Yunnan Wumeng mountain areas. Ecol. Econ. 31, 134–138.
Dias, Á., González-Rodríguez, M. R., and Patuleia, M. (2020). Developing poor communities through creative tourism. J. Tour. Cult. Change 5, 1–21. doi: 10.1080/14766825.2020.1775623
Feng, F., Tang, R., and Feng, X. (2020). Study on coupling relationship between spatial structure of tourism elements and tourism environment in Huangshan city. Areal Res. Dev. 39, 105–110.
Guo, Y. (2020). Research on the poverty alleviation practice model and path of rural tourism in Henan province from the perspective of targeted poverty alleviation. Agric. Econ. 10, 55–56.
Habibov, N. N., and Fan, L. (2010). Comparing and contrasting poverty reduction performance of social welfare programs across jurisdictions in canada using Date Envelopment Analysis (DEA): an exploratory study of the era of devolution. Eval. Prog. Plann . 33, 457–467. doi: 10.1016/j.evalprogplan.2009.10.006
Hall, C. M. (2007). Pro-poor tourism: do ‘tourism exchanges benefit primarily the countries of the south’?. Curr. Issues Tour. 10, 111–118. doi: 10.1080/13683500708668426
Han, L., Liu, X., Zheng, J., and Han, C. (2019). The spatial-temporal differentiation of the tourism poverty alleviation efficiency and its driving mechanism - a case study of 33 state-level poverty-stricken counties in Xinjiang. J. Xinjiang Univ. 47, 23–33. doi: 10.13568/j.cnki.issn1000-2820.2019.06.003
He, H., and Wang, S. (2019). A review of rural pro-poor tourism effect in China from a multidimensional perspective. Chin. J. Agric. Resour. Reg. Plann. 40, 180–187. doi: 10.7621/cjarrp.1005-9121.20190423
Heyuan, Y., and Xiaoling, Z. (2016). Ecoefficiency of intensive agricultural production and its influencing factors in China: an application of DEA-tobit analysis. Discr. Dyn. Nat. Soc. 2016:4786090. doi: 10.1155/2016/4786090
Huang, Y. (2017). The efficiency evaluation and spatio-temporal differentiation of tourism poverty alleviation in extremely difficult areas – a case study of 20 counties in Wuling mountain area of Hunan province. Econ. Geography 37:235. doi: 10.15957/j.cnki.jjdl.2017.11.028
Jin, S., Huang, J., and Lin, Z. (2019). Thinking on the path to realize the development of tourism poverty alleviation in ethnic areas. J. Yanbian Univ. 52, 93–101; 144.
Kim, N., Song, H., and Pyun, J. H. (2016). The relationship among tourism, poverty, and economic development in developing countries. Tour. Econ. 22, 1174–1190. doi: 10.1177/1354816616669038
Li, Y. (2018). Efficiency of China's Tourism Poverty Alleviation: Research Based on DEA Window Analysis and Nonlinear Threshold Effect . Dissertation, Guangxi University.
Liang, X., Wei, H., Xia, Q., and Yu, J. (2020). The efficiency and path of poverty alleviation by tourism in my country's concentrated contiguous destitute areas. Stat. Decis. 36, 16–20. doi: 10.13546/j.cnki.tjyjc.2020.21.003
Long, Z., Du, Q., and Zhou, T. (2015). The evolution of time and space differentiation of Wuling mountain area tourism poverty alleviation efficiency. Econ. Geography 35, 210–218. doi: 10.15957/j.cnki.jjdl.2015.10.029
Lu, Y. Y., He, Y., Wang, B., Ye, S.-S., Hua, Y., and Ding, J. (2019). Efficiency evaluation of atmospheric pollutants emission in Zhejiang province China: a DEA-Malmquist based approach. Sustainability 11:4544. doi: 10.3390/su11174544
Lv, H., Zhong, H., and Ding, Z. (2020). Analysis of the influencing factors of community residents' participation in tourism poverty alleviation in ethnic areas – based on the survey of Zhaoxing Scenic Spot in Guizhou. J. Guilin Univ. Technol. 40, 637–642. doi: 10.3969/j.issn.1674-9057.2020.03.026
Malmquist, S. (1953). Index numbers and indifference surfaces. Trabaj. Estadist. 4, 209–242. doi: 10.1007/BF03006863
Medina Muñoz, D. R., and Gutiérrez Pérez, F. J. (2016). The impacts of tourism on poverty alleviation: an integrated research framework. J. Sustain. Tour. 24, 270–298. doi: 10.1080/09669582.2015.1049611
Qin, Q., Hu, Z., Liu, A., Zhao, Z., and Chen, Y. (2020). Study on the coupling and coordination relationship between tourism poverty alleviation and ecological environment in impoverished mountainous areas. World Region. Stud. 29, 1272–1283. doi: 10.1155/2020/5094863
Ren, C., Li, R., and Guo, P. (2016). Two-stage DEA analysis of water resource use efficiency. Sustainability 9:52. doi: 10.3390/su9010052
Rogerson, C. M. (2006). Pro-poor local economic development in South Africa: the role of pro-poor tourism. Local Environ. 11, 37–60. doi: 10.1080/13549830500396149
Sofield, T., De Lacy, T., Bauer, J., and Daugherty, S. (2003). Pro-poor tourism sustainable tourism-eliminating poverty. Research 30, 17–19. Available online at: http://ecite.utas.edu.au/27647
Sun, C., and Zhang, M. (2018). Research on the efficiency of tourism-aided poverty alleviation in the context of accurate poverty alleviation – taking the Dabie mountain area of Hubei as an example. China Soft Sci. 4, 65–73.
Wang, K., Gan, C., Wang, M., Zhu, F., and Deng, C. (2019). Spatio-temporal pattern and the influencing factors of tourism poverty alleviation efficiency in Hubei province. Resourc. Environ. Yangtze Basin 28, 863–871. doi: 10.11870/cjlyzyyhj201904012
Wang, K., and Lin, H. (2020). Research on the Influence of new-type urbanization on the efficiency of pro-poor tourism –a case study of 8 national-level poor counties in Enshi autonomous prefecture. J. Hubei Minzu Univ. 38, 56–63. doi: 10.13501/j.cnki.42-1328/c.2020.03.008
Wang, K., Zhu, F., and Gan, C. (2020a). Study on the coupling relationship between tourism development level and multidimensional poverty in Wuling mountain area. Chong. Soc. Sci. 7, 66–78.
Wang, K., Zhu, F., Gan, C., and Xi, J.-C. (2020b). The coupling coordination relationship between industrial structure transformation and upgrade level and tourism poverty alleviation efficiency: a case study of Wuling mountain area. J. Nat. Resour. 35, 1617–1632. doi: 10.31497/zrzyxb.20200708
Wang, S., and Guo, S. (2018). Research on the efficiency and optimization of pro-poor tourism in ethnic areas of inner Mongolia. Soc. Scient. 6, 88–97. doi: 10.3969/j.issn.1002-3240.2018.06.012
Wang, Z., and Li, D. (2019). Analysis on the effect of poverty alleviation by tourism in Wuling mountain region. Chin. J. Agric. Resour. Reg. Plann. 40, 122–132.
Wang, Z., Li, J., Liu, J., and Shuai, C. (2020). Is the photovoltaic poverty alleviation project the best way for the poor to escape poverty? – A DEA and GRA analysis of different projects in rural China. Energy Policy 137, 1–11. doi: 10.1016/j.enpol.2019.111105
Wu, L., and Liu, W. (2018). Research on the efficiency and optimization of pro-poor tourism in ethnic areas of inner Mongolia. J. Guangxi Univ. Natl. 40, 15–21.
Xu, Z., and Chen, W. (2015). Study on technological innovation efficiency based on DEA-Malmquist: empirical analysis of 15 Chinese listed pharmaceutical manufacturing firms, in International Conference on Industrial Engineering and Engineering Management (IEEM) (Singapore: IEEE), 1504–1508. doi: 10.1109/IEEM.2015.7385898
Yan, H., Wang, Q., Xiong, H., and Xu, F. (2018). Research on the measurement of tourism poverty alleviation efficiency and its spatial-temporal evolution in Hainan's ethnic minority areas. China Soft Sci . 8, 63–76.
Yang, G., Yang, H., and Yang, X. (2018). Study on spatial and temporal performance of tourism poverty alleviation in three gorges reservoir area. Resour. Dev. Market 34, 868–872; 888. doi: 10.3969/j.issn.1005-8141.2018.06.021
Yang, G., Yang, H., Zhang, F., Chen, Y., and Wang, Y. (2020). Research on the time-space variation and influencing factors of tourism poverty alleviation efficiency in the three gorges reservoir area. Chin. J. Agric. Res. Reg. Plann. 41, 268–277. doi: 10.7621/cjarrp.1005-9121.20200532
Yang, J., and Shi, R. (2014). Comparison of the dynamic effects of financial support for the development of the tourism industry: taking Guizhou and Zhejiang as examples. Soc. Scient. 6, 88–92.
Yin, J., and Tan, Q. (2019). Study on urban efficiency measurement and spatiotemporal evolution of cities in Northwest China based on the DEA–malmquist model. Sustainability 11, 1–13. doi: 10.3390/su11020434
Zapata, M. J., Hall, C. M., Lindo, P., and Vanderschaeghe, M. (2011). Can community-based tourism contribute to development and poverty alleviation? Lessons from Nicaragua. Curr. Issues Tour. 14, 725–749. doi: 10.1080/13683500.2011.559200
Zhang, H., and Xiang, Y. (2016). Evaluating the performance of poverty alleviation through rural tourism in poor and ethnic areas: a case of Xiangxi. J. Hunan Univ. Arts Sci. 28, 16–20; 92. doi: 10.3969/j.issn.1672-6146.2016.04.005
Zhang, Q. (2019). Analysis of the coupling between rural tourism and precision poverty alleviation in Henan province. Chin. J. Agric. Resour. Reg. Plann. 40, 250–256. doi: 10.7621/cjarrp.1005-9121.20191132
Zhang, W., and Zhang, J. (2005). Comment on overseas studies of tourism and poverty elimination. Tour. Trib. 1, 90–96. doi: 10.3969/j.issn.1002-5006.2005.01.019
Zhang, W., Zhu, Q., and Li, H. (2013). Energy use, carbon emissions and my country's total factor carbon emission reduction efficiency. Econ. Res. J. 10, 138–150.
Zhao, C., Zhang, H., Zeng, Y., Li, F., Liu, Y., Qin, C., et al. (2018). Total-factor energy efficiency in BRI countries: an estimation based on three-stage DEA model. Sustainability 10:278. doi: 10.3390/su10010278
Zhao, H., Zhao, H., and Guo, S. (2018). Operational efficiency of Chinese provincial electricity grid enterprises:an evaluation employing a three-stage Data Envelopment Analysis (DEA) model. Sustainability 10, 31–68. doi: 10.3390/su10093168
Keywords: ethnic regions, tourism poverty alleviation efficiency, two-staged Data Envelopment Analysis, Malmquist index, tourism
Citation: Yang J, Wu Y, Wang J, Wan C and Wu Q (2021) A Study on the Efficiency of Tourism Poverty Alleviation in Ethnic Regions Based on the Staged DEA Model. Front. Psychol. 12:642966. doi: 10.3389/fpsyg.2021.642966
Received: 17 December 2020; Accepted: 04 March 2021; Published: 12 April 2021.
Reviewed by:
Copyright © 2021 Yang, Wu, Wang, Wan and Wu. This is an open-access article distributed under the terms of the Creative Commons Attribution License (CC BY) . The use, distribution or reproduction in other forums is permitted, provided the original author(s) and the copyright owner(s) are credited and that the original publication in this journal is cited, in accordance with accepted academic practice. No use, distribution or reproduction is permitted which does not comply with these terms.
*Correspondence: Chengcheng Wan, wan201701002@163.com
Disclaimer: All claims expressed in this article are solely those of the authors and do not necessarily represent those of their affiliated organizations, or those of the publisher, the editors and the reviewers. Any product that may be evaluated in this article or claim that may be made by its manufacturer is not guaranteed or endorsed by the publisher.
To read this content please select one of the options below:
Please note you do not have access to teaching notes, poverty and tourism decision-making: a chaordic perspective.
International Journal of Contemporary Hospitality Management
ISSN : 0959-6119
Article publication date: 20 December 2021
Issue publication date: 3 February 2022
The influence of destinations’ poverty on tourism decision-making and, more precisely, destination selection has received scant attention despite the increasing importance of poverty. The purpose of this study is to examine the combination of factors influencing tourists’ destination selection in relation to developed destinations’ rising poverty levels through the adoption of complexity theory.
Design/methodology/approach
This study used fuzzy-set qualitative comparative analysis to examine the combinations of factors that are significant in influencing destination selection whereas necessary condition analysis was used complementarily to evaluate the size effect of the examined conditions. Moreover, semi-structured interviews with industry stakeholders were performed to examine the relationships that describe the generated configurations.
In total, four solutions were generated: the cultural influence and poverty, the destination aspects, the poverty issues and the travel experience and poverty while qualitative data reveal that industry policymakers and practitioners hold different perceptions of tourists’ destination selection process.
Research limitations/implications
Study results show that poverty perceptions influence destination selection. Hence, poverty must be considered in travel behaviour investigations beyond the developing destination context, whereas destinations may select either one or a combination of the generated sufficient configurations when deciding on their tourism development plans.
Originality/value
To the best of the authors’ knowledge, this is the first study examining the effects of developed destinations’ increasing poverty levels on tourism decision-making and specifically on destination selection.
- Chaos and complexity
- Destination selection
- Decision-making
Farmaki, A. and Pappas, N. (2022), "Poverty and tourism decision-making: a chaordic perspective", International Journal of Contemporary Hospitality Management , Vol. 34 No. 3, pp. 1012-1036. https://doi.org/10.1108/IJCHM-07-2021-0859
Emerald Publishing Limited
Copyright © 2021, Emerald Publishing Limited
Related articles
We’re listening — tell us what you think, something didn’t work….
Report bugs here
All feedback is valuable
Please share your general feedback
Join us on our journey
Platform update page.
Visit emeraldpublishing.com/platformupdate to discover the latest news and updates
Questions & More Information
Answers to the most commonly asked questions here
UN Tourism | Bringing the world closer
Share this content.
- Share this article on facebook
- Share this article on twitter
- Share this article on linkedin
International tourism reached 97% of pre-pandemic levels in the first quarter of 2024
- All Regions
- 21 May 2024
International tourist arrivals reached 97% of pre-pandemic levels in the first quarter of 2024. According to UN Tourism, more than 285 million tourists travelled internationally in January-March, about 20% more than the first quarter of 2023, underscoring the sector’s near-complete recovery from the impacts of the pandemic.
In 2023 international tourist arrivals recovered 89% of 2019 levels and export revenues from tourism 96%, while direct tourism GDP reached the same levels as in 2019.
UN Tourism’s projection for 2024 points to a full recovery of international tourism with arrivals growing 2% above 2019 levels. In line with this, the newest data released by the UN specialized agency for tourism show that:
Yet it also recalls the need to ensure adequate tourism policies and destination management, aiming to advance sustainability and inclusion, while addressing the externalities and impact of the sector on resources and communities
- The Middle East saw the strongest relative growth, with international arrivals exceeding by 36% pre-pandemic levels in Q1 2024, or 4% above Q1 2023. This follows an extraordinary performance in 2023, when the Middle East became the first world region to recover pre-pandemic numbers (+22%).
- Europe , the world's largest destination region, exceeded pre-pandemic levels in a quarter for the first time (+1% from Q1 2019). The region recorded 120 million international tourists in the first three months of the year, backed by robust intra-regional demand.
- Africa welcomed 5% more arrivals in the first quarter of 2024 than in Q1 2019, and 13% more than in Q1 2023.
- The Americas practically recovered pre-pandemic numbers this first quarter, with arrivals reaching 99% of 2019 levels.
- International tourism is experiencing a rapid recovery in Asia and the Pacific where arrivals reached 82% of pre-pandemic levels in Q1 2024, after recovering 65% in the year 2023.
UN Tourism Secretary-General Zurab Pololikashvili said: "The recovery of the sector is very welcome news for our economies and the livelihoods of millions. Yet it also recalls the need to ensure adequate tourism policies and destination management, aiming to advance sustainability and inclusion, while addressing the externalities and impact of the sector on resources and communities".
By subregions, North Africa saw the strongest performance in Q1 2024 with 23% more international arrivals than before the pandemic, followed by Central America (+15%), the Caribbean and Western Europe (both +7%). Southern Mediterranean Europe exceeded pre-pandemic levels by 1%, while South America virtually reached 2019 levels. Northern Europe recovered 98% of pre-pandemic levels, while Subsaharan Africa and North America both recovered 95%.
According to available data, many destinations across the world continued to achieve strong results in Q1 2024, including Qatar (+177% versus Q1 2019), Albania (+121%), Saudi Arabia (+98%), El Salvador (+90%), Tanzania (+53%), Curaçao (+45%), Serbia (+43%), Turks and Caicos (+42%), Guatemala (+41%) and Bulgaria (+38%).
The robust performance of international tourism can also be seen in the UN Tourism Confidence Index which reached 130 points (on a scale of 0 to 200) for the period January-April, above the expectations (122) expressed for this period in mid-January.
International tourism receipts reached USD 1.5 trillion in 2023, meaning a complete recovery of pre-pandemic levels in nominal terms, but 97% in real terms, adjusting for inflation.
By regions, Europe generated the highest receipts in 2023, with destinations earning USD 660 billion, exceeding pre-pandemic levels by 7% in real terms. Receipts in the Middle East climbed 33% above 2019 levels. The Americas recovered 96% of its pre-pandemic earnings in 2023 and Africa 95%. Asia and the Pacific earned 78% of its pre-crisis receipts, a remarkable result when compared to its 65% recovery in arrivals last year.
Total export revenues from international tourism, including both receipts and passenger transport, reached USD 1.7 trillion in 2023, about 96% of pre-pandemic levels in real terms. Tourism direct GDP recovered pre-pandemic levels, reaching an estimated USD 3.3 trillion in 2023, equivalent to 3% of global GDP.
Several destinations achieved remarkable results in terms of receipts in the first quarter of 2024 as compared to 2019 levels based on available data, including Serbia (+127%), Türkiye (+82%), Pakistan (+72%), Tanzania (+62%), Portugal (+61%), Romania (+57%), Japan (+53%), Mongolia (+50%), Mauritius (+46%) and Morocco (+44%).
Looking ahead to a full recovery globally in 2024
International tourism is expected to recover completely in 2024 backed by strong demand, enhanced air connectivity and the continued recovery of China and other major Asian markets.
The latest UN Tourism Confidence Index shows positive prospects for the upcoming summer season, with a score of 130 for the period May-August 2024 (on a scale of 0 to 200), reflecting more upbeat sentiment than earlier this year. Some 62% of tourism experts participating in the Confidence survey expressed better (53%) or much better (9%) expectations for this 4-month period, covering the Northern Hemisphere summer season, while 31% foresee similar performance as in 2023.
Challenges remain
According to the UN Tourism Panel of Experts, economic and geopolitical headwinds continue to pose significant challenges to international tourism and confidence levels.
IMF's latest World Economic Outlook (April 2024) points to a steady but slow economic recovery, though mixed by region. At the same time, persisting inflation, high interest rates, volatile oil prices and disruptions to trade continue to translate into high transport and accommodations costs.
Tourists are expected to continue to seek value for money and travel closer to home in response to elevated prices and the overall economic challenges, while extreme temperatures and other weather events could impact the destination choice of many travellers. This is increasingly mentioned by the UN Tourism Panel of Experts as a concern for the sector.
Uncertainty derived from the Russian aggression against Ukraine, the Hamas-Israel conflict and other mounting geopolitical tensions, are also important downside risks for international tourism.
As international tourism continues to recover and expand, fuelling economic growth and employment around the world, governments will need to continue adapting and enhancing their management of tourism at the national and local level to ensure communities and residents are at the center of this development.
Related links
- Download News Release on PDF
- Excerpt | World Tourism Barometer - Volume 22 • Issue 2 • May 2024
Category tags
Related content, international tourism to reach pre-pandemic levels in 2024, international tourism to end 2023 close to 90% of pre-p..., tourism’s importance for growth highlighted in world ec..., international tourism swiftly overcoming pandemic downturn.
- News Releases
Tourism is Back to Pre-Pandemic Levels, but Challenges Remain
World Economic Forum, [email protected]
عربي | 日本語 | 中文 | Deutsch | Español | Français | Português
- High-income economies in Europe and Asia-Pacific continue to lead the World Economic Forum Travel and Tourism Index, with the United States, Spain and Japan topping the rankings again.
- Despite post-pandemic growth, the global tourism sector still faces complex challenges, with recovery varied by region; only marginal overall score improvements since the 2021 edition.
- Developing economies are making strides – who account for 52 out of 71 economies improving since 2019 – but significant investment is needed to bridge gaps and increase market share.
- Read the report here .
New York, USA, 21 May 2024 – International tourist arrivals and the travel and tourism sector’s contribution to global GDP are expected to return to pre-pandemic levels this year, driven by the lifting of COVID-19-related travel restrictions and strong pent-up demand, as per the new World Economic Forum travel and tourism study, released today.
Topping the 2024 list of economies are the United States, Spain, Japan, France and Australia. The Middle East had the highest recovery rates in international tourist arrivals (20% above the 2019 level), while Europe, Africa and the Americas all showed a strong recovery of around 90% in 2023.
These are some of the top findings of the Travel & Tourism Development Index 2024 (TTDI) , a biennial report published in collaboration with the University of Surrey, which analyses the travel and tourism sectors of 119 countries around a range of factors and policies.
“This year marks a turning point for the travel and tourism sector, which we know has the capacity to unlock growth and serve communities through economic and social transformation,” said Francisco Betti, Head of the Global Industries team at the World Economic Forum. “The TTDI offers a forward-looking window into the current and future state of travel and tourism for leaders to navigate the latest trends in this complex sector and sustainably unlock its potential for communities and countries across the world.”
Post-pandemic recovery
The global tourism industry is expected to recover from the lows of the COVID-19 pandemic and surpass the levels seen before the crisis. This is largely being driven by a significant increase in demand worldwide, which has coincided with more available flights, better international openness, and increased interest and investment in natural and cultural attractions.
However, the global recovery has been mixed. While 71 of the 119 ranked economies increased their scores since 2019, the average index score is just 0.7% above pre-pandemic levels.
Although the sector has moved past the shock of the global health crisis, it continues to deal with other external challenges, from growing macroeconomic, geopolitical and environmental risks, to increased scrutiny of its sustainability practices and the impact of new digital technologies, such as big data and artificial intelligence. In addition, labour shortages are ongoing, and air route capacity, capital investment, productivity and other sector supply factors have not kept up with the increase in demand. This imbalance, worsened by global inflation, has increased prices and service issues.
TTDI 2024 highlights Out of the top 30 index scorers in 2024, 26 are high-income economies, 19 are based in Europe, seven are in Asia-Pacific, three are in the Americas and one (the United Arab Emirates) is in the Middle East and North Africa region (MENA). The top 10 countries in the 2024 edition are the United States, Spain, Japan, France, Australia, Germany, the United Kingdom, China, Italy and Switzerland.
The results highlight that high-income economies generally continue to have more favourable conditions for travel and tourism development. This is helped by conducive business environments, dynamic labour markets, open travel policies, strong transport and tourism infrastructure, and well-developed natural, cultural and non-leisure attractions.
Nevertheless, developing countries have seen some of the greatest improvements in recent years. Among the upper-middle-income economies, China has cemented its ranking in the top 10; major emerging travel and tourism destinations of Indonesia, Brazil and Türkiye have joined China in the top quartile of the rankings. More broadly, low- to upper-middle-income economies account for over 70% of countries that have improved their scores since 2019, while MENA and sub-Saharan Africa are among the most improved regions. Saudi Arabia and the UAE are the only high-income economies to rank among the top 10 most improved economies between 2019 and 2024.
Despite these strides, the TTDI warns that significant investment is needed to close gaps in enabling conditions and market share between developing and high-income countries. One possible pathway to help achieve this would be sustainably leveraging natural and cultural assets – which are less correlated with country income level than other factors – and can offer developing economies an opportunity for tourism-led economic development.
“It’s essential to bridge the divide between differing economies’ ability to build a strong environment for their travel and tourism sector to thrive,” said Iis Tussyadiah, Professor and Head of the School of Hospitality and Tourism Management at the University of Surrey. “The sector has big potential to foster prosperity and mitigate global risks, but that potential can only be fully realized through a strategic and inclusive approach.”

Mitigating future global challenges
According to the World Economic Forum’s 2024 Global Risks Report, the travel and tourism sector faces various complex risks , including geopolitical uncertainties, economic fluctuations, inflation and extreme weather. Balancing growth with sustainability also remains a major problem, due to high seasonality, overcrowding, and a likely return of pre-pandemic emissions levels. The report also analyses persistent concerns about equity and inclusion. While the tourism sector offers a major source of relatively high-wage jobs, particularly in developing countries, gender parity remains a major issue for regions such as MENA and South Asia.
Despite these challenges, the sector can play a significant role in addressing them. To achieve this, decision-makers should prioritize actions such as leveraging tourism for nature conservation efforts; investing in skilled, inclusive and resilient workforces; strategically managing visitor behaviour and infrastructure development; encouraging cultural exchange between visitors and local communities; and using the sector to bridge the digital divide, among other policies.
If managed strategically, the travel and tourism sector – which has historically represented 10% of global GDP and employment – has the potential to emerge as a key contributor to the well-being and prosperity of communities worldwide.
About the Travel and Tourism Development Index 2024
The 2024 edition of the TTDI includes several improvements based on newly available data and recently developed indicators on the environmental and social impact of travel and tourism. The changes made to the 2024 Index limit its comparability to the previously published TTDI 2021. This year's report includes recalculated 2019 and 2021 results, using new adjustments. TTDI 2024 reflects the latest available data at the time of collection – end of 2023. The TTDI is part of the Forum’s broader work with industry communities actively working to build a better future enabled by sustainable, inclusive, and resilient industry ecosystems.
Notes to editors
Read the Forum Agenda also in Spanish | Mandarin | Japanese Learn about the Forum’s impact Check out the Forum’s Strategic Intelligence Platform and Transformation Maps Follow the Forum on social media: @wef | Instagram | LinkedIn | Facebook | TikTok | Weibo | Threads | WhatsApp Watch Forum videos at wef.ch/videos | YouTube Get Forum podcasts at wef.ch/podcasts | YouTube Subscribe to Forum news releases
We've detected unusual activity from your computer network
To continue, please click the box below to let us know you're not a robot.
Why did this happen?
Please make sure your browser supports JavaScript and cookies and that you are not blocking them from loading. For more information you can review our Terms of Service and Cookie Policy .
For inquiries related to this message please contact our support team and provide the reference ID below.
The Gambia Economic Update 2024: Jumpstarting inclusive and sustained growth

STORY HIGHLIGHTS
- The Gambia’s economic activity increased in 2023 amid continued global challenges. Following its democratic transition, The Gambia recorded resilient growth amid a sequence of global shocks, suggesting that the country can grow faster.
- Pressure from imports led to persistent deteriorations in the external sector accounts, although the current account deficit (CAD) is stabilized.
- Poverty is mainly a rural phenomenon, with 7 out of 10 people being poor in rural areas compared to 3 out of 10 people in urban areas. Underemployment is high at 41.5% in 2022, while 63% of employment are informal.
The Gambia’s economic activity increased in 2023 amid continued global challenges. Real GDP increased by 5.3% in 2023 (2.7% in per capita terms), from 4.9% (2.4% in per capita terms) in 2022. On the supply side, growth was mainly supported by improved agricultural and industrial production. The increase in agricultural growth was primarily attributed to a good rainy season and improved agricultural practices with the use of improved seeds and increased fertilizer subsidies, alongside an increase in investment in projects by international partners.
The fiscal deficit decreased while remaining high in 2023 as increased tax collection and higher levels of grants failed to fully offset the rising expenditure. Supported by continued economic recovery and the implementation of revenue boosting measures, total revenue increased from 17.7% of GDP in 2022 to 20.6% of GDP in 2023. Tax revenue rose by 0.5 ppts of GDP in 2023 thanks to new administrative measures and strengthened collection efforts.
Economic outlook
The macroeconomic outlook foresees consolidation of the recovery in the medium term supported by the implementation of the Recovery-Focused National Development Plan (RF-NDP) 2023–2027 but it hinges on a continuous commitment to macro-fiscal stability. Real GDP growth is projected to strengthen to around 5.6% in 2024–26 (3.2 in% per capita terms), driven by increased activity across the economy. Agriculture is expected to continue to grow, assuming favorable rainfall alongside with an efficient use of fertilizers, continued seeds improvements and support from development partners. Industry growth will be boosted by ongoing large infrastructure projects, sustained public and private construction, and improvements in the business environment. Services are expected to continue to grow assuming higher tourist arrivals as global economic recovery and trade resume while regional and global geopolitical tensions tame.
Jumpstarting inclusive and sustained growth
From the long-term perspective, the pace of economic growth has been declining and volatile since independence. From an average of 5.7% over 1968–1978, the average Real GDP growth gradually fell to 3.0% over 1979–2016 (Figure 1), due to the occurrence of climate events such as droughts, limited accumulation of capital (human and physic), reliance on low value-added tourism, weak governance and weak economic mismanagement and investment climate combined with poor infrastructure, which resulted in declining enterprises’ (SOEs) contingent liabilities, continued rise in the government’s credit cost, weaker than expected grants, end-of-debt service deferrals in 2024, and other external price shocks.
To promote sustained and inclusive growth, the authorities will need to transform the growth model from reliance on low value-added tourism to a dynamic private sector that offers more economic opportunities to all Gambians, especially the youths . To this end, they will need to implement policies that aim to strengthen macroeconomic stabilization and fast-tracking structural reforms needed to support productivity and initiate transformative structural change.
The Economic Update monitors significant recent economic developments in the country, it reflects a mix of steady growth and persistent challenges, highlighting the key structural challenges The Gambia faces whilst highlighting its sluggish progress in its pursuit of inclusive and sustained growth. This 2024 edition – Jumpstarting inclusive and sustained growth - presents a comprehensive overview of the state of the economy, recovery in the Tourism sector, and provides policy options for laying the foundation for higher and more inclusive growth. Download the report here .
This site uses cookies to optimize functionality and give you the best possible experience. If you continue to navigate this website beyond this page, cookies will be placed on your browser. To learn more about cookies, click here .
Plan Your Lyubertsy Holiday: Best of Lyubertsy

Explore Lyubertsy
Essential lyubertsy.

Lyubertsy Is Great For
Eat & drink.

- Skip to main content
- Keyboard shortcuts for audio player
Nelson Mandela's party could lose their absolute majority in South Africa
Emmanuel Akinwotu
Nelson Mandela's party is poised to lose their absolute majority in South Africa
Will South Africa's African National Congress party, Africa's oldest liberation movement, finally lose it's absolute majority in the up and coming election?
Copyright © 2024 NPR. All rights reserved. Visit our website terms of use and permissions pages at www.npr.org for further information.
NPR transcripts are created on a rush deadline by an NPR contractor. This text may not be in its final form and may be updated or revised in the future. Accuracy and availability may vary. The authoritative record of NPR’s programming is the audio record.

- Skip to main content
- Skip to main navigation
- Skip to site search
- Skip to side bar
- Skip to footer
BC Gov News
- News Archive
- Live Webcast
- Office of the Premier
- Agriculture and Food
- Attorney General
- Children and Family Development
- Citizens' Services
Education and Child Care
- Emergency Management and Climate Readiness
- Energy, Mines and Low Carbon Innovation
- Environment and Climate Change Strategy
- Indigenous Relations and Reconciliation
- Intergovernmental Relations Secretariat
- Jobs, Economic Development and Innovation
- Mental Health and Addictions
- Municipal Affairs
- Post-Secondary Education and Future Skills
- Public Safety and Solicitor General
- Social Development and Poverty Reduction
- Tourism, Arts, Culture and Sport
- Transportation and Infrastructure
- Water, Land and Resource Stewardship
New Building Permit Hub launched to speed up homebuilding

Hydrogen project will create jobs, fuel B.C.’s clean economy, reduce emissions
More from the premier.
- Factsheets & Opinion Editorials
- Search News
- Premier's Bio
Indigenous program strengthens long-term rural food supply
Canada, b.c. increasing food chain transparency, more from this ministry.
- Minister's Bio
Joint statement on Asian Heritage Month

Premier’s, minister’s, parliamentary secretary’s statements on Jewish Heritage Month
Expanded eligibility, new supports available for current, former youth in care.

B.C. strengthens Indigenous jurisdiction in child, family services
High-speed internet coming to more northern b.c. communities, planning begins for new langford secondary school.

More classrooms for elementary students coming to Surrey
Grand forks getting better flood protection.

Federal and provincial governments shore up flood defences in Richmond

Canada, B.C. support First Nations to power up new clean-energy projects
Stronger enforcement options will stop illegal activities in b.c. parks, new tool empowers citizens during environmental assessments, more supports coming for women, children facing domestic violence, exploitation, major barrier to first nation land registration eliminated, new tools will help people prepare, stay informed during emergencies.

B.C. provides update on old-growth conservation
Province transformed ambulance system, record number of people supported.

Program gets on the road again to help promote safety
Hundreds more affordable homes coming to metro vancouver, historic haida aboriginal title legislation receives royal assent, throne speech lays out vision of a stronger b.c. that works better for people.

Applications open for French-language services funding
B.c. takes action to strengthen northern rural communities, b.c. bolsters advanced wood manufacturing in kamloops, 2024 minimum wage increases confirmed, federal, provincial and territorial labour ministers discuss key challenges facing workers in canada, young people in east kootenays benefit from more mental-health, addiction care.

Minister’s statement on lives lost to poisoned drugs in March
Bc growing communities fund supports five city of chilliwack projects, lion’s park washroom project completion, new legislation recognizes work of first nations post-secondary institutes.

TradeUpBC builds, enhances tradespeoples’ skills
Innovative replacement correctional centre now open in nanaimo, communities benefit from support for crime prevention, victim services, budget 2024 supports improvements to treatment, recovery services.

Changes aim to help people out of poverty
Province provides updates for fifa world cup 26.

Province moves ahead on a safer amateur sport system
Two major infrastructure projects reach milestones.
 viewed from the South (Surrey) side.")
Wildlife overpass will enhance safety for drivers, bighorn sheep
Supporting early childhood educators strengthens child care.
Honourable Rachna Singh
Email: [email protected]
Updated on May 24, 2024
Translations, news release communiqué, media contacts, soraya lemur.
- Ministry Website
- Ministry Photos
- Ministry Videos
Featured Topics
- Indigenous-focused Graduation Requirements
- Child Care in B.C.
- Vision for Student Success
- B.C.'s Redesigned Curriculum
- Reporting on Student Success
Featured Services
- Student Transcripts Service
- erase = expect respect & a safe education
- Certificates of Graduation
- Teacher Certification
- Scholarships, Grants, Awards & Bursaries
- StrongStart BC
Additional funding for early childhood educators (ECE) is helping recruit and retain staff in the child care sector, leading to a more supported workforce and better outcomes for children and families.
“When child care professionals feel supported, children and their families are also better supported and we are all better off,” said Mitzi Dean, B.C. Minister of State for Child Care. “We know there is no child care without the dedicated and skilled professionals who provide that care. These provincial and federal investments, which include post-secondary bursaries, peer mentoring and other professional-development opportunities, are some of the ways we are recognizing them.”
ECE students, including those just beginning their educational journey and those already working in the field and upgrading their credentials, will benefit from an additional $45 million for the ECE Education Support Fund. The fund, managed by Early Childhood Educators of BC (ECEBC), provides as much as $5,000 per semester for eligible ECE students.
“Early childhood educators are at the heart of the early learning and child care system,” said Jenna Sudds, federal Minister of Families, Children and Social Development. “Today’s announcement is a meaningful step in recogonizing their essential work and ensuring they have the support they need throughout their studies and careers, while growing an affordable, high-quality child care system for families in British Columbia.”
Approximately $11 million in additional funding for new and ongoing professional learning opportunities is being provided for programs, such as the ECE Peer Mentoring program and the Early Years Professional Development Bursary program. Three organizations are working with the government to provide the programs to support child care professionals, and in doing so, give families peace of mind that their children are receiving the highest level of care.
“The ECE Peer Mentoring program has allowed me to remain in the field that I love when I was burned out and ready to leave,” said Tammy Jackson, ECE. “It provided me with the encouragement, professional development, tools and support to thrive in my profession rather than just survive. It is my belief that the program not only positively impacts the educators involved, but it has a positive impact on the children and families we work with.”
As part of ChildCareBC, the Province is investing in ECEs and child care professionals to ensure the child care sector can expand and grow to meet the needs of families in B.C. Increasing recruitment and retention of ECEs and child care professionals is a shared priority between the Province and the federal government.
The ECE Education Support Fund is supported by provincial investments and federal funding under the 2021-22 to 2025-26 Canada-British Columbia-Canada-wide Early Learning and Child Care Agreement.
Emily Mlieczko, executive director, ECEBC –
“Early childhood educators are the foundation of a robust early years system. Each investment in this profession continues to support this dedicated sector and is welcomed. ECEBC informs and advocates for continued enhancements and investments.”
Laura Doan, associate professor at Thompson Rivers University and founder of the Peer Mentoring program –
“Peer Mentoring communities of practice serve as a place where educators find mutual support, respect and care. It is a safe enough place for educators to be able to ask questions, share ideas, advocate, listen, provoke and grow. Our research has shown that educators who take part in the program have an increase in confidence, leadership, development, learning and professional identity, and are sustained so they are able to continue in their chosen field and avoid burnout.”
Shari Rockliff, ECE –
“In our community of practice, when someone in the group feels defeat, another will provide them with support that rebuilds hope. When change is needed within the child care sector, our voices are heard across the province. The strength of this peer-mentor group is truly influential.”
Quick Facts:
- The overall number of ECEs has increased by approximately 4,000 from 10,400 in 2018-19 to 14,400 in 2023-24.
- The number of active ECE certificates has been trending upward, increasing by 11% since the end of 2023-24 fiscal year.
- More than 13,000 eligible ECEs per month receive a wage enhancement of as much as $6 per hour.
- In January 2024, the Province introduced the new ECE specialized certification grant, which provides eligible ECEs an annual grant of $2,000 or $3,000 based on their specialized certification.
- The Government of Canada made a transformative investment of more than $27 billion over five years as part of Budget 2021 to build a Canada-wide early learning and child care (ELCC) system with provinces and territories (PTs), including to increase the quality of ELCC through valuing the early childhood workforce and providing it with training opportunities.
- In addition, the Government of Canada provided $420 million in 2021-22 for PTs to support the recruitment and retention of ECEs, in recognition of the workforce’s central role in providing high-quality ELCC.
Learn More:
To find out more about becoming an ECE, visit: https://www2.gov.bc.ca/gov/content/education-training/early-learning/teach/training-and-professional-development/become-an-early-childhood-educator
To learn more about the Early Care and Learning Recruitment and Retention strategy, visit: https://www2.gov.bc.ca/gov/content/family-social-supports/caring-for-young-children/recruitment-retention-strategy
A backgrounder follows.
Backgrounders
What to know about supports for eces and child care professionals.
Early childhood educators and child care professionals are benefiting from approximately $56 million in new and additional investments for the following programs:
Post-secondary support:
- Education Support Fund managed through Early Childhood Educators of BC (ECEBC) - $45 million over three years
Professional learning:
- Administration and Management in Child Care managed by Westcoast Family Centres Society - $600,000 over three years
- Early Childhood Educator (ECE) Peer Mentoring program managed by ECEBC - $2.1 million over three years
- Early Childhood Pedagogy program managed by University of Western Ontario’s Early Childhood Pedagogy Network - $2.4 million
- Early Years Professional Development (EYPD) Bursary program managed by Westcoast Family Centres Society - $4.5 million over three years
- EYPD hub managed by ECEBC on behalf of the EYPD hub partnership - $67,000
- Learning Outside Together program managed by ECEBC - $900,000 over three years
- Let’s Talk About Touching program managed by ECEBC - $350,000 over three years
- SupportingECEs_Chinese(simplified).pdf
- SupportingECEs_Chinese(traditional).pdf
- SupportingECEs_French.pdf
- SupportingECEs_Punjabi.pdf
Related Articles
More student spaces coming to west kelowna.

Connect with the Ministry
View the Ministry's latest photos on Flickr.
Watch the Ministry's latest videos on YouTube.
Acknowledgment
The B.C. Public Service acknowledges the territories of First Nations around B.C. and is grateful to carry out our work on these lands. We acknowledge the rights, interests, priorities, and concerns of all Indigenous Peoples - First Nations, Métis, and Inuit - respecting and acknowledging their distinct cultures, histories, rights, laws, and governments.
Connect with Us:
- Newsletters
- Accessibility
Current time by city
For example, New York
Current time by country
For example, Japan
Time difference
For example, London
For example, Dubai
Coordinates
For example, Hong Kong
For example, Delhi
For example, Sydney
Geographic coordinates of Elektrostal, Moscow Oblast, Russia
City coordinates
Coordinates of Elektrostal in decimal degrees
Coordinates of elektrostal in degrees and decimal minutes, utm coordinates of elektrostal, geographic coordinate systems.
WGS 84 coordinate reference system is the latest revision of the World Geodetic System, which is used in mapping and navigation, including GPS satellite navigation system (the Global Positioning System).
Geographic coordinates (latitude and longitude) define a position on the Earth’s surface. Coordinates are angular units. The canonical form of latitude and longitude representation uses degrees (°), minutes (′), and seconds (″). GPS systems widely use coordinates in degrees and decimal minutes, or in decimal degrees.
Latitude varies from −90° to 90°. The latitude of the Equator is 0°; the latitude of the South Pole is −90°; the latitude of the North Pole is 90°. Positive latitude values correspond to the geographic locations north of the Equator (abbrev. N). Negative latitude values correspond to the geographic locations south of the Equator (abbrev. S).
Longitude is counted from the prime meridian ( IERS Reference Meridian for WGS 84) and varies from −180° to 180°. Positive longitude values correspond to the geographic locations east of the prime meridian (abbrev. E). Negative longitude values correspond to the geographic locations west of the prime meridian (abbrev. W).
UTM or Universal Transverse Mercator coordinate system divides the Earth’s surface into 60 longitudinal zones. The coordinates of a location within each zone are defined as a planar coordinate pair related to the intersection of the equator and the zone’s central meridian, and measured in meters.
Elevation above sea level is a measure of a geographic location’s height. We are using the global digital elevation model GTOPO30 .
Elektrostal , Moscow Oblast, Russia
IMAGES
VIDEO
COMMENTS
Slum tourism sparks considerable debate around an uncomfortable moral dilemma. No matter what you call it—slum tours, reality tours, adventure tourism, poverty tourism—many consider the ...
Tourism and Poverty Alleviation. One of the cornerstones of sustainable tourism - ecological, social and economic - to which WTO is committed, is the well being of poor communities and their environment. Tourism can play a significant part in balanced sustainable development and generate benefits for the poor. The World Tourism Organization ...
Additionally, tourism-led economic growth has been implicitly assumed to be inclusive of the poor and may even be pro-poor, while as a derivative of the tourism-led economic growth hypothesis, tourism expansion has also been linked to poverty alleviation, particularly for the less developed countries and regions (e.g., Ashley and Mitchell 2009; Croes and Vanegas 2008; Hall 2007; Hawkins and ...
2. Literature review. Tourism is regarded as a source of development and poverty eradication through employment generation, technology transfer and GDP growth (Simms, Citation 2005).Previous studies have shown that tourism development translates to poverty reduction through a number of channels, such as income, tax, price and risk (McCulloch et al., Citation 2001; Blake et al., Citation 2008 ...
Tourism and Poverty Alleviation. Author: WTO. Published: 2002 Pages: 115. eISBN: 978-92-844-0549-7. Abstract: One of the cornerstones of sustainable tourism - ecological, social and economic - to which WTO is committed, is the well being of poor communities and their environment. Tourism can play a significant part in balanced sustainable ...
Yet tourism research on poverty to date largely focuses on the income-based poverty analysis and does not fully consider the multidimensional nature of poverty or the views of poor people. Applying the capability approach, this paper examines the opportunities provided by tourism development and their contribution to achieving well-being from ...
Abstract. While tourism can be advocated as a means for poverty reduction, the inconclusive issue of poverty in developing countries has harbored doubts about the efficacy of tourism development in its reduction. This study empirically examines whether institutions influence how tourism development affects poverty.
alleviate poverty, especially in developing countries. The type of tourism focused on poverty alleviation is commonly referred to as 'pro-poor tourism'. The purpose of this research is to show how pro-poor tourism can be used to maintain the environmental and cultural values of a destination while improving its economic stability. The ...
With the aim of contributing to the understanding of tourism as a tool for poverty alleviation and sustainable development, UNWTO jointly with SNV has produced this publication, which outlines some practical steps that can be taken in tourism destinations to shape and manage tourism in ways which deliver more benefits to disadvantaged individuals and communities.
A review of papers within the Journal of Sustainable Tourism's special issue on tourism and poverty reduction follows and four main themes are explored: development agency strategies and approaches, governance and biodiversity conservation, the assessment of tourism impacts and value chain analysis and inter-sectoral linkages. Key potential ...
Despite the importance of tourism for poverty relief, limited studies have investigated the relationship between tourism development and multidimensional poverty reduction. The present work investigated the tourism-poverty nexus from the perspective of multidimensional poverty (including poverty related to economic, education, health care and social welfare dimensions) on the basis of a ...
The empirical analysis indicates that tourism has a positive effect on poverty reduction and the concomitant inequality in the distribution of income among the poor could weaken the poverty reduction effect of tourism. China's western provinces confirm a stronger relationship between tourism and poverty reduction, although the effect of ...
This paper contributes to the academic writing on the relationship between tourism and. poverty alleviation, which still remains "terra incognita" among tour ism academics. (Zeng & Ryan, 2012 ...
Mahadevan et al. (2017) nd that while increased tourism leads. to a reduction in poverty, it also increases income inequality in both urban and. rural regions in Indonesia: the greater the ...
Tourism poverty alleviation in ethnic areas needs to seize the opportunity of the central government's implementation of the digital rural strategy, make full use of the advantages of new ideas, new technologies, and new industries, combine with poverty alleviation work, boldly explore and innovate the "big data + tourism" poverty ...
Purpose. The influence of destinations' poverty on tourism decision-making and, more precisely, destination selection has received scant attention despite the increasing importance of poverty. The purpose of this study is to examine the combination of factors influencing tourists' destination selection in relation to developed destinations ...
21 May 2024. International tourist arrivals reached 97% of pre-pandemic levels in the first quarter of 2024. According to UN Tourism, more than 285 million tourists travelled internationally in January-March, about 20% more than the first quarter of 2023, underscoring the sector's near-complete recovery from the impacts of the pandemic. In ...
International tourist arrivals and the travel and tourism sector's contribution to global GDP are expected to return to pre-pandemic levels this year, driven by the lifting of COVID-19-related travel restrictions and strong pent-up demand, as per the new World Economic Forum travel and tourism study, released today. Topping the 2024 list of economies are the United States, Spain, Japan ...
Tourism poverty alleviation relies mainly on government aid, which increases pressure on government and government finances in many developing countries (Butler et al., 2013). Insufficient financial resources and/or a lack of incentives among different government branches to coordinate make designing and implementing pro-poor tourism in ...
The Dominican Republic is having a moment. Ten million tourists a year are flocking to its beaches, helping drive one of the region's best performing economies. Poverty is near a record low, and ...
This 2024 edition - Jumpstarting inclusive and sustained growth - presents a comprehensive overview of the state of the economy, recovery in the Tourism sector, and provides policy options for laying the foundation for higher and more inclusive growth. Download the report here. The Gambia's economic activity increased in 2023 amid continued ...
Tourism and poverty alleviation, according to Scheyvens Citation (2007), are increasingly being linked. This is echoed in most developing countries' policy documents concerning economic growth - where tourism is seen as a tool for addressing poverty. According to a WTO report on the economic benefits of tourism, there are a number of ways to ...
Moscow Oblast (Russian: Московская область, romanized: Moskovskaya oblast, IPA: [mɐˈskofskəjə ˈobləsʲtʲ], informally known as Подмосковье, Podmoskovye, IPA: [pədmɐˈskovʲjə]) is a federal subject of Russia (an oblast).With a population of 8,524,665 (2021 Census) living in an area of 44,300 square kilometers (17,100 sq mi), it is one of the most densely ...
Lyubertsy Tourism: Tripadvisor has 1,952 reviews of Lyubertsy Hotels, Attractions, and Restaurants making it your best Lyubertsy resource.
AYESHA RASCOE, HOST: We now turn to South Africa, where the African National Congress, or ANC, the party of Nelson Mandela and Africa's oldest liberation movement, faces its biggest test at the ...
Elektrostal. Elektrostal ( Russian: Электроста́ль) is a city in Moscow Oblast, Russia. It is 58 kilometers (36 mi) east of Moscow. As of 2010, 155,196 people lived there.
Since poverty is a global problem and poverty alleviation attracts worldwide attention, especially in developing countries, many scholars associate it with economic growth and diversification of poverty alleviation measures such as government spending and transfers, infrastructure development, and agricultural technology upgrading (Leng et al., 2021).
What to know about supports for ECEs and child care professionals. Early childhood educators and child care professionals are benefiting from approximately $56 million in new and additional investments for the following programs: Post-secondary support: Education Support Fund managed through Early Childhood Educators of BC (ECEBC) - $45 million ...
Geographic coordinates of Elektrostal, Moscow Oblast, Russia in WGS 84 coordinate system which is a standard in cartography, geodesy, and navigation, including Global Positioning System (GPS). Latitude of Elektrostal, longitude of Elektrostal, elevation above sea level of Elektrostal.