
The Statistics Of Indian Tourism Sector Between 2016 And 2017
- November 1, 2017
- India Tourist Office
- India Tourist Office , Numbers
The Indian tourism sector and hospitality industry have been driving economic growth in the nation. The rich culture and historical heritage of India, in addition to ecological variety and places of natural beauty, increase the tourism potential of the country. The tourism and hospitality sector has emerged as a large source of employment besides being a foreign exchange source for the country.
In 2016, the travel and tourism industry contributed $208.9 billion to the nation’s GDP. This accounted for about 9.6 percent of the nation’s total GDP in the year under view. The contribution of tourism to India’s GDP was the highest recorded in the entire Asia-Pacific? A figure that places them just behind China. The contribution of travel and tourism was twice that of Thailand, which came third on the list. The sector also provided more than 25.4 million jobs directly in 2016.
Tourists exploring the length and breadth of India have benefited from the decrease in accommodation prices witnessed in recent years. The average daily rate of hotels (ADR) dropped to an all-time low in 2016? The lowest recorded in a decade. The occupancy rate of the hotel industry, on the other hand, has remained fairly stable during that time.
The Size Of The Tourism Market In India
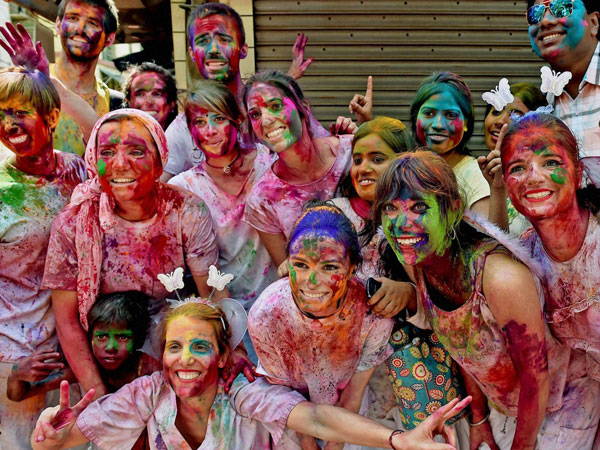
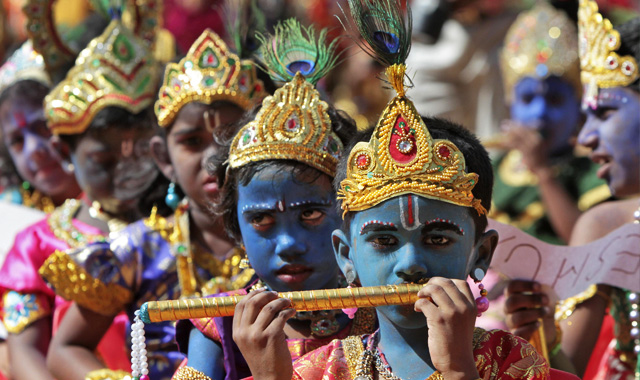
Foreign Tourist In Indian Festivals
As tourists continue to discover unexplored locations , inbound tourism continues to grow {NOTE TO DEVELOPER: Kindly link “unexplored locations” to the article “#2. Unexplored Places That Will Make the Best Vacation Location”} . 2016 was a merry year for the tourism sector in India. States/Union Territories (UTs) witnessed a growth in Domestic Tourist Visits (DTVs) of 15.5 percent year-on-year to 1.65 billion.
The data released by the Ministry of Tourism shows that the foreign tourist arrivals (FTAs) in India leaped 19.5 percent year-on-year to 630,000 as of May 2017. There was also a leap in FTA’s e-tourist visa by 55.3 percent year-on-year to 68,000 as of May 2017. These impacted on India’s Foreign Exchange Earnings (FEEs) by driving it up by 32 percent year-on-year to $2.278 billion in April 2017.
If the statistics continue to rise, India is projected to move up by five places to become one of the top five business travel markets globally by the year 2030. There is also an expectation that business travel spending will treble by 2030 from $30 billion recorded in 2015.
The Role Of The Government In The Growth Of India’s Tourism Sector
- A plan by the Ministry of Environment, Forest and Climate Change to revise the coastal regulations of India, with the aim of opening 7,500km of the country’s coastline for developmental activities.
- A move by the Central Government to ensure a smooth transition to a cashless mode of payment. This is to ensure that tourists have hitch-free transactions as well as remain immune to the government’s demonetization drive.
The potential of India’s travel and tourism sector is huge and with the tourism sector looking forward to expanding its e-visa scheme, the hardship faced by tourists? Which often deter them from traveling to the country? Will be erased. This will further push up the number of inbound tourists.

8 Indian Cultures Every Tourist Would Love To Experience
A trip to India can change your life dramatically . From struggling to get your…
Indian Festivals You Should Plan To Attend
Attending Indian festivals will acquaint you with the colorful culture and traditions of the country.…

Travelling To India: Ways To Get Your Documentation Right
First-time travelers are always skeptical about which documents to carry and which ones to leave…
Leave a Reply Cancel comment reply
Your email address will not be published. Required fields are marked *
- previous post: Unexplored Places That Will Make The Best Vacation Location
- next post: Travelling To India: Ways To Get Your Documentation Right
- Terms and Conditions
- Cookies Policy
- Privacy Policy
International tourism, number of arrivals - India

Selected Countries and Economies
All countries and economies.
- Privacy Notice
- Access to Information
This site uses cookies to optimize functionality and give you the best possible experience. If you continue to navigate this website beyond this page, cookies will be placed on your browser. To learn more about cookies, click here.
From India to the world: Unleashing the potential of India’s tourists
Boosted by rising economic prosperity and a fast-growing economy, India is set to be an important global source market for leisure travel. India is now the fifth-largest economy, and its population has surpassed China’s to become the largest in the world, at over 1.4 billion people. 1 World Bank national accounts data, GDP (current US$) India, accessed September 2023; World population prospects 2022 , United Nations Department of Economic and Social Affairs, Population Division, 2022. And the population is young—the median age is 27.6, more than ten years younger than that of most major economies. 2 World population prospects 2022 . What's more, consumption of goods and services, including leisure and recreation, is forecast to double by 2030. 3 “India’s impending economic boom,” Morgan Stanley, November 8, 2022. Adding a strong postpandemic travel recovery, and a growing appetite for international travel, these factors point to India’s significant potential for outbound tourism.
India is now the fifth-largest economy, and its population has surpassed China’s to become the largest in the world, at over 1.4 billion people.
Through nine charts, this article unpacks trends and opportunities in the Indian travel market. Selected country examples shed light on how destinations can enhance their value propositions to attract and delight Indian travelers.
Indian globetrotters set to soar
Racing ahead: indian wanderlust is taking off, top picks: united arab emirates reigns, new gems discovered, regional flavors; global explorers.
Indian travelers are not a homogenous group; destination preferences vary across regions. For example, travelers from North India constitute a large share of travel to the United States and Canada, while two-thirds of travelers from Kerala prefer destinations in the Middle East. 1 India tourism statistics 2020 , Ministry of Tourism, Government of India, January 2021; MarketIS. Purpose of travel, distribution of the diaspora, and cultural linkages play a role in destination choice.

McKinsey Live event: Faces, places, and trends: The state of tourism & hospitality
Thursday, June 13 at 10:30 a.m EDT / 4:30 p.m CET
Destination matchmaking: Five ways to build value
Destinations looking to harness the full potential of the growing Indian market could consider tailoring their value propositions in alignment with one or more of the five key decision points that influence where travelers choose to go. Destinations might ask the following questions to determine which factors align with what Indian travelers look for when planning a trip.
- Research. How attractive and popular is the destination with Indian tourists?
- Accessibility. Is it easy to obtain a travel visa?
- Connectivity. Are there convenient flights that connect India to the destination?
- Booking. Is the destination affordable for Indian travelers, and is there an adequate supply of hotels in the appropriate price range?
- Travel experience. What is the on-the-ground experience like for Indian tourists in terms of weather, attractions, and whether or not the local population is English speaking?
There’s something for everyone in Thailand
Azerbaijan’s visa policy wows indian travelers, vietnam takes off: direct flights skyrocket arrivals.
In 2019, Kolkata was the only city in India with direct connectivity to Vietnam, and three other Indian cities offered sporadic flights. To stand out from Southeast Asia neighbors and gain popularity with Indian travelers, Vietnam improved direct connectivity from India by increasing flight frequency and adding new routes. Indian arrivals are now at an all-time high. 1 Data from Google trends and Diio Mi.
The luxury of Dubai is within reach
In 2022, India was the largest source market for leisure travelers to Dubai. 1 “1.24 million Indian tourists visit Dubai in first 9 months of 2022,” Business Standard , December 10, 2022. The city is known for its luxury offerings and, perhaps surprisingly, also offers a wide range of accommodations, such as 3-star options. And flights from India are affordable when compared with flights of similar distances. Taken together, these factors make the luxury of Dubai accessible to Indian travelers. 2 MarketIS.
Bollywood magic in Switzerland
While only 9 percent of Indian travelers focus on long-haul destinations in Western Europe, Switzerland has been an Indian top-20 destination for over a decade. Switzerland may be popular, as it feels familiar to Indian travelers: many Bollywood hits feature Swiss attractions, there are plenty of Indian restaurants and cultural festivals, and English is widely spoken. 1 “Switzerland and romantic songs of Indian movies,” Solo Backpacker, September 20, 2019; India-Switzerland relations , Ministry of External Affairs, Government of India, February, 2020; Festival of India in Switzerland and Liechtenstein – Events , Ministry of Culture, Government of India, 2018; Swiss hospitality for Indian guests , a joint report from HotellerieSuisse, Berne and Switzerland Tourism, November, 2019.
Namaste, India!
India is a high-potential, growing source market for leisure travel. Destinations looking to attract Indian leisure travelers could consider targeted marketing, an expanded range of affordable options, and customized on-the-ground hospitality that caters to Indian preferences. Destinations may need to take steps now to build a strong value proposition and distinguish themselves as a preferred location. To do so, they could take action in the following areas:
Destinations looking to attract Indian leisure travelers could consider targeted marketing, an expanded range of affordable options, and customized on-the-ground hospitality.
- Connect. Make travel seamless, for instance, by simplifying visa application processes and providing direct connectivity.
- Entice. Offer affordable packages with a range of choices that appeal to specific groups, such as families, couples, or solo travelers.
- Welcome. Make the experience traveler-friendly, for example, by providing appropriate food and beverage options like vegetarian and Indian cuisine.
- Attract . Design targeted campaigns to showcase experiences that Indian travelers want, and use appropriate channels to get the word out, for example leveraging over-the-air partnerships and social media.
- Unlock. Include the MICE (meetings, incentives, conferences, and exhibitions) and business tourism segments in marketing efforts to boost interest in leisure travel.
Divya Aggarwal is an associate partner in McKinsey’s Gurugram office, Margaux Constantin is a partner in the Dubai office, and Kanika Kalra is a partner in the Mumbai office, where Neelesh Mundra is a senior partner.
The authors wish to thank Ashu Airan, Steffen Köpke, Richa Kothari, Karthik Krishnan, Kargil Mishra, and Jean Petersen for their contributions to this article.
Explore a career with us
Related articles.

How Blackstone is helping to build India’s next generation of global companies

Opportunities for industry leaders as new travelers take to the skies
UN Tourism | Bringing the world closer
- All Regions
- 15 Jan 2018
2017 International Tourism Results: the highest in seven years
Share this content.
- Share this article on facebook
- Share this article on twitter
- Share this article on linkedin
PR No. : 18003
International tourist arrivals grew by a remarkable 7% in 2017 to reach a total of 1,322 million, according to the latest UNWTO World Tourism Barometer. This strong momentum is expected to continue in 2018 at a rate of 4%-5%.
Led by Mediterranean destinations, Europe recorded extraordinary results for such a large and rather mature region, with 8% more international arrivals than in 2016. Africa consolidated its 2016 rebound with an 8% increase. Asia and the Pacific recorded 6% growth, the Middle East 5% and the Americas 3%.
2017 was characterised by sustained growth in many destinations and a firm recovery in those that suffered decreases in previous years. Results were partly shaped by the global economic upswing and the robust outbound demand from many traditional and emerging source markets, particularly a rebound in tourism spending from Brazil and the Russian Federation after a few years of declines.
“International travel continues to grow strongly, consolidating the tourism sector as a key driver in economic development. As the third export sector in the world, tourism is essential for job creation and the prosperity of communities around the world.” said UNWTO Secretary-General Zurab Pololikashvili. “Yet as we continue to grow we must work closer together to ensure this growth benefits every member of every host community, and is in line with the Sustainable Development Goals”.
Growth expected to continue in 2018
The current strong momentum is expected to continue in 2018, though at a more sustainable pace after eight years of steady expansion following the 2009 economic and financial crisis. Based on current trends, economic prospects and the outlook by the UNWTO Panel of Experts, UNWTO projects international tourist arrivals worldwide to grow at a rate of 4%-5% in 2018. This is somewhat above the 3.8% average increase projected for the period 2010-2020 by UNWTO in its Tourism Towards 2030 long-term forecast. Europe and the Americas are both expected to grow by 3.5%-4.5%, Asia and the Pacific by 5%-6%, Africa by 5%-7% and the Middle East by 4%-6%.
2017 results by UNWTO region
International tourist arrivals in Europe reached 671 million in 2017, a remarkable 8% increase following a comparatively weaker 2016. Growth was driven by the extraordinary results in Southern and Mediterranean Europe (+13%). Western Europe (+7%), Northern Europe and Central and Eastern Europe (both +5%) also recorded robust growth.
Asia and the Pacific (+6%) recorded 324 million international tourist arrivals in 2017. Arrivals in South Asia grew 10%, in South-East Asia 8% and in Oceania 7%. Arrivals to North-East Asia increased by 3%.
The Americas (+3%) welcomed 207 million international tourist arrivals in 2017, with most destinations enjoying positive results. South America (+7%) led growth, followed by Central America and the Caribbean (both +4%), with the latter showing clear signs of recovery in the aftermath of hurricanes Irma and Maria. In North America (+2%), robust results in Mexico and Canada contrasted with a decrease in the United States, the region’s largest destination.
Based on available data for Africa , growth in 2017 is estimated at 8%. The region consolidated its 2016 rebound and reached a record 62 million international arrivals. North Africa enjoyed a strong recovery with arrivals growing by 13%, while in Sub-Saharan Africa arrivals increased by 5%.
The Middle East (+5%) received 58 million international tourist arrivals in 2017 with sustained growth in some destinations and a strong recovery in others.
Note: All results in this release are based on preliminary data, as reported by the various destinations around the world, and on estimates by UNWTO of still-missing data. UNWTO will continue to collect data and will present more comprehensive data by country in the April issue of the UNWTO World Tourism Barometer. Results for both Africa and the Middle East should be read with caution as they are based on limited available data.
Useful links:
UNWTO World Tourism Barometer
UNWTO Tourism Highlights, 2017 Edition
International Year of Sustainable Tourism for Development 2017
Infographics
UNWTO Media Officer Marcelo Risi Tel: (+34) 91 567 81 60
UNWTO Communications & Publications Programme
Tel: (+34) 91 567 8100 / Fax: +34 91 567 8218
Related Content
Kingdom of morocco wins high-level vote to host next wo..., tourism has ‘life-changing potential’ - world tourism o..., the world tourism organization and globalia launch the ..., world tourism organization general assembly opens with ....
IMAGES
VIDEO
COMMENTS
The Ministry of Tourism brings out an Annual Publication called "India Tourism Statistics " every year giving details of international and domestic tourism, including details about the classified hotels etc. ... India Tourism Statistics at a Glance, 2017 : Download 21.46 MB: 21 : India Tourism Statistics 2015 : Download 12.27 MB: 22 : India ...
The data released by the Ministry of Tourism shows that the foreign tourist arrivals (FTAs) in India leaped 19.5 percent year-on-year to 630,000 as of May 2017. There was also a leap in FTA's e-tourist visa by 55.3 percent year-on-year to 68,000 as of May 2017. These impacted on India's Foreign Exchange Earnings (FEEs) by driving it up by ...
India tourism statistics for 2018 was 29,143,000,000.00, a 4.54% increase from 2017. India tourism statistics for 2017 was 27,878,000,000.00 , a 20.63% increase from 2016. Download Historical Data Save as Image
Find the most up-to-date statistics and facts on the travel and tourism industry in India. ... Number of visitors to national monument India FY 2017-2022, by type.
India tourism statistics for 2020 was 13,413,000,000.00, a 57.64% decline from 2019. India tourism statistics for 2019 was 31,661,000,000.00, a 8.64% increase from 2018. International tourism receipts are expenditures by international inbound visitors, including payments to national carriers for international transport.
INDEX. S. No. Table No. Subject Page Number. 1 Key Statistics About Tourism, 2017 1 2 1 Inbound Tourism, 2000-2018 (till June) 2 3 2 Month-wise Foreign Tourist Arrivals in India, Jan 2016 - June 2018 3 4 3 Share of India in International Tourist Arrivals in World and Asia & the Pacific Region, 2000 - 2017 4 5 4 Top 10 International Check ...
International tourist arrivals (overnight visitors) reached a total of 1,235 million in 2016. This was 46 million more than in 2015, or an increase of 3.9%. The global pace of growth was slightly more moderate than in 2015 (4.5%), but in line with UNWTO's long-term forecast of 3.8% per year for the period 2010 to 2020.
International tourism, number of arrivals - India. World Tourism Organization, Yearbook of Tourism Statistics, Compendium of Tourism Statistics and data files. License : CC BY-4.0. LineBarMap. Also Show Share Details. Label. 1995 - 2019.
Sources: Bain analysis; Ministry of Tourism, 'India Tourism Statistics at a Glance, 2018'; World Travel & Tourism Council, India Initiative In 2018, Indians took roughly 1.8 billion trips, with both domestic and ... 2017-18) • Bus price hike due to GST, falling passenger footfalls and preference for
Foreign exchange earnings from tourism in India 2000-2022; ... Venezuela: number of tourist arrivals 2017, by region; Tourist arrivals from the United States of America in China 1995-2018;
Economic impact of tourism in India 2017. This report shows the economic impact of travel and tourism on the economy of India. It also includes country rankings for travel and tourism's economic ...
In fact, around 70 percent of travelers choose nearby destinations. 1 India tourism statistics 2020, Ministry of Tourism, Government of India, January 2021. ... In 2017, Azerbaijan introduced the ASAN system that processes electronic visas within three working days of application. Popularity with Indian tourists skyrocketed thereafter, with ...
INDIA TOURISM STATISTICS 2017.pdf - Free ebook download as PDF File (.pdf) or read book online for free. Scribd is the world's largest social reading and publishing site.
2017 was characterised by sustained growth in many destinations and a firm recovery in those that suffered decreases in previous years. Results were partly shaped by the global economic upswing and the robust outbound demand from many traditional and emerging source markets, particularly a rebound in tourism spending from Brazil and the Russian ...
Annual growth in tourist number India 2017 by state; Number of tourist arrivals from India to Europe 2019-2022, by destination ; Outbound tourism visitor growth worldwide 2020-2025, by region
Tourism in India is 4.6% of the country's gross domestic product (GDP). Unlike other sectors, tourism is not a priority sector for the Government of India. Forbes magazine ranked India as the 7th most beautiful country in 'The 50 Most Beautiful Countries In The World' rankings. The World Travel and Tourism Council calculated that tourism generated ₹ 13.2 lakh crore (US$160 billion) or 5.8% ...
01:36 - Source: CNN. Latest Videos 17 videos. Starliner crew arrives on the International Space Station. 01:36. Judge orders Steve Bannon to report to prison July 1. 01:29. Dr. Phil says he tried ...
12 11 Estimates of Foreign Exchange Earnings (FEEs) in Rs. Crore, from Tourism in India, 2000-2018 12 13 12 Month-wise Estimates of Foreign Exchange Earnings (FEEs), in Rs. Crore, from Tourism in India, Jan 2017 - June 2019 13 14 13 Share of India in International Tourism Receipt (ITRs) in World and Asia & the Pacific Region, 2000 - 2018 14
CAGR of tourist visits by state India 2016-2017; Annual growth in inbound visitor arrivals in Hong Kong 2013-2023; Number of tourist arrivals from India to Europe 2019-2022, by destination
Travel, Tourism & Hospitality ... Internet usage in India - statistics & facts ... Instagram: monthly brand profile follower growth 2017;