- Sustainable
- Energy Economy
- Energy Services

What is Round Trip Efficiency?

Energy storage systems function by taking in electricity, storing it, and subsequently returning it to the grid. The round trip efficiency (RTE), also known as AC/AC efficiency, refers to the ratio between the energy supplied to the storage system (measured in MWh) and the energy retrieved from it (also measured in MWh). This efficiency is expressed as a percentage (%).
The round trip efficiency is a crucial factor in determining the effectiveness of storage technology. A higher RTE indicates that there is less energy loss during the storage process, resulting in a more efficient overall system. Grid systems engineers strive for energy storage systems to achieve an 80% RTE whenever feasible, as it signifies a desirable level of efficiency and minimizes energy losses.
What Factors Can Affect the Round Trip Efficiency of an Energy Storage System?
The RTE of an energy storage system can be influenced by various factors, including:
1. Technology: Different storage technologies have varying round-trip efficiencies. For example, hydro storage typically ranges from 65% in older installations to 75-80% in modern deployments, while flywheels have efficiencies of about 80% to 90%. Some battery technologies can have round-trip efficiencies ranging from 75% to 90%.
2. Storage duration: Some technologies may experience leakage or energy loss over long-term storage, which can affect round-trip efficiency. It is important to consider the specific characteristics and limitations of the storage technology when evaluating its efficiency.
3. Age and condition of the system: Older storage systems may have lower round-trip efficiencies compared to newer ones. Factors such as wear and tear, component degradation, and maintenance practices can impact the overall efficiency of the system.
4. Charging and discharging rates: The speed at which energy is charged into and discharged from the storage system can affect its efficiency. Certain technologies may have lower efficiencies at high charging or discharging rates.
5. System design and control: The design and control strategies implemented in the energy storage system can influence its round-trip efficiency. Optimal system design, efficient power electronics, and effective control algorithms can improve the overall efficiency of the system.
6. Temperature: Temperature can have an impact on the performance and efficiency of energy storage systems. Extreme temperatures can affect the efficiency of certain storage technologies, such as batteries, leading to lower round-trip efficiencies.
Considering these factors is crucial when evaluating the round-trip efficiency of an energy storage system, as they can significantly affect its performance and effectiveness in storing and retrieving energy.
Must Read: What is Power Conversion Efficiency?

Elliot is a passionate environmentalist and blogger who has dedicated his life to spreading awareness about conservation, green energy, and renewable energy. With a background in environmental science, he has a deep understanding of the issues facing our planet and is committed to educating others on how they can make a difference.
Related Posts
?")
What is Heating Seasonal Performance Factor (HSPF)?
?")
What is Annual Fuel Utilization Efficiency (AFUE)?

What is Grid Parity?
Save my name, email, and website in this browser for the next time I comment.
Type above and press Enter to search. Press Esc to cancel.
Today in Energy
- Recent articles
- liquid fuels
- natural gas
- electricity
- oil/petroleum
- production/supply
- consumption/demand
- exports/imports
- international
- forecasts/projections
- steo (short-term energy outlook)
Utility-scale batteries and pumped storage return about 80% of the electricity they store
Electric energy storage is becoming more important to the energy industry as the share of intermittent generating technologies, such as wind and solar, in the electricity mix increases. Electric energy storage helps to meet fluctuating demand, which is why it is often paired with intermittent sources. Storage technologies include batteries and pumped-storage hydropower , which capture energy and store it for later use. Storage metrics can help us understand the value of the technology. Round-trip efficiency is the percentage of electricity put into storage that is later retrieved. The higher the round-trip efficiency, the less energy is lost in the storage process. According to data from the U.S. Energy Information Administration (EIA), in 2019, the U.S. utility-scale battery fleet operated with an average monthly round-trip efficiency of 82%, and pumped-storage facilities operated with an average monthly round-trip efficiency of 79%.
EIA’s Power Plant Operations Report provides data on utility-scale energy storage, including the monthly electricity consumption and gross electric generation of energy storage assets, which can be used to calculate round-trip efficiency. The metrics reviewed here use the finalized data from the Power Plant Operations Report for 2019—the most recent year for which a full set of storage data is available.
Pumped-storage facilities are the largest energy storage resource in the United States. The facilities collectively account for 21.9 gigawatts (GW) of capacity and for 92% of the country’s total energy storage capacity as of November 2020.
In recent years, utility-scale battery capacity has grown rapidly as battery costs have decreased. As batteries have been increasingly paired with renewables , they have become the second-largest source of electricity storage. As of November 20, 2020, utility-scale battery capacity had 1.4 GW of operational capacity. Another 4.0 GW of battery capacity is scheduled to come online in 2021, according to EIA’s Preliminary Electric Generator Inventory .
Although battery storage has slightly higher round-trip efficiency than pumped storage, pumped-storage facilities typically operate at utilization factors that are currently twice as high as batteries. Increasing durations among battery applications could shift battery operations toward services that reward longer output periods. For example, in 2015, the weighted average battery duration was a little more than 46 minutes, but by 2019, weighted average battery durations had doubled to 1.5 hours. The role of batteries and their capability to provide high levels of round-trip efficiency may become more important as batteries continue to be deployed and as the intermittent renewables share of the electricity mix grows.
Tags: storage , electricity
Performance Analysis of Lithium-Ion Battery Considering Round Trip Efficiency
Ieee account.
- Change Username/Password
- Update Address
Purchase Details
- Payment Options
- Order History
- View Purchased Documents
Profile Information
- Communications Preferences
- Profession and Education
- Technical Interests
- US & Canada: +1 800 678 4333
- Worldwide: +1 732 981 0060
- Contact & Support
- About IEEE Xplore
- Accessibility
- Terms of Use
- Nondiscrimination Policy
- Privacy & Opting Out of Cookies
A not-for-profit organization, IEEE is the world's largest technical professional organization dedicated to advancing technology for the benefit of humanity. © Copyright 2024 IEEE - All rights reserved. Use of this web site signifies your agreement to the terms and conditions.
Thank you for visiting nature.com. You are using a browser version with limited support for CSS. To obtain the best experience, we recommend you use a more up to date browser (or turn off compatibility mode in Internet Explorer). In the meantime, to ensure continued support, we are displaying the site without styles and JavaScript.
- View all journals
- My Account Login
- Explore content
- About the journal
- Publish with us
- Sign up for alerts
- Open access
- Published: 02 May 2019
The emergence of cost effective battery storage
- Stephen Comello ORCID: orcid.org/0000-0002-6637-0368 1 &
- Stefan Reichelstein 1 , 2
Nature Communications volume 10 , Article number: 2038 ( 2019 ) Cite this article
157 Citations
22 Altmetric
Metrics details
- Energy economics
- Energy policy
Energy storage will be key to overcoming the intermittency and variability of renewable energy sources. Here, we propose a metric for the cost of energy storage and for identifying optimally sized storage systems. The levelized cost of energy storage is the minimum price per kWh that a potential investor requires in order to break even over the entire lifetime of the storage facility. We forecast the dynamics of this cost metric in the context of lithium-ion batteries and demonstrate its usefulness in identifying an optimally sized battery charged by an incumbent solar PV system. Applying the model to residential solar customers in Germany, we find that behind-the-meter storage is economically viable because of the large difference between retail rates and current feed-in tariffs. In contrast, investment incentives for battery systems in California derive principally from a state-level subsidy program.
A high-performance capillary-fed electrolysis cell promises more cost-competitive renewable hydrogen

Sustainable regeneration of spent cathodes for lithium-ion and post-lithium-ion batteries

Physics-informed neural network for lithium-ion battery degradation stable modeling and prognosis
Introduction.
As the share of renewable energy in the overall energy mix increases, issues of intermittency and dispatchability of the electricity supply are emerging as central in the quest for a grid that is both stable and decarbonized 1 , 2 , 3 . Cost effective energy storage is arguably the main hurdle to overcoming the generation variability of renewables. Though energy storage can be achieved in a variety of ways, battery storage has the advantage that it can be deployed in a modular and distributed fashion 4 . This feature partly explains the recent growth in behind-the-meter storage applications, for instance, when rooftop solar is combined with battery storage 5 , 6 , 7 , 8 , 9 , 10 , 11 . Our analysis builds on recent studies that have sought to assess the economic viability of battery storage systems in conjunction with renewable power generation.
The Levelized Cost of Energy Storage (LCOES) metric examined in this paper captures the unit cost of storing energy, subject to the system not charging, or discharging, power beyond its rated capacity at any point in time. This power constraint effectively determines the average duration of the storage system, that is, the average amount of energy that can be stored per kilowatt of power capacity. For any given storage system, the significance of the LCOES metric is that it yields a minimum price that investors would require on average per kWh of electricity stored and subsequently dispatched in order to break even on their investments. In the 2019 market environment for lithium-ion batteries, we estimate an LCOES of around twelve U.S. cents per kWh for a 4-hour duration system, with this cost dropping to ten cents for a 6-hour duration system.
Our analysis demonstrates the use of the LCOES measure in identifying the optimal size of a battery that is charged by an incumbent solar PV system. In the context of residential behind-the-meter storage, the economic benefit of storage capacity is that it yields a price premium, given as the difference between the retail electricity price and the overage tariff that is obtained for surplus energy generated by the solar PV system but not self-consumed. In contrast, the household does not derive additional revenues from reduced demand charges that frequently apply to corporate customers 7 , 12 . To effectively complement an intermittent solar PV system with storage, an optimally sized battery system will be such that the price premium is equal to the LCOES evaluated at the duration corresponding to the last (marginal) power component. The actual duration of this marginal power component is determined jointly by the solar PV generation and the load consumption profile of the representative household.
We first apply this optimization framework in the context of German households where feed-in tariffs for solar PV power have recently been reduced, yielding a time-invariant price premium around 16 € cents per kWh. We find that this price premium is sufficient to incentivize the installation of a battery, as the levelized cost of storage for the optimally sized system is around 8.5 € cents per kWh, owing to a duration of ~7 h. A significant share of all existing behind-the-meter storage installations in the U.S. are in California 13 . This may seem surprising since California has reaffirmed its commitment to net metering. Taken by itself, net metering would effectively eliminate any price premium, yet the state effectively also created a price premium by imposing a non-bypassable surcharge on electricity consumed from the grid for customers with rooftop solar installations 14 , 15 . We find that this surcharge in combination with the state’s rebate program, titled Self Generation Incentive Program (SGIP), and the federal Investment Tax Credit (ITC) is sufficient to incentivize substantial investments in behind-the meter battery storage. At the same time, the structure of the rebates under SGIP will result in battery systems with a relatively short duration but large power rating.
The cost of energy storage
The primary economic motive for electricity storage is that power is more valuable at times when it is dispatched compared to the hours when the storage device is charged 8 , 12 , 16 , 17 , 18 . These benefits will accrue over the entire lifetime of the storage system and must be weighed against the cost of acquiring a system capable of performing the storage service for a given number of charging/discharging events per year over the useful life of the system. A battery will be sized in the two dimensions of power and energy capacity. The size of the power component, measured in kW, governs the maximum rated electricity charge/discharge rate. The energy component determines the total capacity of electricity that can be stored. It is measured in kWh. Moreover, the ratio of energy capacity to rated power determines the duration for which the storage facility can provide the rated power. This is also the length of time needed to charge the battery given its power rating.
To capture the unit cost associated with energy storage, we introduce the Levelized Cost of Energy Storage (LCOES) which, like the commonly known Levelized Cost of Energy, is measured in monetary units (say U.S. $) per kWh. Similar to the LCOE that indicates the average revenue an investor would need in order to break-even over the life cycle of a power generating facility 19 , the LCOES measure captures the break-even value for charging and discharging electricity on a per kWh basis.
Earlier studies on the cost of storage have usually fixed the duration of the storage system at some exogenous value, for instance, 4 h 18 , 20 . In contrast, we first decompose the overall unit cost into the levelized cost of energy components, LCOEC (in $ per kWh), and the levelized cost of power components, LCOPC (in $ per kW). As shown in the Methods section, these levelized costs are obtained by dividing the system price of the power and energy components, respectively, by the total discounted number of charge/discharge occurrences that the battery performs the storage service in the course of its useful life. In particular, the number of charge/discharge events per year is multiplied by a factor that reflects the useful life of the battery, the cost of capital (discount rate), round-trip efficiency losses and, finally, performance degradation over time. It is presumed that these cycling occurrences are not limited to only full capacity charging and discharging, rather, they would include partial charge/discharge events where the capacity of the battery is not fully charged or discharged.
For a storage system with a power rating of k p kW and a storage capacity of k e kWh, the corresponding average duration is defined as \(D \equiv \frac{{k_{\mathrm{e}}}}{{k_{\mathrm{p}}}}\) hours. The duration, D , indicates the number of hours that the system charges and discharges k p kW of power per full cycle. On a lifetime basis, the cost of storing one kWh of electricity, and dispatching it at later hours of the same cycle is LCOES ( D ) = LCOEC + LCOPC · \(\frac{1}{D}\) . Since D is stated in hours, LCOES( ⋅ ) is expressed in $ per kWh. The following claim identifies the LCOES metric as the break-even price per kWh for electricity storage services.
Claim: \({{\mathrm{LCOES}}\left({\frac{{k_{\mathrm{e}}}}{{k_{\mathrm{p}}}}} \right) = {\mathrm{LCOEC}} + {\mathrm{LCOPC}} \cdot \frac{{k_{\mathrm{p}}}}{{k_{\mathrm{e}}}}}\) is the break-even price for storing and dispatching k e kWh of energy in N charging/discharging events per year, subject to the maximum power charge (discharge) not exceeding k p kW at any point in time.
The preceding claim is formally validated in the Methods section below. To calibrate the LCOES metric in the context of lithium-ion, batteries, the following calculations are based on current U.S. market prices of $171 per kWh and $970 per kW for energy and power components, respectively, in the context of small residential applications (see Supplementary Figures 1, 2 and Supplementary Tables 1–3). In the context of lithium-ion batteries, we expand the cost model in order to allow for certain costs related to installation to be entirely independent of the size of the battery, e.g., permitting, inspecting,and commissioning. In the location-specific application of our model, these fixed costs are estimated to be $400 in the U.S. and $300 (€260) in Germany (see Supplementary Notes 1 – 6 ).
Assuming N = 365 charging/discharging events, a 10-year useful life of the energy storage component, a 5% cost of capital, a 5% round-trip efficiency loss, and a battery storage capacity degradation rate of 1% annually, the corresponding levelized cost figures are LCOEC = $0.067 per kWh and LCOPC = $0.206 per kW for 2019. The solid curve in Fig. 1 shows the corresponding LCOES for alternative duration values. In the presence of installation related fixed costs, LCOES then yields the break-even price for covering the systems costs that do vary proportionally with either k e or k p ; see Methods section for further details.

Simulated trajectory for lithium-ion LCOES ($ per kWh) as a function of duration (hours) for the years 2013, 2019, and 2023. For energy storage systems based on stationary lithium-ion batteries, the 2019 estimate for the levelized cost of the power component, LCOPC, is $0.206 per kW, while the levelized cost of the energy component, LCOEC, is $0.067 per kWh. The curve corresponding to the year 2019 plots the corresponding LCOES values for alternative levels of the storage system’s duration. The LCOES curve corresponding to the year 2013 indicates the decline in lithium-ion based battery storage costs over the past five years. The 2023 curve projects anticipated future cost reductions. Source data are provided as a Source Data file
Consistent with the recent widespread installation of li-ion based batteries, the LCOES of such systems has dropped dramatically in recent years 21 , 22 , 23 . The dotted curve shows the corresponding nominal LCOES figures back in 2013. Projecting into the future, the consensus forecast that emerges from various literature sources are annual percentage declines of 5.6% and 8.1% for the acquisition cost of the power and storage components, respectively, over the horizon 2018–2023. Assuming that this rate of improvement can indeed be maintained on average during those years, the dashed curve in Fig. 1 provides a forecast of where the LCOES of li-ion battery systems is expected to be in 2023 (see Supplementary Notes 2 and 4 ).
Our LCOES metric is a variant of existing storage cost measures 18 , 20 , 24 , 25 , 26 , 27 . For energy generation, the familiar LCOE measure is frequently conceptualized as total (discounted) cash flows spent divided by total (discounted) energy delivered 27 , 28 . Existing studies on the levelized cost of storage follow the same total-cost-divided-by-total-energy approach 20 , 26 , 29 , 30 . While our LCOES measure is also calibrated as a break-even measure, our metric departs from two individual levelized cost measure (power and energy) and then aggregates these two measures depending on the average duration of the system. This disaggregation will prove useful in characterizing optimally sized storage systems. In particular, the following section shows that the conditions for an optimally sized battery can be expressed succinctly in terms of the optimized duration. By optimizing the duration of the battery storage system, we obtain cost figures that are consistent with the recent widespread and increasing deployment of such storage systems. Earlier studies that arrived at substantially higher cost of storage have frequently fixed the duration at 2 or 4 h 20 , 26 . It should also be noted that our LCOES concept only captures the cost per kWh of warehousing electricity on a daily basis, subject to the system’s power rating constraint. In contrast, some earlier studies also include the cost of generating the energy that is being dispatched 26 , 29 .
Optimal battery size supplementing a solar PV system
We consider a representative household that has already installed a solar PV system and now faces the question whether behind-the meter storage adds additional value. To illustrate the basic economic tradeoff, we first consider a household for which both the consumption load and the solar generation profile are fairly constant across the seasons of the year. The solid curve in Fig. 2 depicts the average load profile and the bell-shaped dotted curve depicts the average solar PV generation curve.

Pattern of daily charging and discharging of a battery supplementing a PV system. Region I represents self consumption from solar generation; region II is surplus energy that can be stored and subsequently discharged as region IV (minus efficiency losses); and region III is surplus energy sold to the grid. Region V is residual demand that would not be met by the battery and must be met through purchases from the grid at the going retail rate p
Absent any battery storage, the household will self-consume the energy represented by the area marked I in Fig. 2 , and buy the energy outside the time interval [ t − , t + ] at the going retail rate, denoted by p . The surplus energy from the solar system, i.e., the regions marked II and III, can possibly be sold back to the energy service provider at some overage tariff, OT which, in Germany, is given by the prevailing feed-in tariff. If a battery system is added, the energy corresponding to the region marked as II in Fig. 2 would be discharged during times when household demand exceeds generation by the rooftop solar facility. Accordingly, region IV in Fig. 2 is equal to region II minus the round-trip efficiency losses. The following derivation also maintains the implicit assumption that the demand represented by combined areas represented IV and V is sufficiently large to absorb the stored energy corresponding to II. Region V is residual demand that would not be met by the battery and must be met through purchases from the grid at the going retail rate p . The general case—which underlies our calculations and empirical findings—is presented in the Methods section.
A battery supplementing an existing solar rooftop system will add value only if the difference between the retail rate p and the overage tariff, OT, is sufficiently large to cover the levelized cost of the optimally sized battery. With a higher power rating, k p , the amount of energy that can be stored will grow at a diminishing rate (Fig. 2 ). Referring to the power generation curve as G ( ⋅ ) and the household load curve as L ( ⋅ ), the area (energy) corresponding to region II in Fig. 2 becomes:
Our characterization of an optimally sized battery follows the standard microeconomic approach of an (household) investor that seeks to maximize the discounted value of future expected cash flows. As shown in Methods, the overall present value of all cash flows associated with the battery storage system (excluding any fixed costs that do not vary with the size of the battery) is proportional to the profit margin, PM, per cycle, given by:
Here, pp refers to the price premium, which is the time-averaged difference between p and OT, adjusted for round-trip efficiency losses and the temporal degradation of the energy discharged by the battery. Equation ( 2 ) shows that in order for a storage system to add value, the price premium, pp, must exceed the levelized cost of the energy component, LCOEC, yet this is not sufficient because of the need to cover the levelized cost of the power component, LCOPC. The marginal return to systems with a higher power rating is diminishing and therefore a storage system with positive net-present value can be found if, and only if, the daily profit margin is positive for small values of k p . The value of E + ( k p ) is approximately equal to k p ⋅ ( t + − t − ) for small values of k p (by L’Hospital’s rule). Therefore some storage system will be valuable for the representative household whenever [pp—LCOEC] ⋅ ( t + − t − ) − LCOPC > 0.
To identify an optimally sized battery system in this setting, we refer to \({\cal{I}}_ + (k_{\mathrm{p}})\) as the duration of the marginal power component, for a given power rating, k p , of the battery. Formally, \({\cal{I}}^ + (k_{\mathrm{p}})\) is defined as the length of the time interval(s): I + ( k p ) ≡ { t ∈ [0,24]| L ( t ) + k p < G ( t )}. For the battery storage system illustrated in Fig. 2 the duration of the marginal power component is ( t * − t * ) hours. In general, the duration of the marginal power component is the derivative of the function E + ( ⋅ ) with respect to k p . The first-order optimality condition corresponding to ( 2 ) therefore is
with the optimal storage capacity determined by \(E^ + (k_{\mathrm{p}}^ \ast )\) according to Eq. ( 1 ). Thus the LCOES concept introduced above can be used to identify the size of the value-maximizing battery system by equating the price premium and the LCOES evaluated at the duration of the marginal power component. To illustrate this criterion in the context of Fig. 2 , suppose the investor is considering to add an additional kW of power capacity. That would enable the addition of at most another ( t * − t * ) kWh of storage capacity because the solar installation shown in Fig. 2 would make at most that many additional kWh of surplus energy available for charging. The incremental revenue of this addition would therefore be pp ⋅ ( t * − t * ) kWh, while the incremental levelized cost would be LCOPC + LCOEC ⋅ ( t * − t * ) ⋅ h . Optimality requires that the incremental cost be equal to the incremental revenue, or after dividing by ( t * − t * ) ⋅ h , the optimality condition becomes pp = LCOES (( t * − t * ) ⋅ h ).
It should be noted that the average duration of the optimal battery storage system exceeds the duration of the marginal power component, because \(\frac{{\hat k_{\mathrm{e}}(k_{\mathrm{p}}^ \ast )}}{{k_{\mathrm{p}}^ \ast }} > {\cal{I}}^ + (k_{\mathrm{p}}^ \ast ).\) This inequality reflects that the optimal duration, \(\frac{{\hat k_{\mathrm{e}}(k_p^ \ast )}}{{k_{\mathrm{p}}^ \ast }}\) , is the average of the durations of the inframarginal power components. In Fig. 2 , these durations range from the lowest ( t * − t * ) ⋅ h to the maximum value ( t + − t − ) ⋅ h .
In Methods we present an extended version of the model that allows for both the solar generation and household electricity demand to vary across the different months of the year. Central to this extension is the variable E s ( k p ). For a given month (season), s , the energy quantity E s ( k p ) represents the maximum that can both be charged during the hours of the middle of the day with surplus solar power and discharged in the hours when the household’s load exceeds the available solar rooftop energy. The optimally sized battery will generally be oversized relative to the needs of a particular month and undersized in others. As a consequence, the battery will not be fully charged in certain months and therefore will not go through full charging/discharging events for parts of the year. Similarly, it will depend on the month whether the household is grid-positive in the sense that, on a daily basis, the household sells energy to the grid, yet does not buy power from the grid. In contrast, the battery storage system shown in Fig. 2 leaves the household a prosumer—self-producer and grid-consumer of electricity—on account of regions III and V.
Our analysis is complementary to other studies that have explored residential solar PV coupled with storage. Some studies have sought to calculate the levelized cost of storage with solar PV, though with energy and power components the size of which is exogenously fixed rather than determined through an explicit optimization 20 , 31 . Some studies have determined optimal power and energy dimensions for storage systems of various technologies, though only in the context of a 1-year simulation 10 . Other studies rely on sensitivity analysis to find optimal solar PV plus storage new-build combined systems without explicit consideration of the dimension of the power component or the corresponding life-cycle cost metric 5 , 16 . Finally, some earlier studies have also focused on sizing a storage system when revenues are obtained through price arbitrage 27 , though in contrast to our approach, these studies do not yield estimates for the optimized levelized cost of energy storage.
Location-specific applications
Incentives for distributed energy generation in Germany have long been provided by feed-in tariffs. For recent solar installations these tariffs have recently been reduced to ≈12 € cents per kWh 32 . The current retail rates of near 30 € cents therefore create a substantial price premium. In contrast to other jurisdictions around the world, Germany provides only modest direct incentives for battery storage installations 33 .
Table 1 shows the results of our model for a representative household in Munich. The calculations are based on a model with 12 representative days, one for each month of the year (see Supplementary Table 4 and Supplementary Note 7 ). For a k s = 6 kW p residential solar installation, we obtain an optimal battery size of \(k_{\mathrm{p}}^ \ast = 0.73\,{\mathrm{kW}}\) and \(k_{\mathrm{e}}^ \ast = 5.1\,{\mathrm{kWh}}\) , yielding an average duration of about 7 h. The corresponding levelized cost of storage is LCOES = 8.5 € cents per kWh and, separately, the fixed cost is given as €260.
To calibrate our findings, we note that the ratio of k s to \(k_{\mathrm{e}}^ \ast\) aligns with residential battery system sizes observed in Germany 34 . While our calculations identify the battery capacity yielding the highest net-present value from a pure arbitrage perspective, the household could essentially double the size of the battery and still break-even on the investment. Specifically, the net-present value would still be non-negative if k p = 1.6 kW and k e = 8 kWh. That energy capacity is, in fact, close to the observed average capacity installation in Germany for 2017 34 . Depending on the specific application of the battery system and the frequency of short duration high-power loads, it may be advantageous to opt for a higher power capacity and additional grid purchases.
The optimally sized battery will be fully charged on representative days during five months of the year. Thus \(k_{\mathrm{e}}^ \ast = 5.1 \le E_s(k_{\mathrm{p}})\) . In the remaining 7 months there is either insufficient supply of solar power (November–February) or there is insufficient demand in the after sunset hours (June–August). The household will be grid-positive during average days in June, July, and August in the sense that the energy stored in the battery is sufficient to meet the household’s electricity load. Formally, \({\mathrm{min}}\{ k_{\mathrm{e}}^ \ast ,E_s(k_{\mathrm{p}})\} = A_s\) during those months.
Under current rules, solar PV systems in Germany exhaust their feed-in tariff support after 20 years. At that point in time, the household would probably not receive more than the average wholesale rate (around 3 € cents per kWh) for any surplus energy sold back to the energy service provider. For such older solar PV systems, the financial return from adding a battery system would at that point increase further because the price premium would then effectively be at least 27 € cents per kWh. Under this scenario, it would be economical to install a larger power rating (over 4 kW) and coupled larger energy capacity (between 8 €kWh and 11 kWh).
In contrast to Germany, California may at first glance not appear ideally suited for behind-the-meter storage installations. The state’s continued commitment to the policy of net metering effectively allows both residential and commercial customers to sell any temporal surplus electricity back to their energy service providers at the same rate at which the customer acquires electricity from the grid. From the perspective of the customer, this policy effectively enables free energy storage. In the context of the above model, the price premium for storage systems in California would therefore be zero. It should be noted, though, that in confirming the state’s commitment to net metering, California utilities were nonetheless allowed to impose a non-bypassable charge for all electricity consumed by customers with residential solar PV installations. The average non-bypassable charge rate is 2.7¢ per kWh. This surcharge thus becomes an effective price premium because any energy fed back to the grid from the solar facility will only be credited at the basic electricity retail rate.
For new storage installations in California, investors are eligible for both federal and state-level support programs. At the federal level, battery installations in the U.S. qualify for an Investment Tax Credit, ITC, provided the battery can be classified as solar equipment 35 . Specifically, this requires that the energy storage capability of the battery does not exceed the total energy generated by the solar PV system. As detailed further in Methods, the battery would otherwise only be eligible for a share of the maximum ITC, which amounts to 30% of the acquisition cost.
In addition to the federal support for battery storage systems installed in conjunction with solar PV systems, California has adopted the so-called Self-Generation Incentive Program (SGIP) for behind-the-meter storage systems (see Supplementary Note 8 ). This program ultimately explains why the majority of residential battery storage systems installed to date in the U.S. are in fact located in California. In its current form, SGIP offers a rebate on the expenditure for energy storage components. Thus it is stated in $ per kWh and effectively reduces the acquisition cost of energy storage components, that is, the parameter v e .
The specific amount to be rebated depends on the duration of the storage system. Normalizing k p at 1 kW, the investor is entitled to a rebate of $400 for the first two kWh of energy storage, an additional rebate of $250 for the next two kWh, and a final rebate of $100 for the next two kWh, up to a duration of 6 h. Additional energy storage components corresponding to the initial 1 kW power rating do not receive any subsidy. For a power component of k p kW, the rebate amounts to $400 for each kWh of energy storage provided the duration of the system does not exceed 2 h 36 . For systems with longer durations, the rebate per kWh steps down as indicated above, such that no additional support is given to systems with a duration exceeding 6 h. These rebates are available in addition to the federal 30% investment tax credit (ITC) for batteries that qualify as solar equipment.
Table 2 shows the results of our model applied to Los Angeles (see Supplementary Table 5 and Supplementary Note 9 ). Given a 4.85 kW p residential solar installation, we obtain an optimal battery size of \(k_{\mathrm{p}}^ \ast = 2.45\,{\mathrm{kW}}\) and \(k_{\mathrm{e}}^ \ast = 9.8\,{\mathrm{kWh}}\) . The optimal duration is D * = 4 h with a corresponding LCOES of 0.6¢ per kWh and, separately, the fixed cost is given as $400.
In contrast to our findings for Germany, the optimally sized battery in California would be charged to capacity effectively every month other than December and January (there is only a small amount of slack of 0.02 kWh in July). At the same time, the representative household will be grid-positive only in the month of June, as in every other month the household will have to continue purchasing power after acquisition of the optimally sized battery. Since the effective price premium is 2.7¢ per kWh, such a system creates value for the investing party under current conditions. Absent any federal or state-level incentives, the LCOES would be 12.8¢ per kWh. The ITC covers 3.8¢(≈0.3 · 12.8¢), while SGIP contributes the remaining 8.4¢.
The fact that the optimal duration in California is exactly 4 h is not a coincidence. It rather reflects that under SGIP the incremental rebate for systems with a duration exceeding 4 h drops from $200 to $100 per kWh. In conjunction with the federal ITC, the California rebate is sufficiently large so as to incentivize a duration between 4 and 6 h, even in the absence of any price premium. The only reason a California household would not install an arbitrarily large storage system is that the full federal tax credit would no longer be available once the energy storage capability exceeds 12.2 kWh, which is the annual average daily production from the solar installation.
We note that an implication of the model is that SGIP could result in economic storage systems (i.e., PM( k p ) ≥ 0) with an oversized power rating, relative to what is needed to store the peak production surplus from solar generation. The largest system that would be economical to install has the dimensions of k p = 2.9 kW and k e = 11.6 kWh. In order to maintain a relatively short duration and thereby qualify for a correspondingly high rebate under SGIP, the household will acquire a power component that is 20% larger than optimal. To witness, the duration of the optimally sized battery in California is about half of that in Germany. This conclusion needs to be qualified by the observation that our analysis has employed average hourly load data that do not reflect short-term spikes in power consumption. If such spikes occur with sufficient frequency (e.g., electric vehicle charging, simultaneous clothes drying, and air conditioning operation), the household could be left with a tradeoff between greater autonomy resulting from a more powerful battery and additional electricity purchases from the grid.
In order to achieve the renewable energy goals articulated by many jurisdictions around the world, energy storage will need to provide a sizable buffer against the variability and intermittency that is inherent to power generation from wind and solar energy. A frequently articulated concern about energy storage is the common perception of high cost. This paper argues that the cost of storage is driven in large part by the duration of the storage system. Duration, which refers to the average amount of energy that can be (dis)charged for each kW of power capacity, will be chosen optimally depending on the underlying generation profile and the price premium for stored energy. The economies of scale inherent in systems with longer durations apply to any energy storage system. In comparison to battery storage, we would expect these scale economies to be more pronounced for hydrogen storage. There the levelized cost of the electrolyzer that converts electricity and water into hydrogen and oxygen is arguably larger than the levelized cost of the power component of a battery system 37 . In contrast the LCOEC for hydrogen storage is likely to be smaller than that of li-ion cells if the hydrogen is stored in tanks or underground caverns 37 .
For lithium-ion batteries, we find that, depending on the duration, an effective upper bound on the current unit cost of storage would be about 27¢ per kWh under current U.S. market conditions. Such a high cost would be obtained for a system with a duration of 1 h, that is, 1 kWh of energy that can be charged, or discharged, in 1 h ( k p = 1). In that case, the levelized cost of storage in the current U.S. market would amount to LCOES = LCOPC + LCOEC = 20.6 + 6.7¢ per kWh. At the same time, our analysis shows that a household in the German setting that seeks to optimize the size of its behind-the-meter storage facility, so as to complement a rooftop solar installation, would find it optimal to adopt a 7 h duration system. Not only will that would reduce the LCOES to 8.5 € cents per kWh, such a larger duration system would experience relatively few full cycling events, prolonging operational life 38 , 39 . Furthermore, within the Germany case, if the recent trend in the system prices for lithium-ion batteries continues, we project this levelized cost of storage figure to decrease to about 6.5 € cents per kWh within another four years.
For an incumbent solar installation, the levelized cost of energy storage concept is useful in order to identify an optimally sized behind-the-meter battery system. The key observation for storage in conjunction with a solar PV system is that for each additional kW of power capacity, the additional number of hours that the system can absorb energy is diminishing. This leads to the simple optimality condition that the available price premium will be equal to the LCOES evaluated at the duration corresponding to the last power component. This model framework yields new predictions for the storage systems that residential solar customers in both Germany and California would want to adopt. In both jurisdictions, investments in battery storage are now emerging as financially advantageous provided the storage system is sized and configured optimally. Yet, the economic fundamentals differ substantially due to the different regulatory regimes in place.
The incentives to invest in battery storage in Germany are principally driven by the sizable difference between retail rates and feed-in tariffs. The resulting price premium for energy that is self generated and stored of about 16 € cents per kWh generates a tangible profit margin in comparison to the optimized LCOES value of about 8.5 € cents per kWh. The prospect of further reductions in battery acquisition costs in the future as well as the policy trend towards lower feed-in tariffs for residential solar PV power is likely to strengthen the incentives for installing behind-the meter storage devices in the future.
Our explanation for the recent growth in residential storage capacity in California is based primarily on the combination of the state’s rebate program in conjunction with the federal investment tax credit that is available for storage devices that qualify as solar equipment. In contrast to Germany, the price premium is modest under California’s net-metering policy. As the acquisition cost of storage modules continues to decline, the state of California is likely to adjust the current rebate program. Our analysis suggests that a more cost effective approach for the rebate program would lessen the incentive for storage systems with a relatively short duration, such as the 4 h that emerge as most profitable for the household in our calculations.
There are several promising avenues for extending the analysis in this paper. First, while the analysis in this paper has viewed the adoption of the solar PV system as exogenous and given, many commercial and residential investors will in the future view distributed generation and storage as a simultaneous investment decision. Depending on the overage tariff that is available for energy that is fed to the grid, the availability of cost effective behind-the-meter storage will provide incentives for a larger PV system, which, in turn, is likely to increase the size of the optimally sized battery system 11 , 12 , 40 . Secondly, our framework is also readily extended to commercial rather than residential electricity customers. An additional financial motive to invest in battery storage for commercial customers is the avoidance of demand charges and peak pricing charges under time-of-use pricing. In the U.S., these features are becoming increasingly important in the tariff structures for many commercial customers. Such tariff structures provide additional incentives for behind-the-meter storage installations.
LCOES as the break-even value
We first demonstrate that \(\mathrm{LCOES} \left( {\frac{{k_{\mathrm{e}}}}{{k_{\mathrm{p}}}}} \right) = {\mathrm{LCOEC}} + {\mathrm{LCOPC}}\cdot\frac{{k_{\mathrm{p}}}}{{k_{\mathrm{e}}}}\) is the break-even value per kWh for investing in an energy storage system. At first, we suppose that all system cost scale linearly with the size of the battery storage system. Specifically, suppose a household or an external service provider invests in a system that is capable of storing and dispatching k e kWh of energy per cycle, subject to the maximum power charge (or discharge) not exceeding k p kW at any point in time. Suppose further that there are N cycles per year and the unit revenue for storage is $ p o per kWh. We follow the standard approach in economics that posits that the investing party (household) will seek to optimize the discounted value of future cash flows (NPV) resulting from investment in a storage system:
with the input variables shown in the following table Table 3.
Finally, \({\mathrm{Rev}}_i^N(k_{\mathrm{p}},k_{\mathrm{e}})\) denotes the revenue that can be obtained from the storage service for each cycle in year i :
with p o denoting the unit revenue (possibly the price premium) per kWh stored. The discounted value of cash flows obtained from such a battery storage investment can be rewritten as Γ ⋅ PM ( k p , k e ) where Γ denotes a proportionality factor given by \(\Gamma \equiv N \cdot \eta \cdot \mathop {\sum}\nolimits_{i = 1}^T {x_i \cdot \gamma ^i}\) , and PM denotes the profit margin per charging/discharging event:
Here, LCOEC and LCOPC are the levelized costs of the energy and power components of the storage system, respectively:
\({\mathrm{LCOPC}} = \frac{{v_{\mathrm{p}}}}{\Gamma }\quad \quad \quad \quad {\mathrm{LCOEC}} = \frac{{v_{\mathrm{e}}}}{\Gamma }.\)
In order for the unit revenue, p o , to be a break-even price, the profit margin per charging/discharging event must be zero, or \(p^{\mathrm{o}} = {\mathrm{LCOES}}\left( {\frac{{k_{\mathrm{e}}}}{{k_{\mathrm{p}}}}} \right)\) . Thus the LCOES at the duration \(D = \frac{{k_{\mathrm{e}}}}{{k_{\mathrm{p}}}}\) is the break-even price per kWh. If there are fixed costs, FC, that are unrelated to the size of the battery, e.g., installation related costs such as permitting and inspection, then:
and the break-even value for a zero net-present value becomes
Optimal battery size with one representative day
In connection with a residential solar PV system and a constant unit revenue for electricity stored, there is, for any given k p and k e no loss of generality in assuming that the system goes through daily charging and discharging events ( N = 365), even though the battery may not be fully charged. This will generally be the case when there are significant seasonal variations in the household’s load and generation profiles. Absent any seasonal variations, an efficient battery system will size the power rating so as to absorb k e kWh of energy with minimal power. The relation between k e and k p is therefore determined by the household’s electricity load L ( ⋅ ) and the generation profile of the solar PV system, G ( ⋅ ), as illustrated in Fig. 2 . Formally, we again have
An optimally sized battery system maximizes the profit margin per cycle PM ( k p , k e ), with p o given by the levelized price premium:
Here, p denotes the retail price of electricity and OT denotes the applicable overage tariff that the customer can obtain for surplus energy fed to the grid. These gains must be adjusted for round-trip energy losses. Thus, an optimal storage system maximizes the daily profit margins (averaged across the years):
where E ( k p ) = min{ E + ( k p ), E − ( k p )}. Thus E s ( k p ) represents the maximum that can both be charged during the hours of the day with surplus solar power and discharged during the hours when the household’s load exceeds the available solar rooftop energy.We note that E ( k p ) is concave because the minimum of the two concave functions E + ( k p ) and E − ( k p ) is concave. The derivative of E ( k p ) is given by \({\cal{I}}^ + (k_{\mathrm{p}})\) if E + ( k p ) < E − ( k p ), while this derivative is given by \({\cal{I}}^ - (k_{\mathrm{p}}^ \ast )\) , defined as the length of the time intervals I − ( k p ) ≡ { t ∈ [0, 24]| L ( t ) − k p > G ( t )}, if E + ( k p ) > E − ( k p ). To characterize the power rating of the optimally sized battery system, there are three possible candidates. First if the power capacity \(k_{\mathrm{p}}^1\) given by:
is such that \(E^ + (k_{\mathrm{p}}^1) \le E^ - (k_{\mathrm{p}}^1)\) , then \(k_{\mathrm{p}}^1\) is the optimal power rating. Secondly, if the \(k_{\mathrm{p}}^2\) given by:
is such that \(E^ - (k_{\mathrm{p}}^2) \le E^ + (k_{\mathrm{p}}^2)\) , then \(k_{\mathrm{p}}^2\) is the optimal power rating. If neither of these scenarios apply, there is a unique value \(k_{\mathrm{p}}^3\) between \(k_{\mathrm{p}}^1\) and \(k_{\mathrm{p}}^2\) such that \(E^ + (k_{\mathrm{p}}^3) = E^ - (k_{\mathrm{p}}^3)\) . This \(k_{\mathrm{p}}^3\) must be the optimal value because, if the first two scenarios do not apply, the function PM ( k p ) = (pp − LCOEC) · min{ E + ( k p ), E − ( k p )} − LCOPC · k p must be increasing up to \(k_{\mathrm{p}}^3\) and decreasing thereafter.
Optimal battery size with seasonal variations
To incorporate the effect of seasonal variations in both solar PV generation and household consumption, we divide the year into n different seasons, with one representative day for each season. Let Δ s represent the share of days out the total 365 days of the year. Thus the Δ s sum up to one. The functions E + ( k p ) and E − ( k p ) in Eqs ( 9 ) and ( 10 ) are then indexed by 1 ≤ s ≤ n , i.e., \(E_s^ + (k_{\mathrm{p}})\) and \(E_s^ - (k_{\mathrm{p}})\) Correspondingly, let \(E_s(k_{\mathrm{p}}) = {\mathrm{min}}\{ E_s^ + (k_{\mathrm{p}}),E_s^ - (k_{\mathrm{p}})\}\) . Taking seasonal variations into account, the daily profit margin can be stated as:
This objective function reflects that in each season the maximum energy that can be stored is the lower of two values: the energy capacity of the battery and the energy that can effectively be charged and discharged in one day during that particular season, given the power rating, k p . If there is only one season, then k e = E ( k p ). With seasonal variations, the optimal energy capacity will need to balance the value that storage creates in different seasons.
The optimal energy capacity for any given power rating k p maximizes the objective function in ( 15 ) with regard to k e . To that end, we denote by ( m (1), ...., m ( n )) a permutation of the integers (1, ..., n ) such that E m (1) ( k p ) ≤ ..., ≤ E m ( n ) ( k p ). According to the objective function in ( 15 ), adding another energy unit to the battery makes sense only to the extent that this additional kWh can be put to use in sufficiently many seasons so that the corresponding revenues collectively outweigh the incremental cost of LCOEC. Formally, for any given k p , the optimal energy capacity \(k_{\mathrm{e}}^ \ast (k_{\mathrm{p}})\) is given by E m ( u ) ( k p ), where 1 ≤ u ≤ n is determined as the unique integer satisfying the inequalities:
The final step now identifies the optimal power capacity, \(k_{\mathrm{p}}^ \ast\) as the maximizer of:
Federal policy support mechanisms
Germany only provides modest incentives for battery storage installations 33 . Yet, as shown above, our calculations indicate that the large difference between retail rates and feed-in tariffs makes subsidies are no longer necessary for further deployment of behind-the-meter residential storage.
Battery installations in the U.S. qualify for an Investment Tax Credit, ITC, provided the battery can be classified as solar equipment. Formally, the federal tax credit can be represented as:
where \(\bar G\) denotes the total energy generated on an average day by the solar PV system, that is,
provided \(\frac{{\bar G}}{{k_{\mathrm{e}}}} \ge .75\) , while \(A(k_{\mathrm{e}}|\bar G) = 0\) otherwise. Thus, the partial tax credit under the ITC drops to zero if more than 25% of the battery’s energy storage capacity would be available after absorbing the entire energy generated by the incumbent solar PV system. On a levelized basis, the ITC then modifies the daily profit margin so that:
Provided the battery storage system is not oversized relative to the incumbent solar PV system, the ITC will simply scale both LCOPC and LCOEC by the factor .7 (i.e., .7 = 1−.3).
California’s SGIP
California’s Self-Generation Incentive Program (SGIP) offers investors a rebate for battery storage systems. The amount to be rebated depends on the duration of the storage system. For a ( k p , k e ) battery system, the daily profit margin in California, denoted by PM c , then becomes:
Here, LS c ( k p , k e ) denotes the levelized subsidies available in California for a ( k p , k e ) battery storage system that qualifies as solar equipment under the ITC rules.
Data availability
The source data underlying Fig. 1, Tables 1 and 2, and Supplementary Figs. 1 and 2 are provided as a Source Data file.
Code availability
Computational code is available upon request to the corresponding author.
Braff, W. A., Mueller, J. M. & Trancik, J. E. Value of storage technologies for wind and solar energy. Nat. Clim. Change 6 , 964–969 (2016).
Article ADS Google Scholar
Hernandez, R. R., Hoffacker, M. K. & Field, C. B. Efficient use of land to meet sustainable energy needs. Nat. Clim. Change 5 , 353–358 (2015).
Chu, S., Cui, Y. & Liu, N. The path towards sustainable energy. Nat. Mater. 16 , 16–22 (2017).
Bumpus, A. G. & Comello, S. D. Emerging clean energy technology investment trends. Nat. Clim. Change 7 , 382–385 (2017).
Hoppmann, J., Volland, J., Schmidt, T. S. & Hoffmann, V. H. The economic viability of battery storage for residential solar photovoltaic systems—a review and a simulation model. Renew. Sustain. Energy Rev. 39 , 1101–1118 (2014).
Article Google Scholar
Behrangrad, M. A review of demand side management business models in the electricity market. Renew. Sustain. Energy Rev. 47 , 270–283 (2015).
Wu, D., Kintner-Meyer, M., Yang, T. & Balducci, P. Economic analysis and optimal sizing for behind-the-meter battery storage. In 2016 IEEE Power and Energy Society General Meeting: Boston, Massachusetts, United States of America (PESGM) 1–5 (2016).
Merei, G., Moshövel, J., Magnor, D. & Sauer, D. U. Optimization of self-consumption and techno-economic analysis of pv-battery systems in commercial applications. Appl. Energy 168 , 171–178 (2016).
Burger, S. P. & Luke, M. Business models for distributed energy resources: a review and empirical analysis. Energy Policy 109 , 230–248 (2017).
Hesse, H. C. et al. Economic optimization of component sizing for residential battery storage systems. Energies http://www.mdpi.com/1996-1073/10/7/835 (2017).
O’Shaughnessy, E., Cutler, D., Ardani, K. & Margolis, R. Solar plus: optimization of distributed solar pv through battery storage and dispatchable load in residential buildings. Appl. Energy 213 , 11–21 (2018).
Stephan, A., Battke, B., Beuse, M., Clausdeinken, J. H. & Schmidt, T. S. Limiting the public cost of stationary battery deployment by combining applications. Nat. Energy 1 , 160–179 (2016).
GTM Research. U.S. energy storage monitor: Q2 2018 full report. Tech. Rep. , Greentech Media (GTM) Research (Boston, Massachusetts, United States of America, 2018).
CPUC. Decision adopting successor to net energy metering tariff. http://docs.cpuc.ca.gov/PublishedDocs/Published/G000/M158/K181/158181678.pdf (2016). California Public Utilities Commission Ruling R.14-07-002.
Ossenbrink, J., Finnsson, S., Bening, C. R. & Hoffmann, V. H. Delineating policy mixes: Contrasting top-down and bottom-up approaches to the case of energy-storage policy in california. Res. Policy . http://www.sciencedirect.com/science/article/pii/S0048733318300957 (2018).
Weniger, J., Tjaden, T. & Quaschning, V. Sizing of residential pv battery systems. Energy Procedia 46 , 78–87, http://www.sciencedirect.com/science/article/pii/S1876610214001763 (2014).
Dufo-López, R. & Bernal-Agustín, J. L. Techno-economic analysis of grid-connected battery storage. Energy Convers. Manag. 91 , 394–404 (2015).
Belderbos, A., Delarue, E., Kessels, K. & D’haeseleer, W. Levelized cost of storage – introducing novel metrics. Energy Econ. 67 , 287–299 (2017).
Comello, S. & Reichelstein, S. Cost competitiveness of residential solar pv: the impact of net metering restrictions. Renew. Sustain. Energy Rev. 75 , 46–57 (2017).
Lazard. Lazard’s levelized cost of storage analysis. Version 4.0. Tech. Rep . (Lazard Ltd., 2018).
Curry, C. Lithium-ion battery costs and market: squeezed margins seek technology improvements & new business models. Tech. Rep . (Bloomberg New Energy Finance, 2017).
Schmidt, O., Hawkes, A., Gambhir, A. & Staffell, I. The future cost of electrical energy storage based on experience rates. Nat. Energy https://www.nature.com/articles/nenergy2017110 (2017).
Kittner, N., Lill, F. & Kammen, D. Energy storage deployment and innovation for the clean energy transition. Nat. Energy https://doi.org/10.1038/nenergy.2017.125 (2017).
Pawel, I. The cost of storage—how to calculate the levelized cost of stored energy (lcoe) and applications to renewable energy generation. Energy Procedia 46 , 68–77, http://www.sciencedirect.com/science/article/pii/S1876610214001751 (2014).
Julch, V. Comparison of electricity storage options using levelized cost of storage (lcos) method. Appl. Energy 183 , 1594–1606 (2016).
Lazard. Lazard’s levelized cost of storage analysis. Version 3.0. Tech. Rep . (Lazard Ltd. 2017).
Lai, C. S. & McCulloch, M. D. Levelized cost of electricity for solar photovoltaic and electrical energy storage. Appl. Energy 190 , 191–203 (2017).
Obi, M., Jensen, S., Ferris, J. & Bass, R. Calculation of levelized costs of electricity for various electrical energy storage systems. Renew. Sustain. Energy Rev. 67 , 908–920 (2017).
World Energy Resources. E-storage: shifting from cost to value for wind and solar applications (London, United Kingdom, 2016).
Mundada, A. S., Shah, K. K. & Pearce, J. Levelized cost of electricity for solar photovoltaic, battery and cogen hybrid systems. Renew. Sustain. Energy Rev. 57 , 692–703 (2016).
Tervo, E. et al. An economic analysis of residential photovoltaic systems with lithium ion battery storage in the United States. Renew. Sustain. Energy Rev. 94 , 1057–1066 (2018).
BMWi. Eeg 2017 feed-in tariff.://www.res-legal.eu/search-by-country/germany/single/s/res-e/t/promotion/aid/feed-in-tariff-eeg-feed-in-tariff/lastp/135/ (2017).
KfW. KfW-Programm Erneuerbare Energien “Speicher” (2015).
Figgener, J. et al. Wissenschaftliches mess-und evaluierungsprogramm solarstromspeicher 2.0. jahresbericht 2018. Tech. Rep . (Institut fur Stromrichtertechnik und Elektrische Antriebe RWTH Aachen and Speicher Monitoring, 2018).
Denholm, P., Eichman, J. &Margolis, R. Evaluating the technical and economic performance of pv plus storage power plants. Tech. Rep . NREL/TP-6A20-68737. (National Renewable Energy Laboratory, 2017).
CPUC. 2017 self-generation incentive program handbook v3. Tech. Rep . (California Public Utilities Commission, 2017).
Glenk, G. & Reichelstein, S. Economics of converting renewable power to hydrogen. Nat. Energy . https://doi.org/10.1038/s41560-019-0326-1 (2019).
Dietrich, A. & Weber, C. What drives profitability of grid-connected residential pv storage systems? a closer look with focus on germany. Energy Econ. 74 , 399–416 (2018).
Xu, B., Oudalov, A., Ulbig, A., Andersson, G. & Kirschen, D. S. Modeling of lithium-ion battery degradation for cell life assessment. IEEE Trans. Smart Grid 9 , 1131–1140 (2018).
Neubauer, J. & Simpson, M. Deployment of behind-the-meter energy storage for demand charge reduction. Natl Renew. Energy Lab. Tech. Rep. NREL/TP-5400-63162 (2015).
Download references
Acknowledgements
The authors gratefully acknowledge financial support from the Sustainable Energy Initiative at the Stanford Graduate School of Business and the Steyer-Taylor Center for Energy Policy and Finance at Stanford University. We are grateful to Gunther Glenk, Felix Baumgarte and three anonymous reviewers for helpful comments and feedback.
Author information
Authors and affiliations.
Stanford Graduate School of Business, 655 Knight Way, Stanford, CA, 94305, USA
Stephen Comello & Stefan Reichelstein
University of Mannheim, Schloss, Ostfluegel, Mannheim, 68131, Germany
- Stefan Reichelstein
You can also search for this author in PubMed Google Scholar
Contributions
Both authors contributed equally to the development of the research question, approach, and manuscript development. S.R. took the lead in developing the model framework; S.C. took the lead with the empirical analysis.
Corresponding author
Correspondence to Stephen Comello .
Ethics declarations
Competing interests.
The authors declare no competing interests.
Additional information
Journal peer review information : Nature Communications thanks Rodica Loisel, Kelsey Horowitz and other anonymous reviewer(s) for their contribution to the peer review of this work. Peer reviewer reports are available.
Publisher’s note: Springer Nature remains neutral with regard to jurisdictional claims in published maps and institutional affiliations.
Supplementary information
Supplementary information, peer review file, source data, source data, rights and permissions.
Open Access This article is licensed under a Creative Commons Attribution 4.0 International License, which permits use, sharing, adaptation, distribution and reproduction in any medium or format, as long as you give appropriate credit to the original author(s) and the source, provide a link to the Creative Commons license, and indicate if changes were made. The images or other third party material in this article are included in the article’s Creative Commons license, unless indicated otherwise in a credit line to the material. If material is not included in the article’s Creative Commons license and your intended use is not permitted by statutory regulation or exceeds the permitted use, you will need to obtain permission directly from the copyright holder. To view a copy of this license, visit http://creativecommons.org/licenses/by/4.0/ .
Reprints and permissions
About this article
Cite this article.
Comello, S., Reichelstein, S. The emergence of cost effective battery storage. Nat Commun 10 , 2038 (2019). https://doi.org/10.1038/s41467-019-09988-z
Download citation
Received : 12 August 2018
Accepted : 12 April 2019
Published : 02 May 2019
DOI : https://doi.org/10.1038/s41467-019-09988-z
Share this article
Anyone you share the following link with will be able to read this content:
Sorry, a shareable link is not currently available for this article.
Provided by the Springer Nature SharedIt content-sharing initiative
This article is cited by
Effect of flow rate control modes on a vanadium redox flow battery based on a numerical model.
- Quanshui Huang
Korean Journal of Chemical Engineering (2024)
A Stepwise Cosimulation Framework for Modeling Critical Elements in Copper Porphyry Deposits
- Milena Nasretdinova
- Nasser Madani
- Mohammad Maleki
Natural Resources Research (2024)
Applications of the levelized cost concept
- Gunther Friedl
- Lukas Kemmer
Journal of Business Economics (2023)
Reversible Power-to-Gas systems for energy conversion and storage
- Gunther Glenk
Nature Communications (2022)
By submitting a comment you agree to abide by our Terms and Community Guidelines . If you find something abusive or that does not comply with our terms or guidelines please flag it as inappropriate.
Quick links
- Explore articles by subject
- Guide to authors
- Editorial policies
Sign up for the Nature Briefing newsletter — what matters in science, free to your inbox daily.

- IEEE Xplore Digital Library
- IEEE Standards
- IEEE Spectrum

Join IEEE Smart Grid for Free!
- Operations Webinars
Performance, Safety & Degradation of Li-ion Battery Storage
Presented by : Daiwon Choi and Vish Viswanathan
This webinar will be focused on reliability of electrochemical energy storage system (ESS) based on Li-ion batteries, which is currently the most widely deployed system. In this webinar, the authors focus on two specific areas, 1) fundamentals of Li-ion battery operation and degradation mechanisms, 2) examples of efficiency, performance and comparison of different Li-ion battery chemistries under standardized frequency regulation (FR), peak shaving (PS) and electric vehicle (EV) drive cycles. The lifecycle and degradation mechanisms derived from capacity, round trip efficiency (RTE), resistance, charge/discharge energy and total utilized energy of the battery chemistries will be compared. Performance and safety of electrical energy storage systems will also be addressed, reviewing applicable standards and gridscale storage data.
Click Here to Stream
Download Slides
INTENDED AUDIENCE:
Power industry community members interested in applying newer emerging technologies for improving core objectives: maintaining and improving the efficiency and reliability of electric power systems cost effectively. These stakeholders include energy storage and advanced power electronics manufacturers, renewable and ESS project developers, power systems planners and operators, utility engineers and managers, and electric industry regulatory staff.
- Li-ion Battery
- Electrochemical Energy Storage
- Battery reliability testing
- Renewables Integration
- Performance
- White Papers
Become a Presenter
If you'd like to be a presenter, please fill out this form .

We apologize for the inconvenience...
To ensure we keep this website safe, please can you confirm you are a human by ticking the box below.
If you are unable to complete the above request please contact us using the below link, providing a screenshot of your experience.
https://ioppublishing.org/contacts/
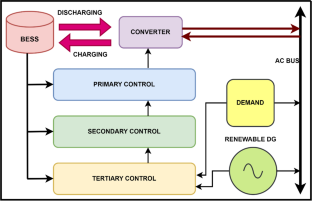
Computation and Optimization of BESS in the Modeling of Renewable Energy Based Framework
- Review article
- Published: 06 January 2024
- Volume 31 , pages 2385–2416, ( 2024 )
Cite this article

- Vivek Saxena ORCID: orcid.org/0000-0002-5769-1864 1 , 2 ,
- Narendra Kumar 1 &
- Uma Nangia 1
Incorporating Battery Energy Storage Systems (BESS) into renewable energy configurations offers numerous apparent advantages. Nonetheless, to fully capitalize on these advantages, it is imperative to implement management strategies that facilitate optimal system performance. Various approaches and methods can be employed to optimize the functionality of BESS within renewable energy systems (RES), encompassing specific dispatch goals as well as financial, technical, or hybrid objectives. These optimization methods are categorized into three primary groups: directed search-based (DSB), probabilistic, and rule-based strategies. Historically, research has heavily focused on tailoring systems based on the renewable energy sources for specific purposes, such as distributed generation (DG). This investigation not only offers a comprehensive overview of battery management measures but also assesses these endeavors in terms of their alignment with application objectives and the chosen optimization strategy. This approach unveils connections between distinct optimization goals and preferred strategies. The findings reveal that DSB approaches and control strategies, commonly employed for technical objectives, are more likely to succeed in addressing financial goals. Moreover, the extent to which a problem can be analytically defined emerges as a critical consideration. Upon comparing the merits and demerits of different reported optimization methodologies, it becomes evident that hybrid approaches, amalgamating the strengths of various optimization techniques, will increasingly shape future operational procedures. This study not only equips researchers with valuable insights into viable optimization strategies for forthcoming generation applications but also provides a cutting-edge overview of battery applications and optimization techniques.
This is a preview of subscription content, log in via an institution to check access.
Access this article
Price includes VAT (Russian Federation)
Instant access to the full article PDF.
Rent this article via DeepDyve
Institutional subscriptions
Modeling and Optimization Methods for Controlling and Sizing Grid-Connected Energy Storage: A Review
State-of-art review of the optimization methods to design the configuration of hybrid renewable energy systems (hress).

A Review of Mathematical Optimization Applications in Renewable Energy-Powered Microgrids
Abbreviations.
Adaptive Linear Neuron
Approximate Dynamic Programming
Artificial Intelligence
Battery Energy Management Systems
Battery Management Systems
Compressed Air Energy Storage
Demand Response
Energy Storage Systems
Electric Vehicle
Fuzzy Logic Controller
Genetic Algorithms
General Algebraic Modelling System
Hyper-Heuristic
Hybrid Renewable Energy System
Integer Programming
Linear Programming
Mixed-Integer Linear Programming
Machine Learning
Model Predictive Control
Sodium-Sulfur
Nonlinear Programming
Non-Dominated Sorting Genetic Algorithm
On-Load Tap Changers
Particle Swarm Optimization
Photovoltaic
Quadratic Programming
Resistor–Capacitor
Stochastic Dynamic Programming
Suberu YM, Mustafa MW, Bashir N (2014) Energy storage systems for renewable energy power sector integration and mitigation of intermittency. Renew Sustain Energy Rev 35:499–514. https://doi.org/10.1016/j.rser.2014.04.009
Article Google Scholar
Luo X, Wang J, Dooner M, Clarke J (2015) Overview of current development in electrical energy storage technologies and the application potential in power system operation. Appl Energy 137:511–536. https://doi.org/10.1016/j.apenergy.2014.09.081
Toledo OM, Oliveira Filho D, Diniz ASAC (2010) Distributed photovoltaic generation and energy storage systems: a review. Renew Sustain Energy Rev 14:506–511. https://doi.org/10.1016/j.rser.2009.08.007
Tan X, Li Q, Wang H (2013) Advances and trends of energy storage technology in Microgrid. Int J Electr Power Energy Syst 44:179–191. https://doi.org/10.1016/j.ijepes.2012.07.015
Mahto T, Mukherjee V (2015) Energy storage systems for mitigating the variability of isolated hybrid power system. Renew Sustain Energy Rev 51:1564–1577. https://doi.org/10.1016/j.rser.2015.07.012
Berrada A, Loudiyi K (2016) Operation, sizing, and economic evaluation of storage for solar and wind power plants. Renew Sustain Energy Rev 59:1117–1129
Divya KC, Østergaard J (2009) Battery energy storage technology for power systems—an overview. Electr Power Syst Res 79(3):511–520. https://doi.org/10.1016/j.epsr.2008.09.017
Das T, Krishnan V, McCalley JD (2015) Assessing the benefits and economics of bulk energy storage technologies in the power grid. Appl Energy 139:104–118. https://doi.org/10.1016/j.apenergy.2014.11.017
Del Rosso AD, Eckroad SW (2014) Energy storage for relief of transmission congestion. IEEE Trans Smart Grid 5(3):1138–1146. https://doi.org/10.1109/TSG.2013.2277411
Stephan A, Battke B, Beuse MD, Clausdeinken JH, Schmidt TS (2016) Limiting the public cost of stationary battery deployment by combining applications. Nat Energy 1:16079. https://doi.org/10.1038/nenergy.2016.79
Saxena V, Kumar N, Nangia U (2022) recent trends in the optimization of renewable distributed generation: a review. Ingen Invest 42(3):e97702. https://doi.org/10.15446/ing.investig.97702
Poullikkas A (2013) A comparative overview of large-scale battery systems for electricity storage. Renew Sustain Energy Rev 27:778–788. https://doi.org/10.1016/j.rser.2013.07.017
Lawder MT, Suthar B, Northrop PWC, De S, Hoff CM, Leitermann O et al (2014) Battery energy storage system (BESS) and battery management system (BMS) for grid-scale applications. Proc IEEE 102(6):1014–1030. https://doi.org/10.1109/JPROC.2014.2317451
Dai H, Jiang B, Hu X, Lin X, Wei X, Pecht M (2020) Advanced battery management strategies for a sustainable energy future: Multilayer design concepts and research trends. Renew Sustain Energy Rev. https://doi.org/10.1016/j.rser.2020.110480
Zakeri B, Syri S (2015) Electrical energy storage systems: a comparative life cycle cost analysis. Renew Sustain Energy Rev 42:569–596. https://doi.org/10.1016/j.rser.2014.10.011
Duffner F, Wentker M, Greenwood M, Leker J (2020) Battery cost modeling: a review and directions for future research. Renew Sustain Energy Rev 127:109872. https://doi.org/10.1016/j.rser.2020.109872
Sani SB, Celvakumaran P, Ramachandaramurthy VK, Walker S, Alrazi B, Jia Y et al (2020) Energy storage system policies: way forward and opportunities for emerging economies. J Energy Storage 32:101902. https://doi.org/10.1016/j.est.2020.101902
Díaz-González F, Sumper A, Gomis-Bellmunt O, Villafáfila-Robles R (2012) A review of energy storage technologies for wind power applications. Renew Sustain Energy Rev 16(4):2154–2171. https://doi.org/10.1016/j.rser.2012.01.029
Zhao H, Wu Q, Hu S, Xu H, Rasmussen CN (2015) Review of energy storage system for wind power integration support. Appl Energy 137:545–553. https://doi.org/10.1016/j.apenergy.2014.04.103
de Siqueira LMS, Peng W (2021) Control strategy to smooth wind power output using battery energy storage system: a review. J Energy Storage 35:102252. https://doi.org/10.1016/j.est.2021.102252
Barra PHA, de Carvalho WC, Menezes TS, Fernandes RAS, Coury DV (2021) A review on wind power smoothing using high-power energy storage systems. Renew Sustain Energy Rev 137:110455. https://doi.org/10.1016/j.rser.2020.110455
Lamsal D, Sreeram V, Mishra Y, Kumar D (2019) Output power smoothing control approaches for wind and photovoltaic generation systems: a review. Renew Sustain Energy Rev 113:109245. https://doi.org/10.1016/j.rser.2019.109245
Akram U, Nadarajah M, Shah R, Milano F (2020) A review on rapid responsive energy storage technologies for frequency regulation in modern power systems. Renew Sustain Energy Rev 120:109626. https://doi.org/10.1016/j.rser.2019.109626
Dai H, Jiang B, Hu X, Lin X, Wei X, Pecht M (2021) Advanced battery management strategies for a sustainable energy future: multilayer design concepts and research trends. Renew Sustain Energy Rev 138:110480. https://doi.org/10.1016/j.rser.2020.110480
Hoppmann J, Volland J, Schmidt TS, Hoffmann VH (2014) The economic viability of battery storage for residential solar photovoltaic systems—a review and a simulation model. Renew Sustain Energy Rev 39:1101–1118. https://doi.org/10.1016/j.rser.2014.07.068
Coppez G, Chowdhury S, Chowdhury SP (2010) Review of battery storage optimisation in distributed generation. In: 2010 Joint international conference on power electronics, drives and energy systems & 2010 power, India, pp 1–6. https://doi.org/10.1109/PEDES.2010.5712406
Hajiaghasi S, Salemnia A, Hamzeh M (2019) Hybrid energy storage system for microgrids applications: a review. J Energy Storage 21:543–570. https://doi.org/10.1016/j.est.2018.12.017
Zhang L, Hu X, Wang Z, Ruan J, Ma C, Song Z et al (2021) Hybrid electrochemical energy storage systems: an overview for smart grid and electrified vehicle applications. Renew Sustain Energy Rev 139:110581. https://doi.org/10.1016/j.rser.2020.110581
Naval N, Yusta JM (2021) Virtual power plant models and electricity markets—a review. Renew Sustain Energy Rev 149:111393. https://doi.org/10.1016/j.rser.2021.111393
Lee JW, Haram MHSM, Ramasamy G, Thiagarajah SP, Ngu EE, Lee YH (2021) Technical feasibility and economics of repurposed electric vehicles batteries for power peak shaving. J Energy Storage 40:102752. https://doi.org/10.1016/j.est.2021.102752
Zhang Z, Ding T, Zhou Q, Sun Y, Qu M, Zeng Z et al (2021) A review of technologies and applications on versatile energy storage systems. Renew Sustain Energy Rev 148:111263. https://doi.org/10.1016/j.rser.2021.111263
Tan KM, Babu TS, Ramachandaramurthy VK, Kasinathan P, Solanki SG, Raveendran SK (2021) Empowering smart grid: a comprehensive review of energy storage technology and application with renewable energy integration. J Energy Storage 39:102591. https://doi.org/10.1016/j.est.2021.102591
Bidram A, Davoudi A (2012) Hierarchical structure of microgrids control system. IEEE Trans Smart Grid 3:1963–1976. https://doi.org/10.1109/TSG.2012.2197425
Morstyn T, Hredzak B, Agelidis VG (2016) Control strategies for microgrids with distributed energy storage systems: an overview. IEEE Trans Smart Grid. https://doi.org/10.1109/TSG.2016.2637958
Dunn B, Kamath H, Tarascon J-M (2011) Electrical energy storage for the grid: a battery of choices. Science 334(80):928–935. https://doi.org/10.1126/science.1212741
Ferreira HL, Garde R, Fulli G, Kling W, Lopes JP (2013) Characterisation of electrical energy storage technologies. Energy 53:288–298. https://doi.org/10.1016/j.energy.2013.02.037
Jenkins DP, Fletcher J, Kane D (2008) Lifetime prediction and sizing of lead–acid batteries for microgeneration storage applications. IET Renew Power Gener 2:191–200. https://doi.org/10.1049/iet-rpg:20080021
Dogger JD, Roossien B, Nieuwenhout FDJ (2011) Characterization of Li-ion batteries for intelligent management of distributed grid-connected storage. IEEE Trans Energy Convers 26:256–263. https://doi.org/10.1109/TEC.2009.2032579
Hatta T (2012) Applications of sodium-sulfur batteries. In: Transmission and distribution conference and exposition (T&D), 2012 IEEE PES, pp 1–3. https://doi.org/10.1109/TDC.2012.6281442
Stan AI, Swierczynski M, Stroe DI, Teodorescu R, Andreasen SJ (2014) Lithium ion battery chemistries from renewable energy storage to automotive and back-up power applications: an overview. In: 2014 International conference on optimization of electrical and electronic equipment (OPTIM), pp 713–720. https://doi.org/10.1109/OPTIM.2014.6850936
Baccino F, Marinelli M, Nørgård P, Silvestro F (2014) Experimental testing procedures and dynamic model validation for vanadium redox flow battery storage system. J Power Sources 254:277–286. https://doi.org/10.1016/j.jpowsour.2013.12.078
Schreiber M, Harrer M, Whitehead A, Bucsich H, Dragschitz M, Seifert E et al (2012) Practical and commercial issues in the design and manufacture of vanadium flow batteries. J Power Sources 206:483–489. https://doi.org/10.1016/j.jpowsour.2010.12.032
Li Y, Sun L, Cao L, Bao J, Skyllas-Kazacos M (2021) Dynamic model based membrane permeability estimation for online SOC imbalances monitoring of vanadium redox flow batteries. J Energy Storage 39:102688. https://doi.org/10.1016/j.est.2021.102688
Liu W, Placke T, Chau KT (2022) Overview of batteries and battery management for electric vehicles. Energy Rep 8:4058–4084. https://doi.org/10.1016/j.egyr.2022.03.016
Zou C, Zhang L, Hu X, Wang Z, Wik T, Pecht M (2018) A review of fractional-order techniques applied to lithium-ion batteries, lead-acid batteries, and supercapacitors. J Power Sources 390:286–296. https://doi.org/10.1016/j.jpowsour.2018.04.033
Wang Y, Tian J, Sun Z, Wang L, Xu R, Li M et al (2020) A comprehensive review of battery modeling and state estimation approaches for advanced battery management systems. Renew Sustain Energy Rev 131:110015. https://doi.org/10.1016/j.rser.2020.110015
Shahjalal M, Shams T, Islam ME, Alam W, Modak M, Hossain SB et al (2021) A review of thermal management for Li-ion batteries: prospects, challenges, and issues. J Energy Storage 39:102518. https://doi.org/10.1016/j.est.2021.102518
Nguyen TA, Crow ML, Elmore AC (2015) Optimal sizing of a vanadium redox battery system for microgrid systems. IEEE Trans Sustain Energy 6:729–737. https://doi.org/10.1109/TSTE.2015.2404780
Cervone A, Carbone G, Santini E, Teodori S (2016) Optimization of the battery size for PV systems under regulatory rules using a Markov-Chains approach. Renew Energy 85:657–665. https://doi.org/10.1016/j.renene.2015.07.007
Rodrigues EMG, Osório GJ, Godina R, Bizuayehu AW, Lujano-Rojas JM, Matias JCO et al (2015) Modelling and sizing of NaS (sodium sulfur) battery energy storage system for extending wind power performance in Crete Island. Energy 90:1606–1617. https://doi.org/10.1016/j.energy.2015.06.116
Aaslid P, Geth F, Korpås M, Belsnes MM, Fosso OB (2020) Non-linear charge-based battery storage optimization model with bi-variate cubic spline constraints. J Energy Storage 32:101979. https://doi.org/10.1016/j.est.2020.101979
Li X (2012) Fuzzy adaptive Kalman filter for wind power output smoothing with battery energy storage system. IET Renew Power Gener 6:340–347. https://doi.org/10.1049/iet-rpg.2011.0177
Eghtedarpour N, Farjah E (2012) Control strategy for distributed integration of photovoltaic and energy storage systems in DC micro-grids. Renew Energy 45:96–110. https://doi.org/10.1016/j.renene.2012.02.017
Fares RL, Webber ME (2014) A flexible model for economic operational management of grid battery energy storage. Energy 78:768–776. https://doi.org/10.1016/j.energy.2014.10.072
Lee SJ, Kim JH, Kim CH, Kim SK, Kim ES, Kim DU et al (2016) Coordinated control algorithm for distributed battery energy storage systems for mitigating voltage and frequency deviations. IEEE Trans Smart Grid 7:1713–1722. https://doi.org/10.1109/TSG.2015.2429919
Sebastián R (2016) Application of a battery energy storage for frequency regulation and peak shaving in a wind diesel power system. IET Gener Transm Distrib 10:764–770. https://doi.org/10.1049/iet-gtd.2015.0435
Abdeltawab HH, Mohamed YARI (2015) Market-oriented energy management of a hybrid wind-battery energy storage system via model predictive control with constraint optimizer. IEEE Trans Ind Electron 62:6658–6670. https://doi.org/10.1109/TIE.2015.2435694
Tao L, Ma J, Cheng Y, Noktehdan A, Chong J, Lu C (2017) A review of stochastic battery models and health management. Renew Sustain Energy Rev 80:716–732. https://doi.org/10.1016/j.rser.2017.05.127
Xu B, Oudalov A, Ulbig A, Andersson G, Kirschen D (2016) Modeling of lithium-ion battery degradation for cell life assessment. IEEE Trans Smart Grid. https://doi.org/10.1109/TSG.2016.2578950
IRENA (2015) Battery storage for renewables: market status and technology outlook. http://www.irena.org/documentdownloads/publications/irena_battery_storage_report_2015.pdf
Sullivan JP, Fenton KR, Gabaly FEG, Harris TC, Hayden CC et al (2015) The science of battery degradation. Unlimited Release. Sandia National Laboratories, Albuquerque
Krieger EM, Cannarella J, Arnold CB (2013) A comparison of lead-acid and lithium-based battery behavior and capacity fade in off-grid renewable charging applications. Energy 60:492–500. https://doi.org/10.1016/j.energy.2013.08.029
Nuhic A, Terzimehic T, Soczka-Guth T, Buchholz M, Dietmayer K (2013) Health diagnosis and remaining useful life prognostics of lithium-ion batteries using data-driven methods. J Power Sources 239:680–688. https://doi.org/10.1016/j.jpowsour.2012.11.146
Cotton B (2012) VRLA battery lifetime fingerprints—Part 1. In: Intelec 2012. IEEE. https://doi.org/10.1109/INTLEC.2012.6374495
Ru Y, Kleissl J, Martinez S (2013) Storage size determination for grid-connected photovoltaic systems. IEEE Trans Sustain Energy 4:68–81. https://doi.org/10.1109/TSTE.2012.2199339
Stroe DI, Knap V, Swierczynski M, Stroe AI, Teodorescu R (2017) Operation of a grid-connected lithium-ion battery energy storage system for primary frequency regulation: a battery lifetime perspective. IEEE Trans Ind Appl 53:430–438. https://doi.org/10.1109/TIA.2016.2616319
Dragicevic T, Pandzic H, Skrlec D, Kuzle I, Guerrero JM, Kirschen DS (2014) Capacity optimization of renewable energy sources and battery storage in an autonomous telecommunication facility. IEEE Trans Sustain Energy 5:1367–1378. https://doi.org/10.1109/TSTE.2014.2316480
Li S, He H, Su C, Zhao P (2020) Data driven battery modeling and management method with aging. Appl Energy 275:115340. https://doi.org/10.1016/j.apenergy.2020.115340
Wang S, Guo D, Han X, Lu L, Sun K, Li W et al (2020) Impact of battery degradation models on energy management of a grid-connected DC microgrid. Energy 207:118228. https://doi.org/10.1016/j.energy.2020.118228
Lujano-Rojas JM, Dufo-López R, Atencio-Guerra JL, Rodrigues EMG, Bernal- Agustín JL, Catalão JPS (2016) Operating conditions of lead-acid batteries in the optimization of hybrid energy systems and microgrids. Appl Energy 179:590–600. https://doi.org/10.1016/j.apenergy.2016.07.018
Luo F, Meng K, Dong ZY, Zheng Y, Chen Y, Wong KP (2015) Coordinated operational planning for wind farm with battery energy storage system. IEEE Trans Sustain Energy 6:253–262. https://doi.org/10.1109/TSTE.2014.2367550
Yao DL, Choi SS, Tseng KJ, Lie TT (2012) Determination of short-term power dispatch schedule for a wind farm incorporated with dual-battery energy storage scheme. IEEE Trans Sustain Energy 3:74–84. https://doi.org/10.1109/TSTE.2011.2163092
Zhang X, Yuan Y, Hua L, Cao Y, Qian K (2017) On generation schedule tracking of wind farms with battery energy storage systems. IEEE Trans Sustain Energy 8:341–353. https://doi.org/10.1109/TSTE.2016.2598823
Barnes AK, Balda JC, Escobar-Mejia A (2015) A semi-markov model for control of energy storage in utility grids and microgrids with PV generation. IEEE Trans Sustain Energy 6:546–556. https://doi.org/10.1109/TSTE.2015.2393353
Wang G, Ciobotaru M, Agelidis VG (2014) Power smoothing of large solar PV plant using hybrid energy storage. IEEE Trans Sustain Energy 5:834–842. https://doi.org/10.1109/TSTE.2014.2305433
Zhang Z, Wang J, Wang X (2015) An improved charging/discharging strategy of lithium batteries considering depreciation cost in day-ahead microgrid scheduling. Energy Convers Manag 105:675–684. https://doi.org/10.1016/j.enconman.2015.07.079
Feng X, Gooi HB, Chen S (2015) Capacity fade-based energy management for lithium-ion batteries used in PV systems. Electr Power Syst Res 129:150–159. https://doi.org/10.1016/j.epsr.2015.08.011
Mazzola S, Vergara C, Astolfi M, Li V, Perez-Arriaga I, Macchi E (2017) Assessing the value of forecast-based dispatch in the operation of off-grid rural microgrids. Renew Energy 108:116–125. https://doi.org/10.1016/j.renene.2017.02.040
Comodi G, Giantomassi A, Severini M, Squartini S, Ferracuti F, Fonti A et al (2015) Multi-apartment residential microgrid with electrical and thermal storage devices: experimental analysis and simulation of energy management strategies. Appl Energy 137:854–866. https://doi.org/10.1016/j.apenergy.2014.07.068
Hanna R, Kleissl J, Nottrott A, Ferry M (2014) Energy dispatch schedule optimization for demand charge reduction using a photovoltaic-battery storage system with solar forecasting. Sol Energy 103:269–287. https://doi.org/10.1016/j.solener.2014.02.020
Teleke S, Baran ME, Bhattacharya S, Huang AQ (2010) Optimal control of battery energy storage for wind farm dispatching. IEEE Trans Energy Convers 25:787–794. https://doi.org/10.1109/TEC.2010.2041550
Yuan Y, Zhang X, Ju P, Qian K, Fu Z (2012) Applications of battery energy storage system for wind power dispatchability purpose. Electr Power Syst Res 93:54–60. https://doi.org/10.1016/j.epsr.2012.07.008
Jiang Q, Gong Y, Wang H (2013) A battery energy storage system dual-layer control strategy for mitigating wind farm fluctuations. IEEE Trans Power Syst 28:3263–3273. https://doi.org/10.1109/TPWRS.2013.2244925
Baziar A, Kavousi-Fard A (2013) Considering uncertainty in the optimal energy management of renewable micro-grids including storage devices. Renew Energy 59:158–166. https://doi.org/10.1016/j.renene.2013.03.026
Lei Z, Yaoyu L (2013) Optimal energy management of wind-battery hybrid power system with two-scale dynamic programming. IEEE Trans Sustain Energy 4:765–773. https://doi.org/10.1109/TSTE.2013.2246875
Abdulla K, De Hoog J, Muenzel V, Suits F, Steer K, Wirth A et al (2016) Optimal operation of energy storage systems considering forecasts and battery degradation. IEEE Trans Smart Grid. https://doi.org/10.1109/TSG.2016.2606490
Wang Y, Dvorkin Y, Fernandez-Blanco R, Xu B, Qiu T, Kirschen D (2017) Look-ahead bidding strategy for energy storage. IEEE Trans Sustain Energy. https://doi.org/10.1109/TSTE.2017.2656800
Li T, Dong M (2016) Real-time residential-side joint energy storage management and load scheduling with renewable integration. IEEE Trans Smart Grid. https://doi.org/10.1109/TSG.2016.2550500
Sigrist L, Lobato E, Rouco L (2013) Energy storage systems providing primary reserve and peak shaving in small isolated power systems: an economic assessment. Int J Electr Power Energy Syst 53:675–683. https://doi.org/10.1016/j.ijepes.2013.05.046
Miranda I, Silva N, Leite H (2016) A holistic approach to the integration of battery energy storage systems in island electric grids with high wind penetration. IEEE Trans Sustain Energy 7:775–785. https://doi.org/10.1109/TSTE.2015.2497003
Kazemi M, Zareipour H, Amjady N, Rosehart WD, Ehsan M (2017) Operation scheduling of battery storage systems in joint energy and ancillary services markets. IEEE Trans Sustain Energy. https://doi.org/10.1109/TSTE.2017.2706563
Kazemi M, Zareipour H (2017) Long-term scheduling of battery storage systems in energy and regulation markets considering battery’s lifespan. IEEE Trans Smart Grid. https://doi.org/10.1109/TSG.2017.2724919
Riffonneau Y, Bacha S, Barruel F, Delaille A (2009) Energy flow management in grid connected PV systems with storage - a deterministic approach. In: 2009 IEEE international conference on industrial technology. IEEE, pp 1–6. https://doi.org/10.1109/ICIT.2009.4939609
Mariaud A, Acha S, Ekins-Daukes N, Shah N, Markides CN (2017) Integrated optimisation of photovoltaic and battery storage systems for UK commercial buildings. Appl Energy 199:466–478. https://doi.org/10.1016/j.apenergy.2017.04.067
Zhou B, Liu X, Cao Y, Li C, Chung CY, Chan KW (2016) Optimal scheduling of virtual power plant with battery degradation cost. IET Gener Transm Distrib 10:712–725. https://doi.org/10.1049/iet-gtd.2015.0103
Mallol-Poyato R, Salcedo-Sanz S, Jiménez-Fernández S, Díaz-Villar P (2015) Optimal discharge scheduling of energy storage systems in MicroGrids based on hyper-heuristics. Renew Energy 83:13–24. https://doi.org/10.1016/j.renene.2015.04.009
Jen-Hao T, Shang-Wen L, Dong-Jing L, Yong-Qing H (2013) Optimal charging/discharging scheduling of battery storage systems for distribution systems interconnected with sizeable PV generation systems. IEEE Trans Power Syst 28:1425–1433. https://doi.org/10.1109/TPWRS.2012.2230276
Zheng M, Meinrenken CJ, Lackner KS (2015) Smart households: dispatch strategies and economic analysis of distributed energy storage for residential peak shaving. Appl Energy 147:246–257. https://doi.org/10.1016/j.apenergy.2015.02.039
Brenna M, Foiadelli F, Longo M, Zaninelli D (2016) Energy storage control for dispatching photovoltaic power. IEEE Trans Smart Grid. https://doi.org/10.1109/TSG.2016.2611999
Alam MJE, Muttaqi KM, Sutanto D (2014) A novel approach for ramp-rate control of solar PV using energy storage to mitigate output fluctuations caused by cloud passing. IEEE Trans Energy Convers 29:507–518. https://doi.org/10.1109/TEC.2014.2304951
Abedlrazek SA, Kamalasadan S (2016) A weather based optimal storage management algorithm for PV capacity firming. IEEE Trans Ind Appl. https://doi.org/10.1109/TIA.2016.2598139
Hansang L, Byoung Yoon S, Sangchul H, Seyong J, Byungjun P, Gilsoo J (2012) Compensation for the power fluctuation of the large scale wind farm using hybrid energy storage applications. IEEE Trans Appl Supercond 22:5701904. https://doi.org/10.1109/TASC.2011.2180881
Teleke S, Baran ME, Bhattacharya S, Huang AQ (2010) Rule-based control of battery energy storage for dispatching intermittent renewable sources. IEEE Trans Sustain Energy 1(2):117–124. https://doi.org/10.1109/TSTE.2010.2061880
Bo L, Shahidehpour M (2005) Short-term scheduling of battery in a grid-connected PV/battery system. IEEE Trans Power Syst 20:1053–1061. https://doi.org/10.1109/TPWRS.2005.846060
Osório GJ, Rodrigues EMG, Lujano-Rojas JM, Matias JCO, Catalão JPS (2015) New control strategy for the weekly scheduling of insular power systems with a battery energy storage system. Appl Energy 154:459–470. https://doi.org/10.1016/j.apenergy.2015.05.048
Shuai H, Fang J, Ai X, Wen J, He H (2019) Optimal real-time operation strategy for microgrid: an ADP-based stochastic nonlinear optimization approach. IEEE Trans Sustain Energy 10:931–942. https://doi.org/10.1109/TSTE.2018.2855039
Wang B, Zhang C, Dong ZY (2020) Interval optimization based coordination of demand response and battery energy storage system considering SOC management in a microgrid. IEEE Trans Sustain Energy 11:2922–2931. https://doi.org/10.1109/TSTE.2020.2982205
Abu Abdullah M, Muttaqi KM, Sutanto D, Agalgaonkar AP (2015) An effective power dispatch control strategy to improve generation schedulability and supply reliability of a wind farm using a battery energy storage system. IEEE Trans Sustain Energy 6:1093–1102. https://doi.org/10.1109/TSTE.2014.2350980
Zhang X, Bao J, Wang R, Zheng C, Skyllas-Kazacos M (2016) Dissipativity based distributed economic model predictive control for residential microgrids with renewable energy generation and battery energy storage. Renew Energy. https://doi.org/10.1016/j.renene.2016.05.006
Sandgani MR, Sirouspour S (2017) Coordinated optimal dispatch of energy storage in a network of grid-connected microgrids. IEEE Trans Sustain Energy 8:1166–1176. https://doi.org/10.1109/TSTE.2017.2664666
Lujano-Rojas JM, Dufo-López R, Bernal-Agustín JL, Catalão JPS (2017) Optimizing daily operation of battery energy storage systems under real-time pricing schemes. IEEE Trans Smart Grid 8:316–330. https://doi.org/10.1109/TSG.2016.2602268
Al Essa MJM (2018) Management of charging cycles for grid-connected energy storage batteries. J Energy Storage 18:380–388. https://doi.org/10.1016/j.est.2018.05.019
Zhu Y, Zhao D, Li X, Wang D (2019) Control-limited adaptive dynamic programming for multi-battery energy storage systems. IEEE Trans Smart Grid 10:4235–4244. https://doi.org/10.1109/TSG.2018.2854300
Zeynali S, Rostami N, Ahmadian A, Elkamel A (2020) Two-stage stochastic home energy management strategy considering electric vehicle and battery energy storage system: an ANN-based scenario generation methodology. Sustain Energy Technol Assess 39:100722. https://doi.org/10.1016/j.seta.2020.100722
Nguyen S, Peng W, Sokolowski P, Alahakoon D, Yu X (2020) Optimizing rooftop photovoltaic distributed generation with battery storage for peer-to-peer energy trading. Appl Energy 228:2567–2580. https://doi.org/10.1016/j.apenergy.2018.07.042
Zhang N, Leibowicz BD, Hanasusanto GA (2020) Optimal residential battery storage operations using robust data-driven dynamic programming. IEEE Trans Smart Grid 11:1771–1780. https://doi.org/10.1109/TSG.2019.2942932
Nath S, Wu J (2020) Online battery scheduling for grid-connected photo-voltaic systems. J Energy Storage 31:101713. https://doi.org/10.1016/j.est.2020.101713
Riffonneau Y, Bacha S, Barruel F, Ploix S (2011) Optimal power flow management for grid connected PV systems with batteries. IEEE Trans Sustain Energy 2:309–320. https://doi.org/10.1109/TSTE.2011.2114901
Sani Hassan A, Cipcigan L, Jenkins N (2017) Optimal battery storage operation for PV systems with tariff incentives. Appl Energy 203:422–441. https://doi.org/10.1016/j.apenergy.2017.06.043
Khalilpour R, Vassallo A (2016) Planning and operation scheduling of PV-battery systems: a novel methodology. Renew Sustain Energy Rev 53:194–208. https://doi.org/10.1016/j.rser.2015.08.015
Li T, Dong M (2015) Real-time energy storage management with renewable integration: finite-time horizon approach. IEEE J Sel Areas Commun 33:2524–2539. https://doi.org/10.1109/JSAC.2015.2481212
Yuan Y, Zhang X, Ju P, Li Q, Qian K, Fu Z (2014) Determination of economic dispatch of wind farm-battery energy storage system using Genetic Algorithm. Int Trans Electr Energy Syst 24:264–280. https://doi.org/10.1002/etep.1696
Correa-florez CA, Gerossier A, Michiorri A, Kariniotakis G (2018) Stochastic operation of home energy management systems including battery cycling. Appl Energy 225:1205–1218. https://doi.org/10.1016/j.apenergy.2018.04.130
Hossain A, Roy H, Squartini S, Zaman F (2019) Energy scheduling of community microgrid with battery cost using particle swarm optimization. Appl Energy 254:113723. https://doi.org/10.1016/j.apenergy.2019.113723
Cao J, Harrold D, Fan Z, Morstyn T, Healey D, Li K (2020) Deep reinforcement learning-based energy storage arbitrage with accurate lithium-ion battery degradation model. IEEE Trans Smart Grid 11:4513–4521. https://doi.org/10.1109/TSG.2020.2986333
Kim JS, Yang H, Choi SG (2017) Distributed real-time stochastic optimization based ESS management strategy for residential customers. In: 2017 19th International conference on advanced communication technology 2017, pp 321–325. https://doi.org/10.23919/ICACT.2017.7890107
Maheshwari A, Paterakis NG, Santarelli M, Gibescu M (2020) Optimizing the operation of energy storage using a non-linear lithium-ion battery degradation model. Appl Energy 261:114360. https://doi.org/10.1016/j.apenergy.2019.114360
Arteaga J, Zareipour H (2019) A price-maker/price-taker model for the operation of battery storage systems in electricity markets. IEEE Trans Smart Grid 10:6912–6920. https://doi.org/10.1109/TSG.2019.2913818
Zhang YJ, Zhao C, Tang W, Low SH (2016) Profit maximizing planning and control of battery energy storage systems for primary frequency control. IEEE Trans Smart Grid. https://doi.org/10.1109/TSG.2016.2562672
Bitaraf H, Rahman S (2017) Reducing curtailed wind energy through energy storage and demand response. IEEE Trans Sustain Energy. https://doi.org/10.1109/TSTE.2017.2724546
Zhang C, Xu Y, Dong ZY, Ma J (2016) Robust operation of microgrids via two-stage coordinated energy storage and direct load control. IEEE Trans Power Syst. https://doi.org/10.1109/TPWRS.2016.2627583
Barsali S, Giglioli R, Lutzemberger G, Poli D, Valenti G (2017) Optimised operation of storage systems integrated with MV photovoltaic plants, considering the impact on the battery lifetime. J Energy Storage 12:178–185. https://doi.org/10.1016/j.est.2017.05.003
He G, Chen Q, Kang C, Xia Q, Poolla K (2017) Cooperation of wind power and battery storage to provide frequency regulation in power markets. IEEE Trans Power Syst 32:3559–3568. https://doi.org/10.1109/TPWRS.2016.2644642
Zafar R, Ravishankar J, Fletcher JE, Pota HR (2020) Multi-timescale voltage stability-constrained Volt/VAR optimization with battery storage system in distribution grids. IEEE Trans Sustain Energy 11:868–878. https://doi.org/10.1109/TSTE.2019.2910726
Darcovich K, Kenney B, MacNeil DD, Armstrong MM (2015) Control strategies and cycling demands for Li-ion storage batteries in residential micro-cogeneration systems. Appl Energy 141:32–41. https://doi.org/10.1016/j.apenergy.2014.11.079
Leadbetter J, Swan L (2012) Battery storage system for residential electricity peak demand shaving. Energy Build 55:685–692. https://doi.org/10.1016/j.enbuild.2012.09.035
Teki VK, Maharana MK, Panigrahi CK (2020) Study on home energy management system with battery storage for peak load shaving. Mater Today Proc. https://doi.org/10.1016/j.matpr.2020.08.377
Uddin M, Romlie MF, Abdullah MF, Tan C, Sha GM, Bakar AHA (2020) A novel peak shaving algorithm for islanded microgrid using battery energy storage system. Energy 196:1–13. https://doi.org/10.1016/j.energy.2020.117084
Samanta H, Bhattacharjee A, Pramanik M, Das A (2020) Internet of Things based smart energy management in a vanadium redox flow battery storage integrated bio-solar microgrid. J Energy Storage 32:101967. https://doi.org/10.1016/j.est.2020.101967
Taylor Z, Akhavan-Hejazi H, Cortez E, Alvarez L, Ula S, Barth M et al (2019) Customer-side SCADA-assisted large battery operation optimization for distribution feeder peak load shaving. IEEE Trans Smart Grid 10:992–1004. https://doi.org/10.1109/TSG.2017.2757007
Cai Z, Bussar C, Stöcker P, Moraes L, Magnor D, Leuthold M et al (2015) Application of battery storage for compensation of forecast errors of wind power generation in 2050. Energy Proc 73:208–17. https://doi.org/10.1016/j.egypro.2015.07.673
Reihani E, Sepasi S, Roose LR, Matsuura M (2016) Energy management at the distribution grid using a battery energy storage system (BESS). Int J Electr Power Energy Syst 77:337–344. https://doi.org/10.1016/j.ijepes.2015.11.035
Kou P, Gao F, Guan X (2015) Stochastic predictive control of battery energy storage for wind farm dispatching: using probabilistic wind power forecasts. Renew Energy 80:286–300. https://doi.org/10.1016/j.renene.2015.02.001
Abbey C, Strunz K, Joos G (2009) A knowledge-based approach for control of two-level energy storage for wind energy systems. IEEE Trans Energy Convers 24:539–547. https://doi.org/10.1109/TEC.2008.2001453
Dan W, Shaoyun G, Hongjie J, Chengshan W, Yue Z, Ning L et al (2014) A demand response and battery storage coordination algorithm for providing microgrid tie-line smoothing services. IEEE Trans Sustain Energy 5:476–486. https://doi.org/10.1109/TSTE.2013.2293772
Jae Woong S, Youngho C, Seog-Joo K, Sang Won M, Kyeon H (2013) Synergistic control of SMES and battery energy storage for enabling dispatchability of renewable energy sources. IEEE Trans Appl Supercond 23:5701205. https://doi.org/10.1109/TASC.2013.2241385
Jannati M, Hosseinian SH, Vahidi B, Li G (2016) ADALINE (ADAptive Linear NEuron)-based coordinated control for wind power fluctuations smoothing with reduced BESS (battery energy storage system) capacity. Energy 101:1–8. https://doi.org/10.1016/j.energy.2016.01.100
Dicorato M, Forte G, Pisani M, Trovato M (2012) Planning and operating combined wind-storage system in electricity market. IEEE Trans Sustain Energy 3:209–217. https://doi.org/10.1109/TSTE.2011.2179953
Teleke S, Baran ME, Huang AQ, Bhattacharya S, Anderson L (2009) Control strategies for battery energy storage for wind farm dispatching. IEEE Trans Energy Convers 24:725–732. https://doi.org/10.1109/TEC.2009.2016000
Teleke S, Baran ME, Bhattacharya S, Huang AQ (2010) Rule-based control of battery energy storage for dispatching intermittent renewable sources. IEEE Trans Sustain Energy 1:117–124. https://doi.org/10.1109/TSTE.2010.2061880
Arifujjaman M (2015) A comprehensive power loss, efficiency, reliability and cost calculation of a 1 MW/500 kWh battery based energy storage system for frequency regulation application. Renew Energy 74:158–169. https://doi.org/10.1016/j.renene.2014.07.046
Liu W, Liu Y (2020) Hierarchical model predictive control of wind farm with energy storage system for frequency regulation during black-start. Electr Power Energy Syst 119:105893. https://doi.org/10.1016/j.ijepes.2020.105893
Boyle J, Littler T, Foley A (2020) Battery energy storage system state-of-charge management to ensure availability of frequency regulating services from wind farms. Renew Energy 160:1119–1135. https://doi.org/10.1016/j.renene.2020.06.025
Engels J, Claessens B, Deconinck G (2020) Optimal combination of frequency control and peak shaving with battery storage systems. IEEE Trans Smart Grid 11:3270–3279. https://doi.org/10.1109/TSG.2019.2963098
Krata J, Saha TK (2019) Real-time coordinated voltage support with battery energy storage in a distribution grid equipped with medium-scale PV generation. IEEE Trans Smart Grid 10:3486–3497. https://doi.org/10.1109/TSG.2018.2828991
Xu Y, Hu J, Gu W, Su W, Liu W (2016) Real-time distributed control of battery energy storage systems for security constrained DC-OPF. IEEE Trans Smart Grid. https://doi.org/10.1109/TSG.2016.2593911
Zhu Y, Liu C, Sun K, Shi D, Wang Z (2019) Optimization of battery energy storage to improve power system oscillation damping. IEEE Trans Sustain Energy 10(2):1015–1024. https://doi.org/10.1109/TSTE.2018.2858262
Shayeghi H, Monfaredi F, Dejamkhooy A, Sha M, Catalão JPS (2021) Assessing hybrid supercapacitor-battery energy storage for active power management in a wind-diesel system. Electr Power Energy Syst. https://doi.org/10.1016/j.ijepes.2020.106391
Georgiou GS, Christodoulides P, Kalogirou SA (2020) Optimizing the energy storage schedule of a battery in a PV grid-connected nZEB using linear programming. Energy 208:118177. https://doi.org/10.1016/j.energy.2020.118177
Mégel O, Mathieu JL, Andersson G (2015) Scheduling distributed energy storage units to provide multiple services under forecast error. Int J Electr Power Energy Syst 72:48–57. https://doi.org/10.1016/j.ijepes.2015.02.010
Grillo S, Pievatolo A, Tironi E (2016) Optimal storage scheduling using Markov decision processes. IEEE Transactions on Sustainable Energy 7(2):755–764. https://doi.org/10.1109/TSTE.2015.2497718
Böcker B, Kippelt S, Weber C, Rehtanz C (2017) Storage valuation in congested grids. IEEE Trans Smart Grid. https://doi.org/10.1109/TSG.2017.2721982
Malysz P, Sirouspour S, Emadi A (2014) An optimal energy storage control strategy for grid-connected microgrids. IEEE Trans Smart Grid 5:1785–1796. https://doi.org/10.1109/TSG.2014.2302396
Moradi H, Esfahanian M, Abtahi A, Zilouchian A (2018) Optimization and energy management of a standalone hybrid microgrid in the presence of a battery storage system: Battery State of Charge Distributed Energy resources. Energy 147:226–238. https://doi.org/10.1016/j.energy.2018.01.016
Engels J, Claessens B, Deconinck G (2019) Combined stochastic optimization of frequency control and self-consumption with a battery. IEEE Trans Smart Grid 10:1971–1981. https://doi.org/10.1109/TSG.2017.2785040
Olivella-Rosell P, Rullan F, Lloret-Gallego P, Prieto-Araujo E, Ferrer-San-José R, Barja-Martinez S et al (2020) Centralized and distributed optimization for aggregated flexibility services provision. IEEE Trans Smart Grid 11:3257–3269. https://doi.org/10.1109/TSG.2019.2962269
Liang Z, Chen H, Wang X, Chen S, Zhang C (2020) Risk-based uncertainty set optimization method for energy management of hybrid AC/DC microgrids with uncertain renewable generation. IEEE Trans Smart Grid 11:1526–1542. https://doi.org/10.1109/TSG.2019.2939817
Kusakana K (2020) Optimal peer-to-peer energy management between grid-connected prosumers with battery storage and photovoltaic systems. J Energy Storage 32:101717. https://doi.org/10.1016/j.est.2020.101717
Xu X, Hu W, Cao D, Huang Q, Liu Z, Liu W et al (2020) Scheduling of wind-battery hybrid system in the electricity market using distributionally robust optimization. Renew Energy 156:47–56. https://doi.org/10.1016/j.renene.2020.04.057
Duong T, Khambadkone AM (2013) Energy management for lifetime extension of energy storage system in micro-grid applications. IEEE Trans Smart Grid 4:1289–1296. https://doi.org/10.1109/TSG.2013.2272835
Zou J, Peng C, Shi J, Xin X, Zhang Z (2015) State-of-charge optimising control approach of battery energy storage system for wind farm. IET Renew Power Gener 9:647–652. https://doi.org/10.1049/iet-rpg.2014.0202
Saxena V, Kumar N, Nangia U (2023) An extensive data-based assessment of optimization techniques for distributed generation allocation: conventional to modern. Arch Comput Methods Eng 30:675–701. https://doi.org/10.1007/s11831-022-09812-w
Bo Z, Xuesong Z, Jian C, Caisheng W, Li G (2013) Operation optimization of standalone microgrids considering lifetime characteristics of battery energy storage system. IEEE Trans Sustain Energy 4:934–943. https://doi.org/10.1109/TSTE.2013.2248400
Tan X, Wu Y, Tsang DHK (2016) Pareto optimal operation of distributed battery energy storage systems for energy arbitrage under dynamic pricing. IEEE Trans Parallel Distrib Syst 27:2103–2115. https://doi.org/10.1109/TPDS.2015.2478785
Zhang F, Wang G, Meng K, Zhao J, Xu Z, Dong ZY et al (2016) Improved cycle control and sizing scheme for wind energy storage system based on multi-objective optimization. IEEE Trans Sustain Energy. https://doi.org/10.1109/TSTE.2016.2636878
Ju C, Wang P, Goel L, Xu Y (2017) A two-layer energy management system for microgrids with hybrid energy storage considering degradation costs. IEEE Trans Smart Grid. https://doi.org/10.1109/TSG.2017.2703126
Purvins A, Sumner M (2013) Optimal management of stationary lithium-ion battery system in electricity distribution grids. J Power Sources 242:742–755. https://doi.org/10.1016/j.jpowsour.2013.05.097
Wächter A, Biegler LT (2006) On the implementation of an interior-point filter line-search algorithm for large-scale nonlinear programming. Math Program 106:25–57. https://doi.org/10.1007/s10107-004-0559-y
Article MathSciNet Google Scholar
Gurobi optimizer reference manual (n.d.) http://www.gurobi.com/ . Accessed 23 Mar 2018
Bellman R (1952) The theory of dynamic programming. Proc Natl Acad Sci USA 60:503–515
MathSciNet Google Scholar
Firoozian R (2009) State variable feedback control theory. In: Firoozian R (ed) Servo motors and industrial control theory. Springer, Boston, pp 43–58. https://doi.org/10.1007/978-0-387-85460-1_3
Chapter Google Scholar
Sadeghi J, Sadeghi S, Niaki STA (2014) Optimizing a hybrid vendor-managed inventory and transportation problem with fuzzy demand: an improved particle swarm optimization algorithm. Inf Sci 272:126–144. https://doi.org/10.1016/j.ins.2014.02.075
Bonyadi MR, Michalewicz Z (2017) Particle swarm optimization for single objective continuous space problems: a review. Evol Comput 25:1–54. https://doi.org/10.1162/EVCO_r_00180
Athari MH, Ardehali MM (2016) Operational performance of energy storage as function of electricity prices for on-grid hybrid renewable energy system by optimized fuzzy logic controller. Renew Energy 85:890–902. https://doi.org/10.1016/j.renene.2015.07.055
Afzali P, Anjom N, Rashidinejad M, Bakhshai A (2020) Techno-economic study driven based on available efficiency index for optimal operation of a smart grid in the presence of energy storage system. J Energy Storage 32:101853. https://doi.org/10.1016/j.est.2020.101853
Zheng QP, Wang J, Liu AL (2015) Stochastic optimization for unit commitment: a review. IEEE Trans Power Syst 30:1913–1924. https://doi.org/10.1109/TPWRS.2014.2355204
Bhardwaj A, Vikram Kumar K, Vijay Kumar S, Singh B, Khurana P (2012) Unit commitment in electrical power system-a literature review. In: 2012 IEEE international power engineering and optimization conference, Malaysia, pp 275–280. https://doi.org/10.1109/PEOCO.2012.6230874
Tran D, Zhou H, Khambadkone AM (2010) Energy management and dynamic control in Composite Energy Storage System for micro-grid applications. In: IECON 2010—36th annual conference of the IEEE Industrial Electronics Society, pp 1818–1824. https://doi.org/10.1109/IECON.2010.5675399
Saxena V, Kumar N, Nangia U (2022) An impact assessment of distributed generation in distribution network. In: Pandit M, Gaur MK, Rana PS, Tiwari A (eds) Artificial Intelligence and Sustainable Computing. Algorithms for Intelligent Systems. Springer, Singapore. https://doi.org/10.1007/978-981-19-1653-3_26
Saxena V, Kumar N, Nangia U (2021) Analysis of smart electricity grid framework unified with renewably distributed generation. In: Agrawal R, Kishore Singh C, Goyal A (eds) Advances in Smart Communication and Imaging Systems, vol 721. Lecture Notes in Electrical Engineering. Springer, Singapore. https://doi.org/10.1007/978-981-15-9938-5_68
Gabash A, Pu L (2013) Flexible optimal operation of battery storage systems for energy supply networks. IEEE Trans Power Syst 28:2788–2797. https://doi.org/10.1109/TPWRS.2012.2230277
Avril S, Arnaud G, Florentin A, Vinard M (2010) Multi-objective optimization of batteries and hydrogen storage technologies for remote photovoltaic systems. Energy 35:5300–5308. https://doi.org/10.1016/j.energy.2010.07.033
Kumar M, Diwania S, Sen S et al (2023) Emission-averse techno-economical study for an isolated microgrid system with solar energy and battery storage. Electr Eng 105:1883–1896. https://doi.org/10.1007/s00202-023-01785-8
Kumar M, Sen S, Jain H, Diwania S (2022) Optimal planning for building integrated microgrid system (BIMGS) for economic feasibility with renewable energy support. In: 2022 IEEE 10th Power India international conference (PIICON), New Delhi, India, pp 1–6. https://doi.org/10.1109/PIICON56320.2022.10045284
Kumbhar A, Dhawale PG, Kumbhar S, Patil U, Magdum P (2021) A comprehensive review: machine learning and its application in integrated power system. Energy Rep 7:5467–5474. https://doi.org/10.1016/j.egyr.2021.08.133
Saxena V, Kumar N, Nangia U (2022) An impact assessment of distributed generation in distribution network. In: Artificial intelligence and sustainable computing. algorithms for intelligent systems. Springer, Singapore. https://doi.org/10.1007/978-981-19-1653-3_26
Al-Saffar M, Musilek P (2020) Reinforcement learning-based distributed BESS management for mitigating overvoltage issues in systems with high PV penetration. IEEE Trans Smart Grid 11:2980–2994. https://doi.org/10.1109/TSG.2020.2972208
Download references
This research received no external funding.
Author information
Authors and affiliations.
Department of Electrical Engineering, Delhi Technological University, Delhi, India
Vivek Saxena, Narendra Kumar & Uma Nangia
Department of Electrical & Electronics Engineering, A.B.E.S. Engineering College, Ghaziabad, India
Vivek Saxena
You can also search for this author in PubMed Google Scholar
Corresponding author
Correspondence to Vivek Saxena .
Ethics declarations
Conflict of interest.
The author declares no conflict of interest.
Additional information
Publisher's note.
Springer Nature remains neutral with regard to jurisdictional claims in published maps and institutional affiliations.
Rights and permissions
Springer Nature or its licensor (e.g. a society or other partner) holds exclusive rights to this article under a publishing agreement with the author(s) or other rightsholder(s); author self-archiving of the accepted manuscript version of this article is solely governed by the terms of such publishing agreement and applicable law.
Reprints and permissions
About this article
Saxena, V., Kumar, N. & Nangia, U. Computation and Optimization of BESS in the Modeling of Renewable Energy Based Framework. Arch Computat Methods Eng 31 , 2385–2416 (2024). https://doi.org/10.1007/s11831-023-10046-7
Download citation
Received : 18 October 2023
Accepted : 28 November 2023
Published : 06 January 2024
Issue Date : May 2024
DOI : https://doi.org/10.1007/s11831-023-10046-7
Share this article
Anyone you share the following link with will be able to read this content:
Sorry, a shareable link is not currently available for this article.
Provided by the Springer Nature SharedIt content-sharing initiative
- Optimization
- Renewable Energy
- Find a journal
- Publish with us
- Track your research
Volume 4 Supplement 2
Proceedings of the Energy Informatics.Academy Conference Asia 2021
- Open access
- Published: 24 September 2021
Electric vehicles as distribution grid batteries: a reality check
- Prasad Prakash Malya 1 ,
- Laura Fiorini 2 ,
- Mohammadhadi Rouhani 3 &
- Marco Aiello 1
Energy Informatics volume 4 , Article number: 29 ( 2021 ) Cite this article
5467 Accesses
9 Citations
12 Altmetric
Metrics details
The current transition towards electric mobility implies that a significant portion of electricity is drawn by and stored in the electric vehicle’s (EV) batteries. Vehicle-to-grid (V2G) technologies can potentially give distribution system operators access to such energy to provide ancillary services, while remunerating the vehicle owners for their availability to participate. Although the benefits of stabilization and grid efficiency improvements are clear, is it appealing and lucrative for the vehicle owners to participate in such services? In this work, we answer this question by modelling the V2G system and performing economic projections of the possible benefits for EV owners. In particular, we present a novel way of parametrizing the electric vehicle driving profile and the V2G energy transfer to compute battery degradation costs. A profit model is developed to evaluate the profit earned by the vehicle owners offering their batteries. The profit is estimated on the basis of the owner’s inclination to buy and sell energy from the grid based on the electricity price. Using data of the German electricity market, we estimate a profit of 662 €/EV/Year for a vehicle with 100 kWh capacity, 95% battery round trip efficiency and driving 52 km per day. The remuneration is meaningful and can have the potential to encourage EV owners to participate in V2G service.
Introduction
The global “Energy Transition” envisions a gradual but complete moving from fossil to sustainable sources (German Federal Ministry for Economic Affairs and Energy (BMWi), 2019a ). Germany is at the forefront of such transition and one of the prominent players in the European energy market. With the deadline set to phase out nuclear energy by 2022 (German Federal Ministry for Economic Affairs and Energy (BMWi), 2019a ), Germany will have to rely on Renewable Energy Sources (RES) to meet its energy requirements. In 2018, 37.8% of electricity consumed by Germany was produced from RES (German Federal Ministry for Economic Affairs and Energy (BMWi), 2019b ). Since the power output from RES depends on the weather conditions and the geographical location, the uncertainty is high, in turn hindering overall reliability. In order to mitigate the fluctuations in RES power output, robust, decentralized, and intermittent power sources are required. Currently most of the energy markets use traditional ancillary services to overcome imbalance on the grid (Raineri et al., 2006 ). Recently, several authors have proposed the integration of EVs’ batteries as flexible storage for the distribution grid (Mwasilu et al., 2014 ; Kamboj et al., 2011 ; Madawala & Thrimawithana, 2011 ). The main advantage of such Vehicle-to-grid (V2G) interactions is the accommodation of the uncertainties and fluctuations of RES. V2G can also provide grid ancillary services like black-start capability, frequency and voltage regulation.
EVs can act as a distributed source of energy reducing the transportation and maintenance cost for the Distribution System Operators (DSO). Recently V2G has gained traction again due to the decreasing cost and increasing capacity of the EV batteries. The cost of EV batteries have dropped from 1000 $/kWh in 2010 to 273 $/kWh in 2016 and the downward trend continues (Curry, 2017 ). The capacity of the modern day EV battery is up to 100 kWh (Iclodean et al., 2017 ) and most of the EVs are not utilized for 95% of the time (Barter, 2013 ). According to the International Energy Agency, the estimated number of EVs will be 250 Million by 2030 (IEA, 2019 ). With this vast amount of electric energy drawn and stored in EVs, V2G will have a central role in the future energy markets. There are two ways in which EVs can participate in V2G services. The first one is the V2G energy arbitrage where EVs sell the excess energy to the grid when the electricity price is considered high. And, the EV buys electricity from the grid when the electricity price is low. The second way is the V2G ancillary service. Here, the EV discharges or charges the energy to or from the grid to maintain a constant grid frequency. Despite its multi-functional applications, V2G has not been implemented beyond limited proof of concepts (Kester et al., 2018 ). While research on the topic has considerably increased, there are still technical and social-economical challenges to be addressed.
State of the art
The authors of (Almehizia & Snodgrass, 2018 ) determine that using V2G technology to sell electricity to the grid is profitable. Based on USA data, Peterson et al. model the economic and net social welfare benefits of V2G participation at off-peak hours (Peterson et al., 2010 ). They conclude that the savings are too small to encourage user participation. Kiaee et al. show that the charging cost of the EV can be reduced by participating in V2G schemes (Kiaee et al., 2015 ). Uddin et al. prove that the battery life of an EV can be extended by participating in V2G service (Uddin et al., 2017 ) by discharging the EV battery to lower State Of Charge (SOC) under constraints. Finally, Latini et al. show that the V2G ancillary services are profitable in the Italian market (Latini et al., 2019 ). We compare the first four of these studies in terms of their assumptions and expected profit for the owner, as shown in Table 1 . For the fifth study this was not possible due to the available data.
The previous studies assume a technical need for V2G interaction and provide economic models and analyses. Though a number of important factors were not considered. The first factor is the inevitable battery degradation caused by V2G services. An exception is in (Almehizia & Snodgrass, 2018 ), where a fixed battery degradation cost is considered for the calculation of the profit. Though a fixed degradation cost is an important simplification. Furthermore, the economic feasibility of V2G depends on the market regulation and the remuneration schemes. Analysis done for a specific market cannot be applied to the others. Hence, each of the energy markets have to be analysed individually. Finally, vehicles are, in most cases, privately owned and independent of the distribution system operator. This means that involving them in the grid can only happen on a voluntary basis. The will to participate therefore must come from an incentive. The most obvious one is an economic one. Therefore, the question arises: Is the possible remuneration to the vehicle owner for participating in the vehicle to grid scheme significant, if at all positive?
Contribution and organization
The present work addresses the question from an economic point of view, using actual market values from the German electricity market and using a model as close as possible to the physical system. Most notably, the economic feasibility of V2G energy arbitrage considers a dynamic battery degradation model. The study is purely techno-economical and does not consider psychological effects of incentives. For instance, a sustainability-based incentive that rewards EV users for their societal involvement and their level of greenness in non-monetary terms might be more effective than economic incentives. Such non-technical consideration, while very important, are considered outside the scope of the paper.
The core contribution of the present work is that of quantifying economically what the possible return for an EV owner is for participating in an energy distribution market and offering V2G services. For such quantification, a dynamic battery energy model is used to estimate the battery degradation from the V2G energy arbitrage. We remark that the battery degradation model is from the state of the art in the field (Xu et al., 2016 ); what the present work contributes is a novel way of translating EV driving profiles and V2G energy transactions into battery degradation values. Finally, a simulation based on the given model, battery costs and actual energy market data from Germany is presented.
The remainder of the paper is organized into four sections. Section 2 introduces the model and illustrates the methodology used for the profit calculation. Section 3 gives the description of the case study and the setup and running of the simulations. Section 4 presents and analyzes the results of the simulations. A discussion of the results and general conclusions are offered in Section 5.
Methodology
Profit is the financial gain defined as the difference between the amount earned and the amount spent. Revenue is the income generated by the sale of goods or services. During the V2G energy arbitrage, the revenue earned is the amount paid to the EV owner for the electric energy discharged (sold) to the grid. Neglecting the infrastructure and the maintenance cost, profit is the difference between the revenue and the cost incurred by the EV owner for charging the EV battery and battery degradation cost. To improve the accuracy of the profit estimation one must consider the actual electricity price signal from the target market. The battery degradation cost is estimated by considering a dynamic battery degradation model. The factors which affect the profit from V2G energy arbitrage are parameterized and given as input to the profit model.
Profit model
Revenue generated from V2G energy arbitrage depends on the capacity of the EV battery and its efficiency, in addition to the electricity price, more formally:
where M is the number of discharge events; N m is the duration of discharge in hours corresponding to a discharge event m; ∆ SOC dis m is the percentage of EV battery capacity discharged to the grid corresponding to a discharge event m; p ( n ) is the selling price of the electricity for the corresponding hour n in Euros/kWh; discharge_eff is the battery discharge efficiency; and battery_capacity is the total capacity of the battery in kWh.
The charging cost is driven by the price at a given moment taking into account the small battery losses in the charging process, that is:
where M is the number of charge events; N m is the duration of charge in hours corresponding to a charge event m; ∆ SOC_charge m is the percentage of EV battery capacity charged from the grid to the EV for the corresponding charge event m; p(n) is the buying price of the electricity for the corresponding hour n in Euros/kWh; charge_eff is the battery charge efficiency which is the square root of the round trip efficiency; and battery_capacity is the total capacity of the battery in kWh.
The profit is the difference between the revenue and the cost incurred by the EV owner for charging the EV battery and battery degradation cost. To calculate the charging cost due to V2G energy arbitrage, first we calculate the charging cost ( cost v 2 g ) incurred when the vehicle participates in V2G energy arbitrage. The cost v 2 g includes the charging cost for driving the vehicle and V2G energy arbitrage. Second, we calculate the charging cost ( cost nv 2 g ) incurred when the vehicle does not participate in V2G energy arbitrage. The cost nv 2 g calculates the charging cost only due to the driving. The difference between these two gives the charging cost which is due to V2G energy arbitrage. Similarly, the battery_deg_cost v 2 g is the battery degradation cost including driving and V2G energy arbitrage. The battery_deg_cost nv 2 g is the battery degradation cost only due to vehicle driving. The difference between battery_deg_cost v 2 g and battery_deg_cost nv 2 g gives the battery degradation cost which is only due to the V2G energy arbitrage. The profit can be calculated as:
where revenue v 2 g is the revenue to the EV owner when EV participates in the V2G service from Eq. ( 1 ). With the eq. ( 3 ) the battery degradation and the charging cost due to EV driving is eliminated and the accuracy of the estimated profit is increased. The profit without considering the battery degradation cost can be calculated as per the Eq. ( 4 ). The value is helpful to evaluate the impact of battery degradation cost due to V2G energy arbitrage.
The battery degradation cost is calculated by Eq. ( 5 ). The equation is adapted from the one used in (Peterson et al., 2010 ):
where battery_replacement_cost is the cost of replacing the degraded battery with a new one; and battery_degradation is the amount of degradation given by the battery degradation model. The battery_degradation can take values from 0 to 0.2. The factor 0.2 is considered because most of the commercial EV battery’s End Of Life (EOL) is reached, when the battery loses 20% of its initial capacity (Fernández et al., 2013 ). The battery degradation is estimated by the dynamic battery degradation model explained in the next section.
In order to increase the efficiency of the profit model, the factors which affect the profit are parameterized. This enables the model to represent actual scenarios effectively. The parameters for the profit model are:
Price signal (€/kWh): Electricity price signal of the target energy market.
The profit is highly dependent on difference between buying and selling price.
Battery capacity (kWh): Capacity of the EV battery. The batteries with high capacity have higher residual energy available for energy arbitrage.
Round trip efficiency: Denotes the share of energy that can be successfully stored into or retrieved back from the battery.
Battery replacement cost (€): Cost of replacing the degraded battery with a new one.
EV driving distance (km/day): Denotes the usage of the EV battery for driving the vehicle. Shorter driving distance results in increased availability of energy for V2G energy arbitrage.
Maximum charge capacity (% of the battery capacity): Maximum amount of charge that can be put into the EV battery during energy arbitrage.
Battery discharge threshold (% of the battery capacity): The minimum remaining charge that has to be maintained at all times in the EV battery during energy arbitrage. This charge is used for emergency and unplanned travel.
Several scenarios can be represented by varying the above parameters which, in turn, are derived from actual EV driving patterns. A “driving pattern” is a graph of the state of an EV vehicle (discharging, charging or idle) with respect to time. Driving is part of discharging. The pattern is used to calculate the profit model flexibility depending on the specific use cases and EV owner’s requirements.
The charging and discharging scheme used for V2G energy arbitrage plays a huge role in increasing the profit. The simplest method is to discharge to the grid when the selling price is high and charge the EV when the buying price is low. However, this scheme is not efficient as it does not take the battery degradation into account. In the proposed profit model, the charge/discharge scheme calculates the profit due to different charge or discharge timings taking into account the corresponding battery degradation. The charge or discharge timing which results in the maximum profit is selected by the profit model for the profit calculation.
Battery degradation model
The battery degradation model encompasses parameters like temperature, State Of Charge (SOC), Depth of Discharge (DOD), Charging rate (C-rate), time, and the accumulated battery degradation. SOC denotes the amount of energy remaining in the battery. DOD indicates the percentage of energy taken out of the battery. C-rate denotes the rate at which the charge and discharge takes place. We use the battery degradation model from (Xu et al., 2016 ). This model is chosen for the following reasons. It considers temperature, SOC, DOD, time, and the accumulated battery degradation to estimate the current battery degradation. It supports the widely used battery type Lithium Manganese Oxide (LMO). It gives the incremental degradation due to specific charge or discharge events and allows configuring the parameters for each of the events. Hence it serves as a dynamic battery degradation estimation model which is desired for this work. However, the model has the following limitations: it does not consider C-rate dependency on degradation and the temperature dependency is not valid below 15 degrees Celsius. In spite of these two limitations, the model makes valid estimations of battery degradation. Formally, in the model battery degradation is given by:
where L is the degraded battery capacity after the charge/discharge event; L’ is the current degradation of the battery; and f d are the degradation components due to the EV’s state (e.g., EV is idle) and cycle aging (during charge or discharge). The f d is defined as:
where f cyc and f cal are the cyclic and calendar aging components, respectively. Cycle aging and calendar aging occur in parallel:
where DOD is the depth of charge for the cycle; SOC avg is the average SOC during the cycle; T avg is the average temperature during the cycle; N is the number of cycles; t is the duration of the cycle; and n is a half or full-cycle factor. The individual stress factors f DOD , f SOC , and f T are given by the following equations:
where k t is a constant; t is the duration for which calendar aging is being calculated; SOC is the SOC at with the battery is idle for the time t ; and T is the temperature of the battery during the calendar aging.
where k DOD 1 , k DOD 2 and k DOD 3 are constants, given in Table 2 .
where k SOC and SOC ref are constants.
with k T a constant; and T ref the Reference Temperature constant. The authors of (Xu et al., 2016 ) have derived the constants in the battery degradation equations based on curve fitting techniques. The constant coefficients derived for this model are listed in Table 2 . In the following simulation, the temperature is assumed to remain constant at the temperature of 28 degrees when the EV is driven, and at a constant temperature of 25 degrees when the EV is parked. Since the assumed temperatures are above the lower limit of the battery degradation model used (Xu et al., 2016 ), the limitations of the battery degradation model are not violated.
Simulations
The profit from the V2G energy arbitrage depends on several factors such as energy policy, EV battery, driving profile, battery capacity, battery chemistry and others. The more specific the assumptions are regarding these factors, the more realistic the profit values will be. In the present work, the profit due to energy arbitrage is calculated for the German energy market. Following are the assumptions made to derive the German case.
Assumptions
The driving patterns of the EV are fixed. The EV is fully charged from 23:00 h to 07:00 h, driven to office from 07:00 h to 08:00 h, parked at office till 17:00 h, driven back home from 17:00 h to 18:00 h and parked at home till 23:00 h.
The V2G energy arbitrage takes place only at the office from 08:00 h to 17:00 h. Ideally V2G can take place even after 17:00 h. Since, the SOC of the EV is already low when the EV arrives home, the possibility of V2G discharge event at home is less.
Only a discharge event or a discharge event followed by a charge event is possible in the span of V2G energy arbitrage. Each charge or discharge event lasts for one hour.
The charging and discharging current rate is assumed to remain constant during the V2G event.
The price signals from the German day ahead electricity market of 2019 are considered for the profit estimation. Since Germany does not have dual tariff prices, the selling and buying price of electricity is assumed to be the same at any instant to simulate the dual tariff.
Driving patterns
A predictable driving behaviour is observed in EV owners, who work at an office location five days a week. The driving pattern chosen for this model is similar to the one put forth by the authors of (Zhaoxi et al., 2015 ) and shown in Fig. 1 . We refer to the time frame in which V2G transaction can take place as “V2G window”. In the V2G window, the EV can either charge from or discharge to the grid. The maximum charging limit is 100% of the battery capacity and the minimum remaining capacity at any point of time is 10%. 10% of the capacity is set as a threshold to fulfil the need for unforeseen and emergency travel. The principle “sell before buy” which was considered in (Peterson et al., 2010 ) is used in this model. The “sell before buy” principle implies that EV always discharges to the minimum remaining capacity (10%) before charging the battery in the V2G window. The minimum remaining capacity is referred to as “battery discharge threshold”.

EV driving pattern in a day
With these assumptions, there are three distinct scenarios on how V2G energy arbitrage can occur:
No V2G: No charge or discharge event occurs in the V2G window, as shown in Fig. 2 . This case represents the situation where EV provides no V2G energy arbitrage.
V2G discharge only: Only one discharge event in the V2G window, as shown in Fig. 3 . Here, EV can only discharge to the grid but cannot charge from the grid.
V2G discharge and charge: A discharge event followed by a charge event in the V2G window, as shown in Fig. 4 . Here, EV can charge from and discharge to the grid.

SOC profile of an EV with no V2G service

SOC profile of an EV with one V2G discharge event

SOC profile of an EV with a V2G discharge followed by charge event
The charging event is required in the third case to make sure the EV has enough battery charge to drive back home. Within these cases, there are multiple V2G possibilities depending on when the charge or discharge events occur. The EV can immediately discharge to the grid after connecting or be idle for some time and then discharge. There is only one case for the No V2G scenario as there are no charge or discharge events. To assess all the possible cases for the other two scenarios, time variables are used to generate different combinations. The V2G discharge only scenario has two variables ‘a’ and ‘c’ which vary and ‘b’ is fixed to 1 as the discharge to the grid will always be done for an hour. Figure 3 illustrates the timing variables for the V2G discharge only scenario. For varying values of ‘a’ and ‘c’ there will be a unique V2G profile. The V2G discharge and charge scenario has three variables ‘a’, ‘c’ and ‘e’ and two fixed values ‘b’ and ‘d’ set to 1. Figure 4 illustrates the timing variables for this scenario. There will be a unique V2G profile for different values of ‘a’, ‘c’ and ‘e’. Since the V2G window is fixed, the sum of all variables should be equal to the V2G window. The possible number of V2G profiles in each scenario is shown in Table 3 .
Profit model simulation
The input parameters for the profit model are chosen in accordance to actual scenarios. The price signal of the German market for a number of days is given as input to the model. The model uses the single day price with one hour resolution for each day. The model creates the SOC profile based on the timings in Table 3 . Based on the SOC profile, the model separates the charge and discharge events and calculates the amount of energy transferred during each event.
The energy transferred is calculated based on the EV driving distance, SOC of the battery, and battery discharge threshold. The model employs the battery degradation model to give the amount of battery degradation for a specific SOC profile. The battery degradation model is used for the battery degradation computation according to the SOC profile, in turn giving the amount of degradation for the profit model. Finally, the profit is calculated with Eq. ( 3 ). Algorithm 1 lists the procedure used to determine the profit for a number of days for a specific EV and driving pattern. The simulation is illustrated next, for details we refer to (Malya, 2020 ).
Algorithm 1
Profit with battery degradation.
1: procedure PROFIT ( price_signal ).
2: Initialize the input parameters.
3: Generate the V2G profiles.
4: for Number of profiles do.
5: calculate the degradation cost per day
6: for Number of days do.
7: for Number of profiles do.
8: Calculate profit as per the Eq. ( 3 ) with the battery degradation costs calculated in Step 5.
9: for Number of days do.
10: Select the profile which gives the highest profit, Step 8.
11: Accumulate the profit without degradation using Eq. ( 4 ) for the selected profile.
12: Calculate the battery degradation with this profile considering the previous degradation.
13: Calculate the degradation cost from V2G using Eq. ( 5 ) ► battery_deg_cost v 2 g .
14: for Number of days do.
15: calculate the battery degradation without V2G
16: Calculate the battery degradation cost using Eq. ( 5 ). ► battery_deg_cost nv 2 g .
17: calculate the total profit as per the Eq. ( 3 )
We start the simulation assuming the specification of an EV similar to the 2016 Nissan leaf (24 kWh) model, which is one of the most popular EV (3rd in 2019 worldwide). The simulation is run to represent 365 days with the price signal from the German day ahead electricity market for 2019. The parameters used for the execution of the model are shown in Table 4 .
From the results, presented in Table 5 , it is observable that the profit considering the battery degradation is higher than without considering the battery degradation. This observation is anomalous and the reason behind this lies in the type of battery considered. LMO is highly sensitive to high temperature and SOC (Thompson, 2018 ). Storing energy at high temperatures and at high SOC will cause.
more degradation than discharging the battery to a lower SOC and maintaining this lower SOC. Participating in V2G energy arbitrage maintains the battery SOC at a lower value and hence reduces battery degradation.
It is thus important to perform a sensitivity analysis to understand how generic the model is and to consider more type of vehicles. In fact, an EV is defined by various specifications like capacity, efficiency, and energy consumption. There are plenty of EV manufacturers in the market with different battery specifications. It is necessary to consider these factors and analyze their contribution to determine the sensitivity of V2G profit. We perform a sensitivity analysis with respect to the capacity, battery efficiency, and driving distance. The qualitative (scatter plot) Random Sampling Method is used for the sensitivity analysis (Hamby, 1994 ). 216 combinations of input parameters: capacity, efficiency, and driving distance are selected, and the corresponding profit is calculated using the profit model. The plot of the output against the input parameters shows the parameter sensitivity. The capacity is varied from 16 kWh to 100 kWh and the efficiency is varied by 85% up to 100% and the driving distance in terms of DOD is varied by 5% up to 30%. Figure 5 shows the variation of profit. Considering the use case of DOD = 0.05, efficiency = 1, and battery capacity = 100 kWh and with battery degradation, a profit of 723.93 €/EV/year is estimated. The total energy transferred in this case is 30,665 kWh/year at 23.60 €/MWh. Achieving 100% efficiency is practically not possible. A more realistic case would be with driving DOD = 0.05, efficiency = 0.95, and battery capacity = 100 kWh, yielding a profit of 662.37 €/EV/year. The minimum profit case would be with driving DOD = 0.3, efficiency = 0.85, and battery capacity = 16 kWh. The estimated profit in this case is 113.00 €/EV/year and the energy transferred is 2314.47 kWh/year.

Variation of profit with respect to RTE, battery capacity and driving distance
A sensitivity analysis shows that, lower driving distance, higher efficiency, and higher capacity values result in higher profit to the EV owner. For every 1 % increase in the round trip efficiency, there is an increase of 1.62 Euros in profit. For every 1 kWh increase in battery capacity, the profit increases by 1.85 Euros. For every 1 km decrease in driving distance per trip, profit increases by 6.64 Euros. Fig. 6 summarizes the sensitivity of energy transferred per year with respect to the above parameters. For more details on the sensitivity analysis we refer to (Malya, 2020 ).

Variation of total energy transferred with respect to RTE, battery capacity and driving distance
We are now in a position to provide a first comparison with the state of the art. The comparison should be taken with a grain of salt as there is no direct comparison between the results, as the price signals, the EV specification and the considerations are different in each estimation. Nevertheless, it is useful to attempt a general comparison, as presented in Table 6 . The values of the state of the art and of the present study show that V2G energy arbitrage is profitable.
Along with V2G energy arbitrage, the EV can also participate in V2G ancillary services in the German energy market. Though, V2G ancillary services are not the main focus of this paper, we report only the main results and refer to (Malya, 2020 ) for the details. The primary frequency regulation ancillary services fetch a profit of − 2.05 € to 2.66 € for 184 days in 2019. Participating in secondary frequency regulation ancillary services yields a profit of 530.74 € to 534.02 € for the year 2019 and tertiary frequency regulation ancillary services generates a profit of 1373.02 € to 1376.30 € for the year 2019. The ancillary services result in more profit compared to V2G energy arbitrage because of the higher remuneration scheme.
Conclusions
The present study shows how the profit estimation for V2G energy arbitrage can be evaluated by considering the battery degradation cost and EV driving patterns.
The approach we proposed includes a dynamic battery degradation model to estimate battery degradation costs due to the V2G energy arbitrage. We consider the case where the EV owner controls the buying and selling of energy based on the German day-ahead market’s electricity price signal for the year 2019. The profit value for this case is significant, possibly indicating that the EV owner would be interested in participating in V2G energy arbitrage. In other terms, the answer to our original question “would an EV owner allow the use of his or her battery by the grid operator” is positive.
The profit earned does not only come from selling electricity to the grid but also from the savings from reduced battery degradation costs. With the LMO battery considered in this model, V2G energy arbitrage can improve the lifetime of the EV battery. However, this observation cannot be generalized for all battery types as the amount of degradation depends significantly on the chemical and physical characteristics of the battery. The sensitivity analysis results show that the profit increases with the capacity of the battery, the round trip efficiency, as well as with the decrease of the driving distance per day.
The profitability of the V2G energy arbitrage from EV owners’ perspective depends on factors like remuneration, battery degradation, battery specification, EV driving patterns and charging or discharging criteria. The profit evaluated changes as one of these factors changes. Without considering these factors, it is not possible to state if V2G energy arbitrage is profitable or not in general. Considering the German electricity price signals for the year 2019 and an EV with battery type LMO, this work evaluates that providing a price-based energy arbitrage is profitable for the EV owners.
Limitations
The economic models proposed in this article are general and can be used, in principle, for any market. On the other hand, the battery model is based on the LMO battery type. The profit model can be extended to battery degradation models of other battery types by translating the input and output parameters of the new battery degradation model to our profit model.
In the simulations, we have used fixed temperatures for the driving and parking state of vehicles. These temperatures are in line with the degradation model, but clearly do not represent all possible environmental conditions, especially extremely cold weathers.
The simulation results are based on a specific market, namely the German one. We expect the results to extend to energy markets with similar structures and prices to the German one, such as other European Union countries, Australia and New Zealand, and Japan, but this should be verified.
Future work
To overcome the limitations of the present study, it is important to consider other energy markets in addition to the German one. Particularly interesting might be markets with very different structures and pricing for energy such as the Middle East or former Soviet Union countries.
The model we proposed is purely an economic one. Since we are interested in incentives for the general public, one should also consider psychological and cultural factors. In other terms, the motivation of people to participate might be driven more strongly by social and sustainability incentives rather than purely economic ones. This should be verified with actual user studies which we leave open for future research.
Availability of data and materials
An extended treatment of the subject with details of the models and data used is the master thesis of the first author.
Abbreviations
Charging rate
Depth of Discharge
Distributed System Operator
End of Life
Electric Vehicles
Independent System Operator New England
Kilo Watt hour
Lithium Manganese Oxide
Nickel Cobalt Aluminum oxide
New York Independent System Operator
Pennsylvania, Jersey, Maryland Power Pool
Renewable Energy Sources
Round Trip Efficiency
State of Charge
Vehicle-to-Grid
Almehizia AA, Snodgrass J (2018) Investigation of V2G economical viability. In: 2018 IEEE Texas Power and Energy Conference (TPEC). IEEE, pp 1–6
Google Scholar
Barter P (2013) Cars are parked 95% of the time. Let’s check
Curry C (2017) Lithium-ion battery costs and market. Bloomberg New Energy Finance, p 5
Fernández I, Calvillo C, Sánchez-Miralles A, Boal J (2013) Capacity fade and aging models for electric batteries and optimal charging strategy for electric vehicles. Energy 60:35–43. https://doi.org/10.1016/j.energy.2013.07.068
Article Google Scholar
German Federal Ministry for Economic Affairs and Energy (BMWi). Unsere Energiewende: sicher, sauber, bezahlbar; 2019a. (accessed on 02.01.20). Available from: https://www.bmwi.de/Redaktion/EN/Dossier/energy-transition.html
German Federal Ministry for Economic Affairs and Energy (BMWi). Electricity Market of the Future; 2019b. (accessed on 02.01.20). Available from: https://www.bmwi.de/Redaktion/EN/Dossier/electricity-market-of-the-future.html
Hamby DM (1994) A review of techniques for parameter sensitivity analysis of environmental models. Environ Monit Assess 32(2):135–154. https://doi.org/10.1007/BF00547132
Iclodean C, Varga B, Burnete N, Cimerdean D, Jurchis B (2017) Comparison of Different Battery Types for Electric Vehicles. In: IOP conference series: materials science and engineering. vol. 252. IOP Publishing, p 012058
IEA. Global EV Outlook 2019; 2019. (accessed on 30.12.19). Available from: https://www.iea.org/reports/global-ev-outlook-2019
Kamboj S, Kempton W, Decker KS (2011) Deploying power grid-integrated electric vehicles as a multi-agent system. In: The 10th International Conference on Autonomous Agents and Multiagent Systems-Volume 1, pp 13–20
Kester J, Noel L, de Rubens GZ, Sovacool BK (2018) Promoting vehicle to grid (V2G) in the Nordic region: expert advice on policy mechanisms for accelerated diffusion. Energy Policy 116:422–432. https://doi.org/10.1016/j.enpol.2018.02.024
Kiaee M, Cruden A, Sharkh S (2015) Estimation of cost savings from participation of electric vehicles in vehicle to grid (V2G) schemes. J Modern Power Syst Clean Energy 3(2):249–258. https://doi.org/10.1007/s40565-015-0130-2
Latini L, Armani FB, Leva S, Di Ninno F, Ravina G (2019) Economics of Vehicle-to-Grid application for providing ancillary services in Italy. In: 2019 IEEE Milan PowerTech. IEEE, pp 1–6
Madawala UK, Thrimawithana DJ (2011) A bidirectional inductive power interface for electric vehicles in V2G systems. IEEE Trans Ind Electron 58(10):4789–4796. https://doi.org/10.1109/TIE.2011.2114312
Malya PP (2020) Economic feasibility analysis of vehicle-to-grid service from an EV owner’s perspective in the german electricity market. IAAS University of Stuttgart
Mwasilu F, Justo JJ, Kim EK, Do TD, Jung JW (2014) Electric vehicles and smart grid interaction: a review on vehicle to grid and renewable energy sources integration. Renew Sust Energ Rev 34:501–516. https://doi.org/10.1016/j.rser.2014.03.031
Peterson SB, Whitacre J, Apt J (2010) The economics of using plug-in hybrid electric vehicle battery packs for grid storage. J Power Sources 195(8):2377–2384. https://doi.org/10.1016/j.jpowsour.2009.09.070
Raineri R, Rios S, Schiele D (2006) Technical and economic aspects of ancillary services markets in the electric power industry: an international comparison. Energy Policy 34(13):1540–1555. https://doi.org/10.1016/j.enpol.2004.11.015
Thompson AW (2018) Economic implications of lithium ion battery degradation for vehicle-to-grid (V2X) services. J Power Sources 396:691–709. https://doi.org/10.1016/j.jpowsour.2018.06.053
Uddin K, Jackson T, Widanage WD, Chouchelamane G, Jennings PA, Marco J (2017) On the possibility of extending the lifetime of lithium-ion batteries through optimal V2G facilitated by an integrated vehicle and smart-grid system. Energy. 133:710–722. https://doi.org/10.1016/j.energy.2017.04.116
Xu B, Oudalov A, Ulbig A, Andersson G, Kirschen DS (2016) Modeling of lithium-ion battery degradation for cell life assessment. IEEE Transact Smart Grid 9(2):1131–1140
Zhaoxi L, Qiuwei W, Christensen L, Rautiainen A, Yusheng X (2015) Driving pattern analysis of Nordic region based on National Travel Surveys for electric vehicle integration. J Modern Power Syst Clean Energy 3(2):180–189
Download references
Acknowledgements
Not applicable.
About this supplement
This article has been published as part of Energy Informatics Volume 4, Supplement 2 2021: Proceedings of the Energy Informatics.Academy Conference Asia 2021. The full contents of the supplement are available at https://energyinformatics.springeropen.com/articles/supplements/volume-4-supplement-2 .
The research is partially funded by the Netherlands Organization for Scientific Research (NWO) under the MERGE (647.002.006) and NextGenSmart DC (629.002.102) projects.
Author information
Authors and affiliations.
Department of Service Computing IAAS, University of Stuttgart, Stuttgart, Germany
Prasad Prakash Malya & Marco Aiello
Bernoulli Institute, University of Groningen, Groningen, The Netherlands
Laura Fiorini
University of Alberta, Camrose, Alberta, Canada
Mohammadhadi Rouhani
You can also search for this author in PubMed Google Scholar
Contributions
The work is based on the Master thesis of PM that was carried out under the supervision of MA who formulated the research problem. LF contributed to the energy models and MR to the power system aspects. The paper was mainly written by PM and edited by all authors. All authors read and approved the final manuscript.
Corresponding author
Correspondence to Marco Aiello .
Ethics declarations
Ethics approval and consent to participate, consent for publication, competing interests.
The authors declare that they have no competing interests.
Additional information
Publisher’s note.
Springer Nature remains neutral with regard to jurisdictional claims in published maps and institutional affiliations.
Rights and permissions
Open Access This article is licensed under a Creative Commons Attribution 4.0 International License, which permits use, sharing, adaptation, distribution and reproduction in any medium or format, as long as you give appropriate credit to the original author(s) and the source, provide a link to the Creative Commons licence, and indicate if changes were made. The images or other third party material in this article are included in the article's Creative Commons licence, unless indicated otherwise in a credit line to the material. If material is not included in the article's Creative Commons licence and your intended use is not permitted by statutory regulation or exceeds the permitted use, you will need to obtain permission directly from the copyright holder. To view a copy of this licence, visit http://creativecommons.org/licenses/by/4.0/ .
Reprints and permissions
About this article
Cite this article.
Malya, P.P., Fiorini, L., Rouhani, M. et al. Electric vehicles as distribution grid batteries: a reality check. Energy Inform 4 (Suppl 2), 29 (2021). https://doi.org/10.1186/s42162-021-00159-3
Download citation
Published : 24 September 2021
DOI : https://doi.org/10.1186/s42162-021-00159-3
Share this article
Anyone you share the following link with will be able to read this content:
Sorry, a shareable link is not currently available for this article.
Provided by the Springer Nature SharedIt content-sharing initiative
- Vehicle-to-grid (V2G)
- Energy arbitrage
- Battery life
- Economic feasibility
Residential Battery Storage
The 2021 ATB represents cost and performance for battery storage with two representative systems: a 3 kW / 6 kWh (2 hour) system and a 5 kW / 20 kWh (4 hour) system. It represents lithium-ion batteries only at this time. There are a variety of other commercial and emerging energy storage technologies; as costs are well characterized, they will be added to the ATB.
The NREL Storage Futures Study has examined energy storage costs broadly and specifically the cost and performance of lithium-ion batteries (LIBs) (Augustine and Blair, 2021) . The costs presented here (and for distributed commercial storage and utility-scale storage) are based on this work. This work incorporates current battery costs and breakdown from the Feldman 2021 report (Feldman et al., 2021) that works from a bottom-up cost model. The bottom-up battery energy storage systems (BESS) model accounts for major components, including the LIB pack, inverter, and the balance of system (BOS) needed for the installation. We would note though that, during the elapsed time between the calculations for the Storage Futures Study and the ATB release, updated values have been calculated as more underlying data have been collected. While these changes are small, we recommend using the data presented here in the ATB rather than what was previously published with the Storage Futures Study.
Current (2020) costs for residential BESS are based on NREL’s bottom-up BESS cost model using the data and methodology of (Feldman et al., 2021) , who estimated costs for both AC- and DC-coupled systems for a less-resilient (3 kW/6 kWh) installation and a more-resilient (5 kW/20 kWh) installation. We use the same model and methodology but do not restrict the power or energy capacity of the BESS to two options. Key modeling assumptions and inputs are shown in Table 1. We assume 2020 battery pack costs of $248/kWh DC 2019 USD (Bloomberg New Energy Finance (BNEF), 2019) .
Table 1. Residential Battery Storage Systems Model Inputs and Assumptions (2019 USD)
Residential BESS can be installed separately or can be added to an existing PV system (as an AC-coupled system). We also consider the installation of PV systems combined with BESS (PV+BESS) systems. Costs for residential PV systems come from NREL’s bottom-up PV cost model (Feldman et al., 2021) . We do include some cost savings for a combined PV and battery storage system. We assume the electrical BOS and installation labor are 90% of what they would be if the systems were installed separately. We also assume the sales and marketing costs for PV+BESS includes the cost of 20 more hours for a DC-coupled system and 32 more hours for an AC-coupled system than would be included for a PV-only system installation ( (Feldman et al., 2021) , Table 10). For the PV systems shown in Figure 36, this adds 20%–30% to customer acquisition costs. The resulting cost estimates are shown in Figure 1.

Figure 1. Cost of residential PV-stand-alone, BESS-stand-alone, and PV+BESS systems estimated using NREL bottom-up models
As with utility-scale BESS, the cost of a residential BESS is a function of both the power capacity and the energy storage capacity of the system, and both must be considered when estimating system cost. Furthermore, the Distributed Generation Market Demand ( dGen ) model does not assume specific BESS system sizes and it needs an algorithm to estimate residential BESS system cost based on the attributes of the residences (agents) it generates.
We develop an algorithm for stand-alone residential BESS cost as a function of power and energy storage capacity using the NREL bottom-up residential BESS cost model (Feldman et al., 2021) with some modifications. The NREL bottom-up model assumes either a 6-kW (less-resilient) or an 8-kW (more-resilient) inverter, which introduces a step function to the model and limits system size. We update the model to assume inverter costs of $0.48/W DC , which is consistent with BNEF estimates for inverter costs (Bloomberg New Energy Finance (BNEF), 2019) . We then run the model for BESS with 3 kW–10 kW of power capacity and 4 kWh–50 kWh of energy storage capacity. We achieve a near-perfect fit for all systems by fitting the costs to a linear equation with three constants:
- BESS cost (total $) = $1,690/kW * P B + $354/kWh * E B + $5,982
where P B = battery power capacity (kW) and E B = battery energy storage capacity ($/kWh).
Scenario Descriptions
Available cost data and projections are very limited for distributed battery storage. Therefore, the battery cost and performance projections in the 2021 ATB are based on the same literature review as for utility-scale and commercial battery cost projections. The projections are based on a literature review of 19 sources published in 2018 or 2019, as described by Cole and Frazier (Cole and Frazier, 2020) . Three projections from 2019 to 2050 are developed for scenario modeling based on this literature.
- Conservative Technology Innovation Scenario (Conservative Scenario): The conservative projection is comprised of the the maximum projection in 2020, 2025, and 2030 amongst the 19 projections reviewed . Defining the 2050 points is more challenging because only four data sets extend to 2050; they show cost reductions of 19%, 25%, 27%, and 39% from 2030 to 2050. The 25% is used for the moderate and conservative scenarios. In other words, the Conservative Scenario is assumed to decline by 25% from 2030 to 2050.
- Moderate Technology Innovation Scenario (Moderate Scenario): The moderate projections are taken as the as the median point in 2020, 2025, and 2030 of the 19 projections reviewed. Defining the 2050 points is more challenging because only four data sets extend to 2050; they show cost reductions of 19%, 25%, 27%, and 39% from 2030 to 2050. The 25% is used for the moderate and conservative cases. In other words, the Moderate Scenario is assumed to decline by 25% from 2030 to 2050.
- Advanced Technology Innovation Scenario (Advanced Scenario): The advanced projections are taken as the as the lowest cost point in 2020, 2025, and 2030 of the 19 projections reviewed. Defining the 2050 points is more challenging because only four data sets extend to 2050; they show cost reductions of 19%, 25%, 27%, and 39% cost reduction from 2030 to 2050. The 39% is used for the Advanced Scenario. In other words, the Advanced Scenario is assumed to decline by 39% from 2030 to 2050.
Methodology
NREL has not maintained future cost projections for residential BESS for the ATB as it has for utility-scale systems. In their absence, we base residential BESS cost projections on the NREL bottom-up cost model for residential systems combined with component cost projections from BNEF. BNEF has published cost projections for a 5-kW/14-kWh BESS system through 2030 (Frith, 2020) , with the projections being based on learning rates and future capacity projections.

Figure 2. Relative changes in projected component costs for residential BESS
Data Source: (Bloomberg New Energy Finance (BNEF), 2019)
The following methodology involves the following the steps to generate the Moderate Scenario future cost projections in detail:
- Total and component cost results are recorded.
- Component costs are assigned to categories according to Table 4.
- Apply cost reductions from the BNEF projections (Frith, 2020) to the corresponding component cost category for each BESS considered.
- BNEF projections only go to 2030. We assume residential BESS component costs decline by an additional 25% from 2030 to 2050, similar to the assumption used in the ATB utility-scale BESS cost projections (Cole and Frazier, 2020) .
- Advanced and Conservative Scenarios: Apply cost projections from the corresponding ATB utility-scale BESS scenario to all component costs.
- BESS cost (total $) = c a * P B + c 2 * E B + c 3
- Where P B = battery power capacity (kW) and E B = battery energy storage capacity ($/kWh), and c i = constants specific to each future year
Capital Expenditures (CAPEX)
Definition: The bottom-up cost model documented by (Feldman et al., 2021) contains detailed cost buckets for both solar only, battery only, and combined systems costs. Though the battery pack is a significant cost portion, it is a minority of the cost of the battery system. This cost breakdown is different if the battery is part of a hybrid system with solar PV or a stand-alone system. The total costs by component for residential-scale stand-alone battery are demonstrated in Table 2 for two different example systems.
Table 2. Capital Cost Component Breakdown for Residential Storage
Base Year : The Base Year cost estimate is taken from (Feldman et al., 2021) and is currently in 2019$.
Within the ATB Data spreadsheet, costs are separated into energy and power cost estimates, which allows capital costs to be constructed for durations other than 4 hours according to the following equation:
Total System Cost ($/kW) = (Battery Pack Cost ($/kWh) × Storage Duration (hr) + Battery Power Capacity (kW) × BOS Cost ($/kW) + Battery Power Constant ($)) / Battery Power Capacity (kW)
For more information on the power versus energy cost breakdown, see (Cole and Frazier, 2020) .
Future Projections : Future projections are based on the same literature review data that informs Cole and Frazier (Cole and Frazier, 2020) ., which generally used the median of published cost estimates to develop a Mid Technology Cost Scenario and the minimum values to develop a Low Technology Cost Scenario. However, as the battery pack cost is anticipated to fall more quickly than the other cost components (which is similar to the recent history of PV system costs), the battery pack cost reduction is taken from BNEF (Frith, 2020) and reduced more quickly. This tends to make the longer-duration batteries (e.g., 10 hours) decrease more quickly while short duration (e.g., 2 hours) decrease less quickly into the future. All durations trend toward a common trajectory as battery pack costs decrease into the future.
Operation and Maintenance (O&M) Costs
Base Year : Cole and Frazier (Cole and Frazier, 2020) . assume no variable O&M (VOM) cost. All operating costs are instead represented using fixed O&M (FOM) costs. They include augmentation costs needed to keep the battery system operating at rated capacity for its lifetime. In the 2020 ATB, FOM is defined as the value needed to compensate for degradation to enable the battery system to have a constant capacity throughout its life. According to the literature review (Cole and Frazier, 2020) , FOM costs are estimated at 2.5% of the capital costs in dollars per kilowatt.
Future Years : In the 2021 ATB, the FOM costs and VOM costs remain constant at the values listed above for all scenarios.
Capacity Factor
The cost and performance of the battery systems are based on an assumption of approximately one cycle per day. Therefore, a 4-hour device has an expected capacity factor of 16.7% (4/24 = 0.167), and a 2-hour device has an expected capacity factor of 8.3% (2/24 = 0.083). Degradation is a function of this usage rate of the model and systems might need to be replaced at some point during the analysis period. We use the capacity factor for a 4-hour device as the default value for ATB.
Round-Trip Efficiency
Round-trip efficiency is the ratio of useful energy output to useful energy input. (Mongird et al., 2020) identified 86% as a representative round-trip efficiency, and the 2021 ATB adopts this value.
The following references are specific to this page; for all references in this ATB, see References .
Augustine, Chad, and Nate Blair. “Energy Storage Futures Study: Storage Technology Modeling Input Data Report.” Golden, CO: National Renewable Energy Laboratory, 2021. https://www.nrel.gov/docs/fy21osti/78694.pdf .
Feldman, David, Vignesh Ramasamy, Ran Fu, Ashwin Ramdas, Jal Desai, and Robert Margolis. “U.S. Solar Photovoltaic System and Energy Storage Cost Benchmark: Q1 2020.” National Renewable Energy Lab. (NREL), Golden, CO (United States), January 27, 2021. https://doi.org/10.2172/1764908 .
Bloomberg New Energy Finance (BNEF). “Energy Storage System Costs Survey 2019,” October 14, 2019.
Cole, Wesley, and Will A. Frazier. “Cost Projections for Utility-Scale Battery Storage: 2020 Update.” Technical Report. Golden, CO: National Renewable Energy Laboratory, 2020. https://www.nrel.gov/docs/fy20osti/75385.pdf .
Frith, James. “Energy Storage System Costs Survey 2020.” Bloomberg New Energy Finance, December 16, 2020.
Mongird, Kendall, Vilayanur Viswanathan, Jan Alam, Charlie Vartanian, Vincent Sprenkle, and Richard Baxter. “2020 Grid Energy Storage Technology Cost and Performance Assessment.” USDOE, December 2020. https://www.energy.gov/energy-storage-grand-challenge/downloads/2020-grid-energy-storage-technology-cost-and-performance .
COMMENTS
The round trip efficiency is a crucial factor in determining the effectiveness of storage technology. A higher RTE indicates that there is less energy loss during the storage process, resulting in a more efficient overall system. ... Factors such as wear and tear, component degradation, and maintenance practices can impact the overall ...
Round-Trip Efficiency. Round-trip efficiency is the ratio of useful energy output to useful energy input. (Mongird et al., 2020) identified 86% as a representative round-trip efficiency, and the 2022 ATB adopts this value. In the same report, testing showed 83-87%, literature range of 77-98%, and a projected increase to 88% in 2030.
• Round-trip efficiency, measured as a percentage, is a ratio of the energy charged to the battery to the energy discharged from the battery. It can represent the total DC-DC or AC-AC efficiency of the battery system, including losses from self-discharge and other electrical losses. Although battery manufacturers often refer to the
Degradation is a function of this usage rate of the model and systems might need to be replaced at some point during the analysis period. We use the capacity factor for a 4-hour device as the default value for ATB. Round-Trip Efficiency. Round-trip efficiency is the ratio of useful energy output to useful energy input. (Mongird et al., ...
The USA PNGV battery test manual [26] gives a intuitive definition of round-trip efficiency, but does not have a strict specific test protocol. PNGV round-trip efficiency is defined as (3) Round-trip Efficiency = w a t t ⋅ h o u r s (d i s c h a r g e) w a t t ⋅ h o u r s (r e g e n) × 100 %. Download : Download high-res image (130KB ...
Round-trip efficiency is the percentage of electricity put into storage that is later retrieved. The higher the round-trip efficiency, the less energy is lost in the storage process. According to data from the U.S. Energy Information Administration (EIA), in 2019, the U.S. utility-scale battery fleet operated with an average monthly round-trip ...
The objective of the current study is to investigate and analyse the lithium-ion battery round-trip efficiency. A mathematical model has been established to calculate the battery's coulombic efficiency over a charge-discharge cycle. A comprehensive analysis has been carried out on the developed model to evaluate and compare different battery ...
Degradation is a function of the usage rate of the model, and systems might need to be replaced at some point during the analysis period. We use the capacity factor for a 4-hour device as the default value for ATB because 4-hour durations are anticipated to be more typical in the utility-scale market. Round-Trip Efficiency
Capacity degradation and energy efficiency were monitored over 1200 cycles. ... Fig. 11 presents the round-trip DC energy efficiency of the cells at each RPT. Note that the results are the efficiency of RPT cycles, and not the efficiency of the EA or FR cycle itself. Overall, the NMC+LMO cell have higher efficiency than the LFP cells (96% vs 94%).
Here, pp refers to the price premium, which is the time-averaged difference between p and OT, adjusted for round-trip efficiency losses and the temporal degradation of the energy discharged by the ...
The lifecycle and degradation mechanisms derived from capacity, round trip efficiency (RTE), resistance, charge/discharge energy and total utilized energy of the battery chemistries will be compared. Performance and safety of electrical energy storage systems will also be addressed, reviewing applicable standards and gridscale storage data.
The round-trip efficiency ranges generally between 70 % and 80 %. It takes values inferior to 100 % due to the different losses occurring within the system. The objective of this study is to assess the round-trip efficiency of GES system by evaluating the different factors that cause energy losses during the system's operation.
The capacity and discharge energy retention, as well as the round-trip efficiency, were compared. Even when operated within manufacturer specifications, the range of cycling conditions had a profound effect on cell degradation, with time to reach 80% capacity varying by thousands of hours and cycle counts among cells of each chemistry.
The all-vanadium redox flow battery (VRFB) is emerging as a promising technology for large-scale energy storage systems due to its scalability and flexibility, high round-trip efficiency, long durability, and little environmental impact.
Understanding the underlying physics of different battery technologies is critical for informed decision-making regarding state-of-charge limitations, round-trip efficiency, degradation profiles, and other crucial factors. This consideration bears significant importance.
The future EU Battery Directive requests this passport to contain the round-trip energy eficiency and its fade. In this paper, an algorithm is presented and demonstrated that estimates the round-trip energy eficiency of a battery pack. The algorithm identifies round trips based on battery current and SoC and characterizes these round trips ...
Careful selection of operating strategy can increase battery round trip efficiency and lifetime. ... observations it can be established that the choice of both the floating SoC and the SoC limits is critical in terms of round trip efficiency and degradation through battery capacity loss. Even though the same energy was delivered to the grid ...
The fine detail results of Figures 5 and 6 are dependent on the efficiency of the battery storage. A round trip of 90% was assumed in this analysis, since it is possible to DC-couple the energy ...
An in-house simplified degradation model was used to evaluate the capacity loss (as this can have significant impact on cost calculations if not done) of the batteries with cycling and ... rte Overall round-trip efficiency at the current SOH (0 to 100 % SOC range) (%) rte100 Overall round-trip efficiency at 100 % SOH (0 to 100 % SOC
Degradation is a function of this usage rate of the model and systems might need to be replaced at some point during the analysis period. We use the capacity factor for a 4-hour device as the default value for ATB. Round-Trip Efficiency. Round-trip efficiency is the ratio of useful energy output to useful energy input.
The correlation observed between energy capacity, nominal voltage, round-trip efficiency and internal resistance with SOH, show a reduced effect of micro-cycles on the degradation mechanisms of Li-ion batteries. Therefore, the aging of Li-ion batteries is caused mainly by deep charge-discharge cycles.
A sensitivity analysis shows that, lower driving distance, higher efficiency, and higher capacity values result in higher profit to the EV owner. For every 1 % increase in the round trip efficiency, there is an increase of 1.62 Euros in profit. For every 1 kWh increase in battery capacity, the profit increases by 1.85 Euros.
Degradation is a function of this usage rate of the model and systems might need to be replaced at some point during the analysis period. We use the capacity factor for a 4-hour device as the default value for ATB. Round-Trip Efficiency. Round-trip efficiency is the ratio of useful energy output to useful energy input. (Mongird et al., ...