- English (CA)
- English (UK)
- Deutsch (DE)
- Deutsch (CH)

80+ UK Tourism Statistics [2024 update]
Reviving inbound tourism: the uk's journey to recovery.
- The latest inbound tourism forecast for 2023 anticipates 37.5 million visits, an impressive 92% recovery compared to the pre-pandemic level in 2019.
- In 2023, inbound visitors are projected to spend £30.9 billion, surpassing the 2019 level by 109% in nominal terms.
- Travel and tourism’s total contribution to the UK’s GDP in 2017 was 5.3%. By 2028, travel and tourism’s contribution to the UK’s GDP is expected to decrease significantly to only 2%.
- Overseas residents made 31.2 million visits to the UK in 2022.
- By 2024 and 2025, both domestic and international tourism in the UK is projected to bounce back to pre-pandemic levels.
- Ranked the sixth largest in the world, the UK tourism industry generates £155.4 billion in revenue for the UK economy annually.
- In 2022, London remained the most visited city by international visitors with just over 16 million international visits. However, this figure was approximately 26% lower than the pre-pandemic levels in 2019.
- Edinburgh and Manchester welcomed a considerable number of tourists in 2022 — 1.8 million and 1.2 million respectively — making them the second and third most popular destinations.
- In 2022, the United States topped the list as the leading inbound travel market for the UK based on the number of visits, with approximately 4.6 million inbound trips from American travelers.
- Following closely were tourist arrivals from France, the Republic of Ireland, and Germany.
- In 2019, Americans spent a record £4.18bn while visiting the UK.
- In 2022, overseas visitors to the UK enjoyed an average stay of 8.4 nights, compared to just over 7 nights in 2019.
- The National History Museum, Brighton Pier, and the British Museum topped the list of the most popular free attractions in England in 2022.
- The Tower of London, the Royal Botanic Gardens, and the RHS Garden Wisley topped the list of the most popular paid attractions in England in 2022.
- The Windsor Great Park was the most visited tourist attraction throughout the UK in 2022, attracting 5.6 million visitors.
A surge in travel staycations: UK domestic tourism statistics
- Between April and December 2021, Brits enjoyed nearly 45 million overnight stays within the UK.
- In 2021, domestic travelers in the UK spent £98.7 billion on trips around the UK.
- In 2019, British tourists embarked on almost 123 million domestic holidays.
- The number of outbound international travel trips in 2019 amounted to 93 million.
- Brits took an average of 2.3 domestic vacations between September 2021 and August 2022.
- 20% of Brits say that the South West of the UK is their top destination for overnight domestic trips during summer.
- With staycations on the rise, Brits spent an average of almost £770 on UK getaways in 2021.
- Throughout 2022, British residents made 1.1 billion day trips to places within the UK, spending £45 billion on these trips alone.
Adventure tourism statistics: Visitors to the UK have caught the adventure bug
- The UNWTO reports that the UK boasts Europe’s largest adventure tourism market, accounting for 19% of the world's adventure travel tourists.
- By 2024, the adventure tourism industry revenue is projected to reach £3.8 billion.
- From 2011 to 2019, spending on adventure and water sports in the UK increased from £1.5 billion to £1.8 billion.
- The number of people taking part in adventure and water sports activities in the UK has also increased from 57 million in 2011 to 100 million in 2019.
- In 2021, UK spending on camping trips rose to £2.7 billion.
- In 2019, outdoor-related activities in urban settings accounted for over 60% of all nature-based spending.
- 59% of European millennials have had at least one kind of adventure experience.
Healthcare tourism statistics beyond borders: Medical tourism in the UK is on the rise
- The UK medical tourism market is expected to reach a valuation of over £17 billion by 2032.
- The global medical tourism market is projected to be worth $35.9 billion by 2032.
- In 2020, the UK ranked fifth in the global destination environment ranking for medical tourism.
- In 2021, a total of 34,000 inbound visits to the UK were for medical treatment.
- Of the 34,000 medical tourists in 2021, 62% were from countries in the EU-15, and less than 3% were from North America.
- Tourist spending on medical treatment in the UK is between £178 million to £325 million annually.
- Inbound medical travelers and their companions contribute approximately £219 million to the UK economy through additional tourism expenditures every year.
- Dental care, cosmetic surgery, fertility treatments, organ and tissue transplantation, and cancer treatment top the list of popular procedures for medical tourism trips.
Sports tourism statistic scoring big: Football rules UK sports tourism
- In 2022, 76.2 million people attended professional sporting events throughout the UK.
- According to the latest figures, inbound tourism expenditure on sport and recreation reached an impressive £231 million in the UK.
- In 2019, around 1.5 million inbound visitors attended a live football match, accounting for approximately 1 in every 27 visitors.
- Football is the number one sporting attraction for international tourists visiting the UK, with over 800,000 visitors annually attending a football match.
- Cricket is the second biggest sporting draw with 225,000 annual visitors.
- Since 2010, the value of sport to the UK economy has increased by 40%.
- In 2019, inbound football tourists spent an average of £909 per visit, 31% higher than the average visitor spend of £696 by other inbound tourists.
- In 2019, the Old Trafford Stadium in Manchester and the Anfield Stadium in Liverpool had the highest attendance at 440,000 tourist visits.
- The amount spent on golfing activities in the UK grew by 40% between 2011 and 2019, from £800 million to £1.1 billion
Business tourism statistics: Meetings, incentive trips, and exhibitions fuel the business tourism boom in the UK
- In 2022, there were 5.1 million visits to the UK for business reasons.
- Business contributed £5.8 billion in spend in 2019, representing an incredible 20% of all inbound spend.
- Business travelers tend to make flying visits to the UK. In 2019, almost two-thirds of all business visits to the UK lasted between 1 and 3 nights.
- Unlike typical tourism flows, business visits to the UK don't show much seasonality, which means there's a steady number of visitors year-round.
- In 2019, Meetings, Incentives, Conferences and Exhibitions (MICE) made up nearly one-third of all UK business trip expenses, with visitors spending a hefty £1.7 billion.
- In 2019, conferences, conventions, and congresses took the lead among the MICE sub-categories, accounting for 742,000 visits and a whopping total spend of £716 million.
- Large meetings consisting of over 21 people in 2019 accounted for approximately 7% of all business visits (646,000 visits in total), and these travelers spent £573 million.
- In 2019, incentive and team-building trips made 67,000 visits and spent £69 million, making them one of the top-spending business groups with an expenditure of £1,039 per visit.
- In 2019, attendees of exhibitions, events, and trade shows spent a total of £319 million during 319,000 visits.
- In 2021, UK residents made an estimated total of 8.3 million business trips.
- Two-thirds of UK businesses plan to boost business travel spend by 50% or more in 2023.
- The Travel and Tourism Development Index ranked the UK as the fifth-best country for non-leisure travel worldwide in 2021, and the first-best country in Europe.
- Business travelers flocked to London in 2019, with a remarkable 3.98 million visits from abroad, solidifying its position as the top business travel destination in the UK.
- The average cost of a business trip to London has risen by 15% since 2022.
- As of 2023, London is the third most expensive business travel location in Europe.
- Ranked as the eighth most expensive city in the world for business travel, a trip to London costs around £497 per day visit.
- The average spend per domestic business trip in 2019 was £280.
- Over half of business trips to the UK turn into bleisure trips.
? "uk outbound tourism statistics 2021")
TravelPerk's Meetings & Events team can help you book venues and get exclusive discounts on group travel
Rural tourism statistics: the charm of rural tourism and sustainable travel is on the rise.
- A testament to its beauty, UK nature contributed a remarkable £12 billion to tourism and outdoor leisure in 2019.
- In 2021, the Gross Value Added (GVA) from tourism in Predominantly Rural areas was worth an impressive £11.5 billion.
- During 2019/20, rural areas boasted 66,800 registered tourist-related businesses, making up 11% of the total registered businesses in those regions.
- Tourism-related industries play a more substantial role in rural employment, representing 15% of the total workforce, compared to 11% in urban areas.
- The majority of UK travelers (71%) and US travelers (69%) say that sustainable travel practices are important to them and strive to make more eco-conscious journeys.
- 23% of UK travelers chose to travel to a destination closer to home in order to reduce their carbon footprint .
- In a bid to enhance rural tourism, Scotland allocated £3 million in 2022 to support 10 infrastructure projects, focusing on visitor facilities, access improvements, and promoting eco-friendly transport options.
- An estimated 34% of holidays in Wales involve camping or caravanning, compared to 20% in England and 21% in Scotland.
Music tourism is hitting high notes in the UK
- In 2022, the global music tourism market value was valued at $5.5 billion and is on track to rock 'n' roll all the way up to an incredible $11.3 billion by 2032.
- The thriving music tourism sector sustained a total of 56,000 jobs across the UK in 2022, massively contributing to overall tourism employment statistics in the country.
- In 2022, the UK’s music scene drew in an impressive 1.1 million foreign music tourists and 13.3 million domestic music tourists.
- 2022 marked a crescendo in music tourism spending in the UK, peaking at an impressive £6.6 billion — surpassing the pre-pandemic total in 2019 of £4.7 billion.
- Attracting a staggering 4.9 million music tourists, London is a major magnet for music lovers.
- Thanks to the draw of legendary groups The Beatles, The Stone Roses, and Oasis, the North West region is close behind with 1.9 million music tourists.
- 10% of British people would travel eight hours by plane to see their favorite artists.
- 63% of Brits have been on trips that combined travel with a gig or festival.
- New York and Barcelona are the top dream travel destinations for British music lovers.
Ready to plan your next trip to the UK?
? "uk outbound tourism statistics 2021")
Make business travel simpler. Forever.
- See our platform in action . Trusted by thousands of companies worldwide, TravelPerk makes business travel simpler to manage with more flexibility, full control of spending with easy reporting, and options to offset your carbon footprint.
- Find hundreds of resources on all things business travel, from tips on traveling more sustainably, to advice on setting up a business travel policy, and managing your expenses. Our latest e-books and blog posts have you covered.
- Never miss another update. Stay in touch with us on social for the latest product releases, upcoming events, and articles fresh off the press.
? "uk outbound tourism statistics 2021")
Accelerating our US expansion with AmTrav acquisition
? "uk outbound tourism statistics 2021")
Business Travel and Wellness Survey Results
? "uk outbound tourism statistics 2021")
60+ online travel booking statistics & trends
? "uk outbound tourism statistics 2021")
- Business Travel Management
- Offset Carbon Footprint
- Flexible travel
- Corporate Travel Resources
- Corporate Travel Glossary
- For Travel Managers
- For Finance Teams
- For Travelers
- Careers Hiring
- User Reviews
- Integrations
- Trust Center
- Help Center
- Privacy Policy
- Cookies Policy
- Modern Slavery Act | Statement
- Supplier Code of Conduct
Where do Brits go on holiday?: Popular travel destinations
We look at how many people are jetting off each year to enjoy sun, sea and relaxation..
- Loans & credit cards
- Building credit

- Publishing original personal finance research
- Creating data-led statistics pages to highlight industry trends
- Cost of living and money saving tips

In this guide
Outbound tourism statistics: Highlights
How many brits travel abroad each year, what are the most popular holiday destinations, what are the top reasons for travelling abroad, overseas spending by brits.
We analysed the most recent outbound tourism statistics to get some insight into the travel industry as it stands today. Read on to see how many trips abroad people in the UK take and where Brits go on holiday. With a number of credit cards that don’t charge for overseas transactions , you can also see how much Brits are spending abroad!
- Spain is the most popular travel destination for Brits, with 17.8 million trips made in 2023.
- France, Italy, Greece and Portugal make up the rest of the top 5 travel destinations for Brits – all of the top 5 are in Europe.
- The USA is the top travel destination for Brits outside of Europe, with 3.9 million visits in 2023.
- UK residents made a total of 86.2 million trips abroad in 2023, up from 71.8 million in 2022.
- Holidays were the top reason for Brits travelling abroad, with 55.5 million holidays taken in 2023.
- In 2023, UK residents spent an estimated £72.4 billion overseas.
In 2023, Brits made 86.2 million trips overseas, up 21% from the 71.8 million visits made by Brits in 2022. This is still slightly less than the peak number of visits made before the COVID-19 pandemic in 2019, which was 93.1 million.

Spain is the most popular travel destination for Brits, with an estimated 17.8 million residents taking a trip here in 2023. It is followed by France, which had 9.2 million visitors from the UK in 2023, and Italy, which had 4.9 million visitors from the UK in 2023. Italy has overtaken Greece in popularity since 2022.
The top ten destinations for Brits are:

More than 3 in 4 visits abroad (77%) from the UK in 2023 were to Europe, making up 66.7 million trips. 4.5 million trips abroad were to North America, which made up 5% of trips.

Share your opinions to win prizes or earn cash!
Share your opinions to win!
Sign up to receive deals and tips, plus opportunities to win prizes for your opinions and experiences! (T&Cs)
Holidays were the most popular reason for travelling abroad in 2023, with 55.5 million holidays making up 64% of all trips abroad. 22.5 million visits were also made to friends and family overseas, while there were 6.3 million international business trips.

In 2023, UK residents spent an estimated £72.4 billion overseas compared to only £58.4 billion in 2022. Most spending was done on holidays (70%), followed by visits to friends and family (20%) and business trips (8%). Around 2% of total spending abroad came from trips with miscellaneous purposes.
Click here for more research. For all media enquiries, please contact –
Matt Mckenna UK Head of Communications T: +44 20 8191 8806
Emily Herring
Emily Herring is a Publisher at Finder specialising in credit-based products including credit cards and business and personal loans. Emily has recently joined the Investments team. She has a Masters in Creative Writing & Publishing and a Bachelor of Arts in Communication & Media. See full bio
Sophie Barber
Sophie Barber is a content marketing manager for Finder in the UK after previously working as a content manager at a digital marketing agency. She has over 5 years experience in writing and publishing clear, concise and informative online articles for a variety of websites. See full bio
More guides on Finder
Use our calculator to find out how long it would take to clear your credit card balance by making the minimum required payments vs paying a fixed amount each month.
We look at the average APR on credit cards in the UK and how credit card interest rates have changed over time.
£551.3 million was lost to credit, debit and payment card fraud in the UK in 2023. We look at the latest statistics on card fraud in the UK.
Onmo is making its debut into the credit card market with its new card offering limits starting from £200. Here’s what we know so far.
The Yonder credit card has launched in the UK, using open banking to create a personalised picture of your spending habits to help you get the most out of your credit card.
Keebo has launched the UK’s first open-banking credit card, but how does it weigh up against other credit building cards?
Compare student credit cards with low or no annual fees, competitive interest rates and interest-free days to manage your finances and build your credit.
Metro Bank’s no-frills card comes with a single competitive rate and no fees on overseas transactions within Europe.
Get cashback on your purchases with a cashback credit card. Redeem rewards points for cashback or gift cards. Find out more in our guide.
Buy now and pay interest later with a 0% purchase credit card. Compare current offers with 0% p.a. on purchases.
How likely would you be to recommend Finder to a friend or colleague?
Our goal is to create the best possible product, and your thoughts, ideas and suggestions play a major role in helping us identify opportunities to improve.
Advertiser Disclosure
finder.com is an independent comparison platform and information service that aims to provide you with the tools you need to make better decisions. While we are independent, the offers that appear on this site are from companies from which finder.com receives compensation. We may receive compensation from our partners for placement of their products or services. We may also receive compensation if you click on certain links posted on our site. While compensation arrangements may affect the order, position or placement of product information, it doesn't influence our assessment of those products. Please don't interpret the order in which products appear on our Site as any endorsement or recommendation from us. finder.com compares a wide range of products, providers and services but we don't provide information on all available products, providers or services. Please appreciate that there may be other options available to you than the products, providers or services covered by our service.
We update our data regularly, but information can change between updates. Confirm details with the provider you're interested in before making a decision.
Learn how we maintain accuracy on our site.
Cookies on GOV.UK
We use some essential cookies to make this website work.
We’d like to set additional cookies to understand how you use GOV.UK, remember your settings and improve government services.
We also use cookies set by other sites to help us deliver content from their services.
You have accepted additional cookies. You can change your cookie settings at any time.
You have rejected additional cookies. You can change your cookie settings at any time.
Overseas travel and tourism: October 2021 provisional results
Visits to the UK by overseas residents, visits abroad by UK residents and spending by travellers, using provisional passenger traffic data.
https://www.ons.gov.uk/releases/overseastravelandtourismoctober2021provisionalresults
Official statistics are produced impartially and free from political influence.
Updates to this page
Sign up for emails or print this page, is this page useful.
- Yes this page is useful
- No this page is not useful
Help us improve GOV.UK
Don’t include personal or financial information like your National Insurance number or credit card details.
To help us improve GOV.UK, we’d like to know more about your visit today. Please fill in this survey (opens in a new tab) .

What are you looking for?
64+ uk travel & tourism statistics (2023).
London is one of the top five most popular cities for tourism worldwide. It’s truly an icon of the United Kingdom and the country’s leading tourist destination.
Well, have you ever wondered what the most visited attractions are in the UK?
Or how much money tourism brings in to the UK’s economy?
Below, we’ve compiled data from numerous reliable sources to present some of the latest statistics about travel and tourism in the UK.
Whether you want to learn more about UK tourism or are simply preparing for your next visit, you’ve come to the right place!
Let’s get started…
Sources : You’ll find the source of each statistics directly under it, or head over to the end of the post for a full list of all articles and sources used.
Travellerspoint
How many tourists visit the UK each year?
In 2019, there were 40.86 million tourist arrivals registered in the United Kingdom.
What percentage of the UK economy is tourism?
The total contribution of travel and tourism to the UK’s GDP increased by 40% from 2020 to 2021, after plummeting dramatically from the £234.5 billion contribution in 2019.
Where does the UK rank in tourism?
With 39.4 million visitor arrivals in 2019, the UK ranks tenth in the top visited countries in the world.

How many tourists visit wales each year?
More than 1 million tourists visit Wales each year, spending a total of £3 billion annually.
UK Travel & Tourism Key Statistics
- The number of international tourist arrivals in the UK fell significantly to 11.1 million in 2020, which is a 73% decrease.
- Holiday is the main reason overseas tourists visited the UK, with 1.3 million visits being made for this reason, or 44% of all overseas visits.
- With 4.2 million visits, Spain was the most visited country by UK residents in 2021.
- In 2021, 30% of all travel and tourism spending in the UK was for business travel, while 70% was leisure spending.
- London is the most popular city in the UK for international travelers, reaching the top 5 most popular cities worldwide in 2019 with 19.56 million tourists.
- There were 18,530 accommodation businesses in the UK in 2020.
- Hotels and similar accommodations are the most common accommodation type in the UK, with 9,837 establishments recorded in 2020.
- After London, the second most visited city in Britain is Edinburgh with 2.2 million visitors in 2019.
- The British Museum is the most visited tourist attractions in the United Kingdom according to 2019 figures.
UK inbound tourism statistics
How many tourists visit Britain each year?
1. There were 3 million overseas visits to the UK in June 2022, a 7% increase from the 2.8 million visits in May 2022.
[ons.gov.uk]
2. However, this figure is still 19% lower than the pre-pandemic levels, which was 3.7 million in June 2019.
In the UK and elsewhere in the world, pre-pandemic figures in travel and tourism are still significantly better.
3. In 2019, there were 40.86 million tourist arrivals registered in the United Kingdom.
[WorldData]
The number of tourist arrivals include anyone who spends at least one night in the UK but doesn’t reside there for more than 12 months. However, the survey excludes business and non-tourism arrivals.
4. The number of international tourist arrivals in the UK fell significantly to 11.1 million in 2020, which is a 73% decrease from 2019.

5. Holiday is the main reason overseas tourists visited the UK, with 1.3 million visits being made for this reason, or 44% of all overseas visits.
6. another popular reason for visiting the uk from abroad was to visit friends or relatives (1 million visits or 34% of the total)., outbound tourism in the uk.
How many outbound visits are made from the UK each year?
7. In June 2022, UK residents made 7.8 million overseas visits, or 23% more, compared to May 2022.
8. likewise, this is also still lower than the 9.1 million recorded overseas visits made by uk residents in june 2019., 9. out of these overseas visits made by uk residents, 6.6 million or 85% were to european countries..
UK residents make up a significant portion of the international tourism in Europe .
10. With 4.2 million visits, Spain was the most visited country by UK residents in 2021.
This is still a significant decrease from the 18 million visits to Spain made by UK residents in 2019.
11. The top outbound travel destination for UK residents in 2021 was followed by France, Portugal, and Greece.
The UK is actually the top inbound travel market for France, with 13 million visits recorded in 2018 .
12. Great Britain is an important market for the Republic of Ireland, making up 42% of all overseas visits to the country.
[TourismIreland]
42% of all international visits to Ireland are made by residents from Great Britain.
13. 72% of those who travel abroad from the UK do so as a holiday.
14. meanwhile, 23% of uk residents travel overseas to visit friends or family., uk tourism spending.
How big is the UK tourism industry?
15. In June 2022, overseas residents spent £2.7 billion in the UK.
16. in contrast, uk residents spent £6.2 billion while overseas the same month., 17. the total contribution of travel and tourism to the uk’s gdp increased by 40% from 2020 to 2021, after plummeting dramatically from the £234.5 billion contribution in 2019..
This shows that in 2021, travel and tourism in the UK are beginning to look up again following the various restrictions of the coronavirus pandemic.

18. In 2021, 30% of all travel and tourism spending in the UK was for business travel, while 70% was leisure spending.
30% of tourism spending in the UK was for corporate travel.

19. In the United Kingdom, domestic visitors contributed 96% of total travel and tourism spending in 2021, compared to 81% in 2019.
The increasing segment of domestic tourist spending in comparison to international shows that international tourism has yet to recover in the UK.

20. Total travel and tourism revenue in the United Kingdom reached $18 billion in 2021, with the leading industry being hotels, generating $6.5 billion in 2021.
21. according to the statista mobility market outlook, revenue across all travel and tourism industries in the uk will grow and surpass pre-pandemic levels by 2023., 22. the uk travel and tourism industry generated a total of 4.11 million jobs in 2021. it has not yet reached the pre-pandemic levels of 4.28 million jobs in 2019..
Meanwhile, the number dropped slightly to 4.09 million in 2020, when the coronavirus pandemic was at its peak.
23. The median full-time salary of employees in the UK hotel industry is £20,300.
24. meanwhile, full-time workers in the passenger rail transport and interurban industry has a median salary of almost £40,300..
The rail transport and interurban industry remains one of the highest-paying one within all tourism and hospitality industries in the UK.
25. Solo travellers from the UK spend an average of €340 on flight and hotel, the most out of other European solo travellers.
British citizens who travel solo are recorded to spend €340 on average for their flight and hotel alone.
Domestic tourism in the UK
How big is domestic tourism in the UK?
26. The number of overnight trips in Great Britain almost reached 119 million between April and December 2021, which is nearly caught up with the pre-pandemic number of 2019.
27. in terms of trip purpose, residents of great britain took 45 million overnight vacations and 43 million overnight trips to visit friends and relatives in domestic destinations., 28. in 2019, british tourists took 1.65 billion domestic day trips within great britain..
Day trips here are used to refer to visits that last at least three hours, to destinations where they do not reside in.
29. Britons spend an average of £770 on staycations in 2021, a 12% decrease from the £874 average in 2019.
30. british tourists tend to prefer cities than countryside when taking day trips within great britain., 31. in 2019, seaside destinations were most popular with day trippers in wales (19%), compared to 10% of respondents in england and scotland each..
Residents of Wales show a higher tendency and preference to seaside destinations compared to day trippers from Scotland and England.
London tourism statistics
How much does tourism contribute to London?
32. London is the most popular city in the UK for international travelers, reaching the top 5 most popular cities worldwide in 2019 with 19.56 million tourists.
33. despite being one of the most popular cities for tourism, london is actually only the 27th biggest city in terms of population (8.96 million)., 34. london tourism has grown steadily from 2011, reaching its peak in 2019 with a total of 21.71 million international visits that year., 35. however, in 2021, overseas arrivals in london plummeted to just 2.72 million, which is an 87.5% decrease..

36. Visitors in London spent a total of £2,104 million in 2019, but fell to £409 million due the Covid-19 pandemic in 2020.
37. the 1.3 million overnight stays in london in 2019 also decreased to 300 thousand in 2020., 38. likewise, day visits dropped from 19.7 million in 2019 to 4.3 million the year after., 39. finally, the number of visits to attractions in london decreased by almost 80% from 2019 to 2020 (7.44 million to 1.56 million)., uk travel accommodation.
How many hotels are there in the UK?
40. There were 18,530 accommodation businesses in the UK in 2020.

41. Hotels and similar accommodations are the most common accommodation type in the UK, with 9,837 establishments recorded in 2020.
There are 9,837 hotels businesses in the UK in 2020, making it the most common type of vacation rental in the country.
42. This is compared to the 5,135 holiday and other short stay accommodations, and 2,270 campgrounds, RV parks, and trailer parks.
RV ownership in the UK reached a record high of £1.15 billion in 2021 , which might mean that the number of campgrounds, RV parks, and trailer parks will increase even more.

43. Premier Inn is the most popular hotel brand in the UK. 74% of respondents in a 2022 survey stated that they liked the brand.
44. the second most popular hotel brand in the uk is travelodge with 56% stating a positive opinion on it..

45. The number of hotel guests in the UK is predicted to continuously rise by 23.92% within the next few years, reaching 48.21 million in 2026.
46. in 2020, there were 254 thousand airbnb listings in the uk, making it the top 6 country with the highest number of active airbnb listings in the world..
[AllTheRooms]
The UK has 254 thousand active Airbnb listings , the sixth highest number from all countries worldwide.
UK top travel destinations
What is the number 1 tourist attraction in the UK?
47. After London, the second most visited city in Britain is Edinburgh with 2.2 million visitors in 2019.
[VisitBritain]
48. It is followed by Manchester, Birmingham, Liverpool, Glasgow, Brighton/Hove, Bristol, and finally, Oxford and Cambridget at the 9th and 10th spots.
49. 41.8 million tourists visited birmingham in 2017, 6.9% more than 2016, and generated £7.1 billion in revenue. , 50. more than 1 million tourists visit wales each year, spending £3 billion annually..
[Geography in the News]
51. Most tourists to Wales come from the Republic of Ireland, USA and Germany.
Wales is one of the four countries that make up the United Kingdom, and American tourists make up a huge proportion of visitors in Wales.
52. 40% of all visits to Lancashire in 2021 were to Blackpool, with a total of 18.81 million visits that year.
Blackpool is a famous seaside resort best known for Blackpool Pleasure Beach and its charming old-school amusement park. Its number of visitors has more than doubled since 2020.
53. The British Museum is the most visited tourist attractions in the United Kingdom according to 2019 figures.
54. this is followed by tate modern, the national gallery, the natural history museum, and southbank centre..
It is clear that art galleries and museums are some of the most popular types of tourist attractions in the UK.
55. In 2021, Windsor Great Park is the most visited tourist attractions in the United Kingdom
Windsor Great Park is the most visited attraction in the UK in 2021. However, the 2019 is more representative of the usual UK tourism as it’s not affected by pandemic-related travel restrictions.
56. The most popular destination in the UK for a winter staycation is the North West, with 17% of respondents stating that they intend to visit the region.
A staycation refers to a holiday spent in one’s own country or hometown as opposed to abroad or out of town.
57. 15% said that they intended to visit Scotland during their winter holiday, while only 4% were planning to visit Northern Ireland.
Travel bookings and behaviours in the uk.
How do tourists in the UK book their travels?
58. A 2022 survey in the UK reveals that hotels are the most popular travel products to be booked online, with 38% claiming they have booked hotels online in the past 12 months.
38% of respondents have booked hotels in the UK online in the past 12 months, which includes website and app bookings.
59. Another survey conducted among different age groups in the UK showed that people aged 25 to 54 years old prefer to use online travel agencies to book their overseas holiday.
In fact, the UK is the 7th most popular destination for Gen Z and millennial travellers .
60. Meanwhile, agencies and tour operators were the favorite choice for individuals aged under 24 years plus 65 years and older.
61. 48% of travelers in the uk tend to use their smartphone as a guide while traveling., 62. in june 2022, 46% of women in the uk claimed that they had not taken a holiday in the last month, compared to 44% of men..
The percentage of men and women who had not taken a holiday doesn’t differ by much, but in general, women tend to travel less in the UK.

63. At the height of the pandemic in April 2020, 73% of adults in the UK had taken no holiday in the last month. This percentage fell to just 45% in June 2022.
Overall, 13.8% of British baby boomers travels overseas.
64. After the pandemic, the number of people who searched for “glamping holidays uk” and “uk staycation” on Google grew by 400%.
400% more people searched for “glamping holidays uk” and “uk staycation” on Google in the UK, which revealed the growing interest in both domestic travel and glamping holidays.
65. British travellers comprise 6.61% of Booking.com's web traffic.
The UK is the second largest online audience for Booking.com (6.61%) .
From fish and chips to Big Ben, the Royal Family to the Beatles, the UK is one of the biggest countries in terms of travel and tourism—both as a destination in itself and because British residents are known to travel a lot!
We’ve tried to be as thorough as possible, but we might have missed one or two interesting statistics about the UK.
Feel free to comment with your thoughts!
Meanwhile, you might love some of these other stats:
- Digital Nomad Statistics
- Family Travel & Tourism Statistics
- Paris Travel & Tourism Statistics
- Pet Travel Statistics
- TourismIreland
- WorldData 1
- WorldData 2
- AllTheRooms
- VisitBritain
- Geography in the News

Leave a comment
Let us know what you think.

5 million people can't be wrong

The luggage storage network blog
UK Tourism Statistics 2023
We’ve put together some of the latest UK tourism statistics using recent data and reports including market size, the number of tourists visiting the UK, and the most popular tourist attractions to visit.
Key Statistics
Uk tourism market size, how many tourists visit the uk each year, overseas visitors spending in the uk, number of nights spent in the uk, most-visited towns and cities in the uk, most-visited uk tourist attractions, outbound tourism from the uk, uk domestic tourism statistics, where do british people stay on holiday, london tourism statistics.
- 31.2 million people visited the UK from overseas in 2022, a 388.7% increase from 2021 as a result of travel restrictions being lifted after COVID-19.
- The UK’s travel and tourism industry is worth an estimated £31.38 billion ($39.14 billion USD) and is expected to reach £33.41 billion ($41.67 billion USD) by 2027 .
- Overseas visitors spent £26.5 billion in the UK in 2022, climbing back up to pre-pandemic levels after dropping significantly in 2020 and 2021.
- London is the most-visited city in the UK with 16.1 million overseas visitors in 2022 , followed by Edinburgh with 1.8 million visitors .
- The most-visited attraction in the UK is the Crown Estate at Windsor Great Park with 5.6 million visitors in 2022.
- Visitors from China spend the most on average in the UK with £8,779 per visit , which is approximately 10 times the average amount spent by all visitors from around the world.
- Visitors to the UK from Poland spend the least on average at £321 per visit .
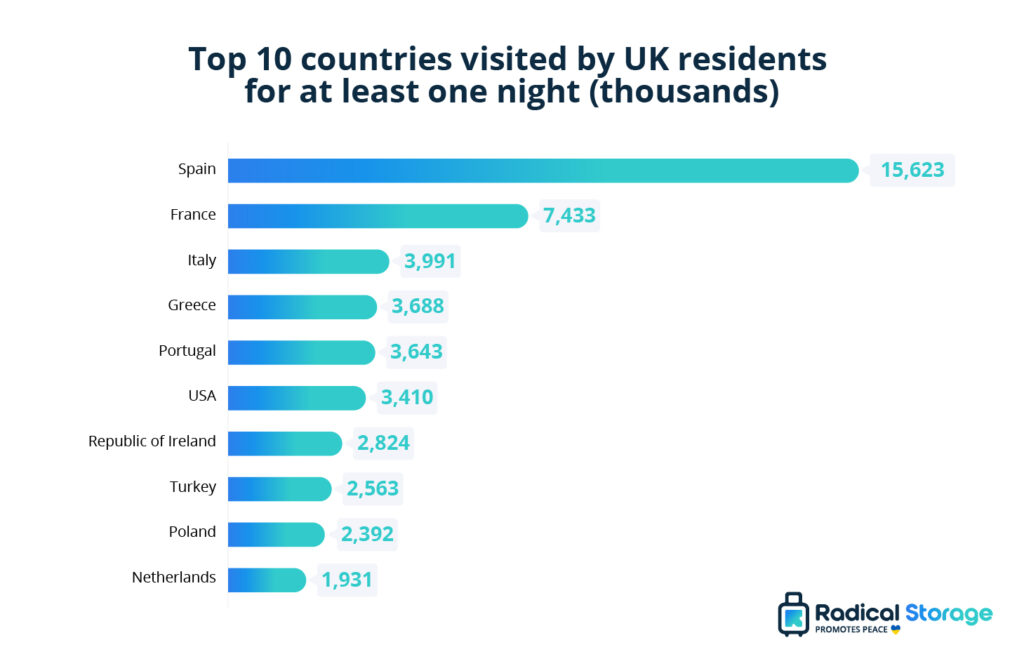
- Spain is the most-visited country by UK residents, with 15.6 million visits of at least one night, followed by France with 7.4 million visits .
- 46% of British travellers say their budget is £200 or less for a trip in the UK, with 76% saying they will prioritise value for money when booking a holiday.
Revenue in the UK’s travel and tourism industry is estimated at £31.38 billion in 2023 and is predicted to reach £33.41 billion by 2027 with a CAGR of 1.58% between 2023 and 2027. [ 1 ]
How many people work in tourism in the UK?
The latest figures show that 3.3 million people work in the tourism industry in the UK, and this is expected to grow to 3.8 million by 2025. [ 2 ]
In 2022, 31.2 million people visited the UK from overseas, a 388.7% increase from 2021 but visitor numbers had not yet fully recovered to 2019 levels.
The number of overseas visitors to the UK remained fairly consistent in the years prior to 2020 when the COVID-19 pandemic led to travel restrictions. There were 40.8 million international visitors in 2019, and this dropped by 279.2% to 11.1 million in 2020.
Sources [ 3 ] [ 4 ]
Visitor spending in the UK also remained consistent in the years between 2017 and 2019, with overseas visitors spending £28.4 billion in the UK in 2019. This figure dropped to £6.2 billion in 2020 as a result of the COVID-19 pandemic and dropped further to £5.6 billion in 2021.
The latest figures show visitor spending has roughly returned to pre-pandemic levels, with overseas visitors spending £26.5 billion in 2022.
Sources [ 4 ][ 5 ]
Average spend per visit by country
The average amount someone spends on a trip to the UK varies depending on which country the visitor travels from. The average amount spent on a trip to the UK across visitors from all countries is £875. Visitors from China spent the most on average with £8,779 per visit (roughly 10 times the amount spent on average by all visitors). This was followed by visitors from the Middle East (not including UAE) with an average of £3,754 per visit.
Visitors who spent the least on average when visiting the UK were from Poland (£321) and Hungary (£364).
Data from 2020 was not available due to the COVID-19 pandemic.Source [ 6 ]
The number of nights spent in the UK by overseas visitors decreased slightly from 312.6 million in 2017 to 298.6 million in 2019, a 7.3% decrease in this period.
Unsurprisingly, like the number of visitors and the average spend, the number of nights spent in the UK by international visitors was also affected by COVID-19. Figures for 2021 show that overseas visitors spent 93.5 million nights in the UK, a 70% decrease compared to 2019.
Sources [ 3 ]
London is consistently the most-visited city in the UK, with 16.1 million overnight visitors from overseas in 2022. The second most visited city is Edinburgh with 1.8 million visitors, then Manchester with 1.2 million, followed by Birmingham with 803,000.
Source [ 4 ]
You’ll find a number of popular tourist attractions across the UK, from museums and art galleries to parks and beaches; let’s take a look at the most-visited attractions in the UK.
The most popular attraction in the UK in 2022 was the Crown Estate at Windsor Great Park which attracted 5.6 million visitors. Coming second on the list was the National History Museum with 4.6 million visitors, followed by the British Museum with 4 million visitors.
Source [ 7 ]
Outbound tourism statistics from the ONS show that UK residents mostly visit countries in Europe, with 51.9 million visits to European countries in 2022. This means that visits to Europe make up 79.5% of outbound travel by people living in the UK. [ 8 ]
Most-visited countries by UK residents
The most popular country for UK residents to visit in 2022 was Spain, with 15.6 million visits of at least one night. This was followed by France with 7.4 million visits, and Italy with 3.9 million visits.
Holidaying in the UK has become a popular pastime for British people, with staycations offering a number of benefits compared to travelling abroad. Let’s take a look at some of the latest domestic tourism statistics for the UK.
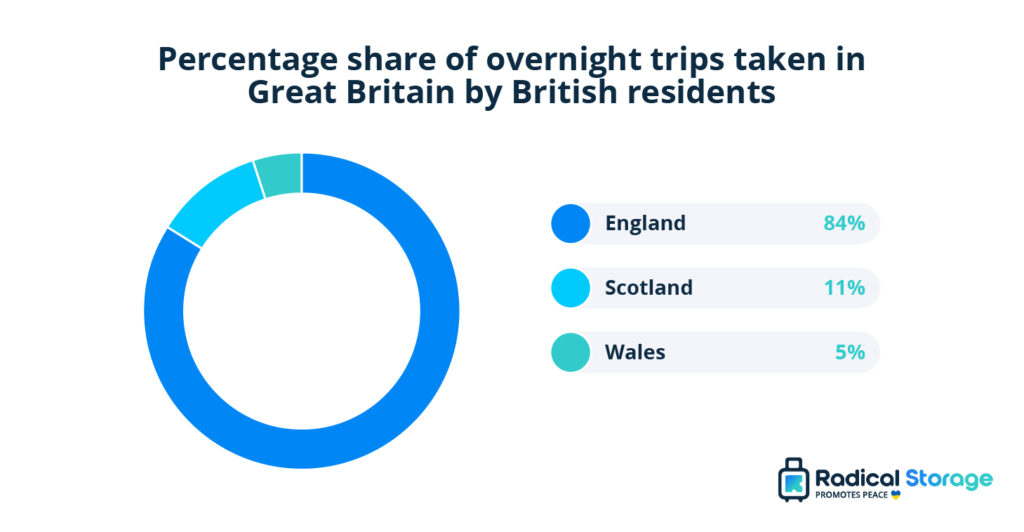
- In 2021, there were 118.9 million overnight trips taken in Great Britain by British residents. Of these trips, England was the most popular destination with an 84% share of the trips (100 million trips). Scotland was the second most popular destination with an 11% share of the trips (13 million trips). Wales was the third most popular destination with a 5% share of the trips (6 million trips).
- The average length of stay for a domestic overnight trip in Great Britain was 3.5 nights.
- The total expenditure on domestic tourism in Great Britain in 2021 was £27.2 billion.
- Of this expenditure, £22.2 billion was spent in England, £2.8 billion was spent in Scotland, and £2.2 billion was spent in Wales.
Sources [ 9 ] [ 10 ]
Why do people choose a staycation in the UK?
- The desire for budget-friendly holidays is on the rise, with 46% of people saying their budget for a staycation is £200 per person or less, and 75% say they will prioritise value for money when looking to book a holiday.
- Holidaymakers want to explore the outdoors – 44% of people said they would like to see more national parks in the UK on their next holiday.
- People want to take a trip with their pets, with 40% of UK travellers saying they will look for pet-friendly accommodation for a UK staycation.
- Scotland is becoming a popular destination for British travellers with 40% of respondents saying Scotland is top of their list for a UK holiday. [ 11 ]
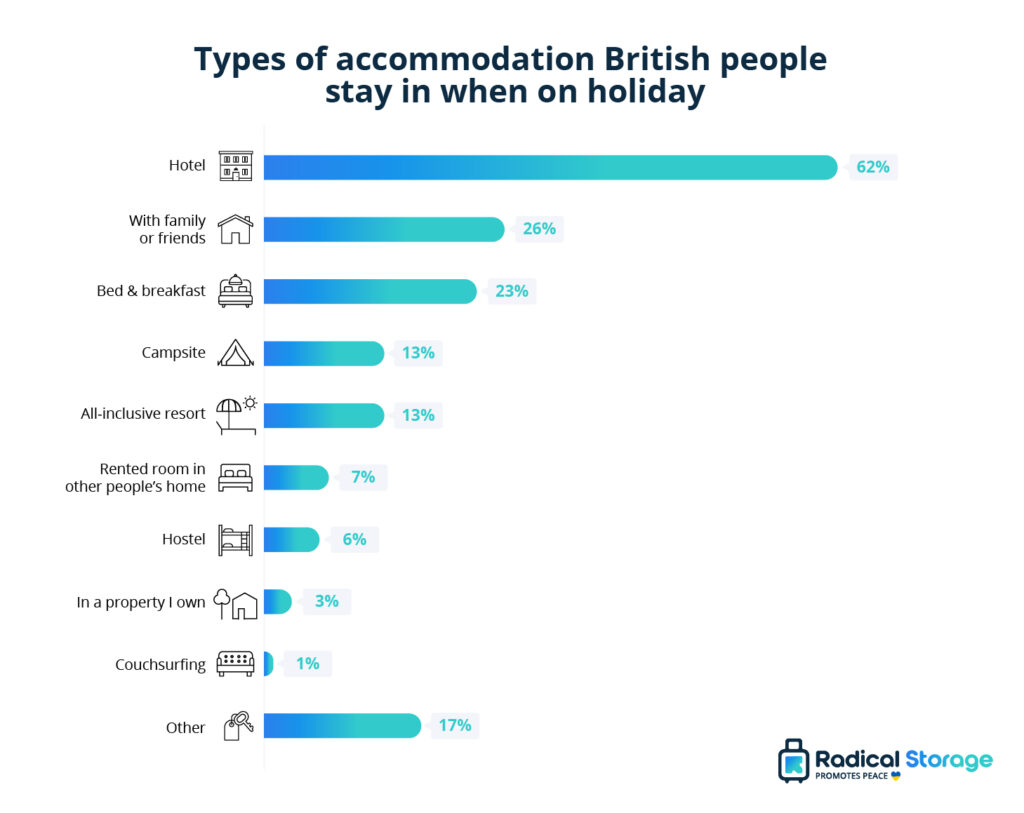
We looked at the types of accommodation British people choose to stay in when they go on holiday, either abroad or in the UK.
The most popular accommodation was a hotel, with 62% of people saying they had stayed at a hotel while on holiday in the past three years. This was followed by staying with family or friends (26%), and staying at a bed and breakfast (23%).
Source [ 12 ]
According to the Greater London Authority, there were 11.2 million international visits to London in 2022. This is an increase of 260% from 2021 when there were 3.5 million international visits to London. The increase in tourism is due to a number of factors, including the easing of travel restrictions after COVID-19, the strong pound, and London continuing to be a popular destination for tourists. [ 13 ]
Total visits to London
In 2021, there were 7.8 million visits to London from national and international tourists, with a total spend of £7.56 million. This was a 64% decrease in spending compared to the pre-pandemic figure of £2.1 billion in 2019.
Most popular visitor attractions in London
The two most-visited attractions in London also fall in the top three most visited tourist sites in the UK, the Natural History Museum and the British Museum. Third on the list is the Tate Modern Gallery with 3.8 million visitors, and next is the Southbank Centre which received 2.9 million visitors in 2022.
More London tourism facts
- One in seven jobs in London is related to the travel and tourism industry, and this sector makes up 12% of London’s GDP.
- Visiting London is the third biggest reason people say they come to the UK, and the city accounted for 53% of international visits to the UK in 2019.
- 15% of people who visit London from overseas come as part of a longer trip, including other areas in the UK. [ 15 ]
[1] https://www.statista.com/outlook/mmo/travel-tourism/united-kingdom
[2] https://www.visitbritain.org/sites/default/files/vb-corporate/Documents-Library/documents/foresight_165_regional_activities.pdf
[3] https://www.ons.gov.uk/peoplepopulationandcommunity/leisureandtourism/timeseries/gmat/ott
[4] https://www.ons.gov.uk/peoplepopulationandcommunity/leisureandtourism/articles/traveltrends/2022
[5] https://www.ons.gov.uk/peoplepopulationandcommunity/leisureandtourism/datasets/overseasresidentsvisitstotheuk
[6] https://www.ons.gov.uk/peoplepopulationandcommunity/leisureandtourism/articles/traveltrends/2021
[7] https://www.alva.org.uk/details.cfm?p=423
[8] https://www.ons.gov.uk/peoplepopulationandcommunity/leisureandtourism/datasets/ukresidentsvisitsabroad
[9] https://www.visitbritain.org/gb-domestic-overnight-tourism-latest-results
[10] https://www.gov.wales/domestic-gb-tourism-statistics-overnight-trips-2021-html
[11] https://www.traveldailymedia.com/top-five-reasons-for-expected-staycation-boom-in-2023/
[12] https://yougov.co.uk/topics/travel/trackers/what-type-of-accommodation-do-brits-stay-in-when-on-holiday
[13] https://www.london.gov.uk/who-we-are/what-london-assembly-does/questions-mayor/find-an-answer/tourism-london-6
[14] https://www.cityoflondon.gov.uk/things-to-do/tourism-trends-and-strategies/tourism-statistics
[15] https://www.london.gov.uk/press-releases/mayoral/tourism-may-not-recover-until-middle-of-decade

Giacomo Piva
Giacomo Piva, CMO and Co-founder at Radical Storage Giacomo Piva has worked in the travel industry since 2008 across multiple niches including tourist transportation, luxury travel, and ecotourism. He now focuses on growing the global luggage network, Radical Storage , which is currently available in over 500 cities, in the likes of London, Paris, New York, and Rio de Janeiro. Giacomo has a bachelor's degree in Communication Science and an in-depth experience across travel marketing, especially in improving a brand’s digital presence within the industry.
Travel, Tourism & Hospitality
Industry-specific and extensively researched technical data (partially from exclusive partnerships). A paid subscription is required for full access.
- Outbound tourism expenditure in the UK 2007-2023
Spending on trips abroad by residents of the United Kingdom increased in 2023, following a dramatic decline with the onset of the coronavirus (COVID-19) pandemic. In total, expenditure on visits abroad from the UK amounted to 72.44 billion British pounds in 2023. The annual rise in spending on outbound visits was mainly driven by a sharp increase in the number of visits abroad from the United Kingdom .
Total expenditure on visits abroad from the United Kingdom from 2007 to 2023 (in million GBP)
- Immediate access to 1m+ statistics
- Incl. source references
- Download as PNG, PDF, XLS, PPT
Additional Information
Show sources information Show publisher information Use Ask Statista Research Service
United Kingdom
2007 to 2023
2021 data excludes the Eurotunnel and the Irish border.
Figures from prior to 2019 were taken from earlier reports. Estimates based on the International Passenger Survey (IPS) . Interviews are conducted with passengers arriving and departing from the country and include visits for all purposes, including for vacation, business, study, visiting friends and family, and other leisure purposes.
This statistic is using original data from the Office for National Statistics and includes copyright material from © Crown, licensed under the Open Government License v3.0 .
Other statistics on the topic Travel and tourism in the United Kingdom (UK)
Leisure Travel
- Leading outbound travel destinations from the UK 2019-2023
- Inbound tourist visits to the UK 2002-2023
- Leading UK cities for international tourism 2019-2023, by visits
Accommodation
- Most popular hotel brands in the UK Q2 2024
To download this statistic in XLS format you need a Statista Account
To download this statistic in PNG format you need a Statista Account
To download this statistic in PDF format you need a Statista Account
To download this statistic in PPT format you need a Statista Account
As a Premium user you get access to the detailed source references and background information about this statistic.
As a Premium user you get access to background information and details about the release of this statistic.
As soon as this statistic is updated, you will immediately be notified via e-mail.
… to incorporate the statistic into your presentation at any time.
You need at least a Starter Account to use this feature.
- Immediate access to statistics, forecasts & reports
- Usage and publication rights
- Download in various formats
* For commercial use only
Basic Account
- Free Statistics
Starter Account
- Premium Statistics
The statistic on this page is a Premium Statistic and is included in this account.
Professional Account
- Free + Premium Statistics
- Market Insights
1 All prices do not include sales tax. The account requires an annual contract and will renew after one year to the regular list price.
Statistics on " Travel and tourism in the United Kingdom (UK) "
- Travel and tourism's total contribution to GDP in the UK 2019-2022
- Distribution of travel and tourism expenditure in the UK 2019-2022, by type
- Distribution of travel and tourism expenditure in the UK 2019-2022, by tourist type
- Travel and tourism's total contribution to employment in the UK 2019-2022
- Median full-time salary in tourism and hospitality industries in the UK 2023
- CPI inflation rate of travel and tourism services in the UK 2023
- Inbound tourist visits to the UK 2019-2022, by purpose of trip
- Leading inbound travel markets in the UK 2019-2022, by number of visits
- Leading inbound travel markets in the UK 2023, by growth in travel demand on Google
- Number of overnight stays by inbound tourists in the UK 2004-2022
- International tourist spending in the UK 2004-2024
- Leading inbound travel markets for the UK 2019-2023, by spending
- Number of outbound tourist visits from the UK 2007-2023
- Outbound tourism visits from the UK 2019-2022, by purpose
- Leading outbound travel markets in the UK 2023, by growth in travel demand on Google
- Number of outbound overnight stays by UK residents 2011-2023
- Domestic overnight trips in Great Britain 2010-2022
- Domestic tourism trips in Great Britain 2018-2022, by purpose
- Number of domestic overnight trips in Great Britain 2023, by destination type
- Number of tourism day visits in Great Britain 2011-2022
- Total domestic travel expenditure in Great Britain 2019-2022
- Domestic overnight tourism spending in Great Britain 2010-2022
- Expenditure on domestic day trips in Great Britain 2011-2022
- Average spend on domestic summer holidays in the United Kingdom (UK) 2011-2023
- Number of accommodation businesses in the UK 2008-2022
- Number of accommodation enterprises in the UK 2018-2021, by type
- Turnover of accommodation businesses in the UK 2008-2022
- Turnover of accommodation services in the UK 2015-2022, by sector
- Number of hotel businesses in the UK 2008-2022
- Consumer expenditure on accommodation in the UK 2005-2022
- Attitudes towards traveling in the UK 2024
- Travel frequency for private purposes in the UK 2024
- Travel frequency for business purposes in the UK 2024
- Share of Britons taking days of holiday 2019-2023, by number of days
- Share of Britons who did not take any holiday days 2019-2023, by gender
- Share of Britons who did not take any holiday days 2019-2023, by age
- Leading regions for summer staycations in the UK 2024
- Preferred methods to book the next overseas holiday in the UK October 2022, by age
- Travel & Tourism market revenue in the United Kingdom 2019-2029, by segment
- Travel & Tourism market revenue growth in the UK 2020-2029, by segment
- Revenue forecast in selected countries in the Travel & Tourism market in 2024
- Number of users of package holidays in the UK 2019-2029
- Number of users of hotels in the UK 2019-2029
- Number of users of vacation rentals in the UK 2019-2029
Other statistics that may interest you Travel and tourism in the United Kingdom (UK)
- Basic Statistic Travel and tourism's total contribution to GDP in the UK 2019-2022
- Basic Statistic Distribution of travel and tourism expenditure in the UK 2019-2022, by type
- Basic Statistic Distribution of travel and tourism expenditure in the UK 2019-2022, by tourist type
- Basic Statistic Travel and tourism's total contribution to employment in the UK 2019-2022
- Premium Statistic Median full-time salary in tourism and hospitality industries in the UK 2023
- Premium Statistic CPI inflation rate of travel and tourism services in the UK 2023
Inbound tourism
- Basic Statistic Inbound tourist visits to the UK 2002-2023
- Premium Statistic Inbound tourist visits to the UK 2019-2022, by purpose of trip
- Basic Statistic Leading inbound travel markets in the UK 2019-2022, by number of visits
- Premium Statistic Leading inbound travel markets in the UK 2023, by growth in travel demand on Google
- Premium Statistic Number of overnight stays by inbound tourists in the UK 2004-2022
- Premium Statistic International tourist spending in the UK 2004-2024
- Premium Statistic Leading inbound travel markets for the UK 2019-2023, by spending
- Premium Statistic Leading UK cities for international tourism 2019-2023, by visits
Outbound tourism
- Premium Statistic Number of outbound tourist visits from the UK 2007-2023
- Premium Statistic Outbound tourism visits from the UK 2019-2022, by purpose
- Premium Statistic Leading outbound travel destinations from the UK 2019-2023
- Premium Statistic Leading outbound travel markets in the UK 2023, by growth in travel demand on Google
- Premium Statistic Number of outbound overnight stays by UK residents 2011-2023
- Premium Statistic Outbound tourism expenditure in the UK 2007-2023
Domestic tourism
- Premium Statistic Domestic overnight trips in Great Britain 2010-2022
- Premium Statistic Domestic tourism trips in Great Britain 2018-2022, by purpose
- Premium Statistic Number of domestic overnight trips in Great Britain 2023, by destination type
- Premium Statistic Number of tourism day visits in Great Britain 2011-2022
- Premium Statistic Total domestic travel expenditure in Great Britain 2019-2022
- Premium Statistic Domestic overnight tourism spending in Great Britain 2010-2022
- Premium Statistic Expenditure on domestic day trips in Great Britain 2011-2022
- Premium Statistic Average spend on domestic summer holidays in the United Kingdom (UK) 2011-2023
- Premium Statistic Number of accommodation businesses in the UK 2008-2022
- Premium Statistic Number of accommodation enterprises in the UK 2018-2021, by type
- Premium Statistic Turnover of accommodation businesses in the UK 2008-2022
- Premium Statistic Turnover of accommodation services in the UK 2015-2022, by sector
- Premium Statistic Number of hotel businesses in the UK 2008-2022
- Basic Statistic Most popular hotel brands in the UK Q2 2024
- Premium Statistic Consumer expenditure on accommodation in the UK 2005-2022
Travel behavior
- Premium Statistic Attitudes towards traveling in the UK 2024
- Premium Statistic Travel frequency for private purposes in the UK 2024
- Premium Statistic Travel frequency for business purposes in the UK 2024
- Premium Statistic Share of Britons taking days of holiday 2019-2023, by number of days
- Premium Statistic Share of Britons who did not take any holiday days 2019-2023, by gender
- Premium Statistic Share of Britons who did not take any holiday days 2019-2023, by age
- Premium Statistic Leading regions for summer staycations in the UK 2024
- Premium Statistic Preferred methods to book the next overseas holiday in the UK October 2022, by age
- Premium Statistic Travel & Tourism market revenue in the United Kingdom 2019-2029, by segment
- Premium Statistic Travel & Tourism market revenue growth in the UK 2020-2029, by segment
- Premium Statistic Revenue forecast in selected countries in the Travel & Tourism market in 2024
- Premium Statistic Number of users of package holidays in the UK 2019-2029
- Premium Statistic Number of users of hotels in the UK 2019-2029
- Premium Statistic Number of users of vacation rentals in the UK 2019-2029
Further related statistics
- Basic Statistic Outbound travel expenditure in Europe 2012-2028
- Basic Statistic Outbound travel expenditure in Russia 2011-2023
- Basic Statistic Outbound travel expenditure in Hungary 2012-2028
- Premium Statistic UK outbound travel: average spend per trip to the EU 2011-2018
- Premium Statistic Share of outbound travelers in China 2017-2018, by city tier
- Premium Statistic Italy: summer holiday budget by destination 2017
- Premium Statistic Outbound travel expenditure in Belgium 2010-2018
- Premium Statistic Outbound tourism expenditure of Portuguese travelers 2010-2021
- Premium Statistic Outbound travel spend in 2012 and 2023, by region
- Premium Statistic Outbound travel expenditure in Austria 2012-2018
- Premium Statistic Chile: foreign exchange outflows from tourism 2018, by category
- Premium Statistic Average spend per person on outbound travel in Russia 2013-2017
- Basic Statistic Number of outbound trips made from Portugal 2012-2022
- Premium Statistic Preferred months of Swedes for traveling abroad 2018
- Basic Statistic Outbound travel expenditure in Croatia 2012-2018
- Premium Statistic Uruguay: number of outbound tourist departures 2010-2019
Further Content: You might find this interesting as well
- Outbound travel expenditure in Europe 2012-2028
- Outbound travel expenditure in Russia 2011-2023
- Outbound travel expenditure in Hungary 2012-2028
- UK outbound travel: average spend per trip to the EU 2011-2018
- Share of outbound travelers in China 2017-2018, by city tier
- Italy: summer holiday budget by destination 2017
- Outbound travel expenditure in Belgium 2010-2018
- Outbound tourism expenditure of Portuguese travelers 2010-2021
- Outbound travel spend in 2012 and 2023, by region
- Outbound travel expenditure in Austria 2012-2018
- Chile: foreign exchange outflows from tourism 2018, by category
- Average spend per person on outbound travel in Russia 2013-2017
- Number of outbound trips made from Portugal 2012-2022
- Preferred months of Swedes for traveling abroad 2018
- Outbound travel expenditure in Croatia 2012-2018
- Uruguay: number of outbound tourist departures 2010-2019
IMAGES
VIDEO
COMMENTS
UK residents spent £15.5 billion on visits abroad in 2021, an increase of 13% compared with modelled data for 2020. The average spend per visit was £808 in 2021. Values for 2020 are not known, but this was an increase from £670 in 2019. Some of this increase is because of the longer time spent abroad.
In 2022, the total contribution of travel and tourism to the UK's GDP rose to an estimated 237.1 billion British pounds. While this figure was 4.6 percent lower than it had been in 2019, it ...
This was a decrease of 24%. There were 12.1 million holiday visits to the UK in 2022, which were 39% of the total visits. This makes holidays the most common reason for visiting the UK. This is a change from 2021 when visiting friends or relatives was the most popular reason for travel to the UK.
UK residents spent £13.8 billion on visits abroad in 2020, a fall of 78% compared with 2019. The average spend per visit has decreased from £670 in 2019 to £578 in 2020, contributing to the overall decrease in spending. Overseas spending in the UK also fell to £6.2 billion; this was 78% less than in 2019 (Figure 2).
Premium Statistic Outbound tourism visits from the UK 2019-2022, by purpose Premium Statistic Number of holiday visits abroad from the UK 2011-2023
The UK Tourism Satellite Account (UK-TSA): 2021. Annual inbound, outbound and domestic expenditure on tourism, internal tourism consumption and employment for the tourism industries. From: Office ...
In 2022, holidays accounted for the highest outbound visits, with roughly 45.6 million trips made for this purpose. However, the number of vacations abroad was still 22 percent lower than in 2019 ...
The Office for National Statistics (ONS) paints a stark picture. Compared to 2019, UK Outbound Tourism visits in 2020 saw a staggering 74% decline - a drop from a pre-pandemic high of 93.1 million visits to a mere 23.8 million [ONS, Overseas travel and tourism: 2020]. This represents the lowest level of outbound travel since 1985.
The loss in T&T GVA accounts for 36% of the total GVA contraction in the UK in 2020, demonstrating the disproportionate impact of the pandemic on travel & tourism activity. In 2021, direct T&T GVA will begin to recover but will remain 53% below 2019 levels, contributing 1.9%pts to the wider economy. Prolonged restrictions on the T&T sector ...
Travel trends: 2023. Annual estimates of completed international visits to and from the UK, and earnings and expenditure associated with these visits. Tourism to the UK, and UK residents travelling abroad, reasons for travel and money spent. The statistics on UK residents travelling abroad are an informal indicator of living standards.
Reviving inbound tourism: The UK's journey to recovery. The latest inbound tourism forecast for 2023 anticipates 37.5 million visits, an impressive 92% recovery compared to the pre-pandemic level in 2019. In 2023, inbound visitors are projected to spend £30.9 billion, surpassing the 2019 level by 109% in nominal terms.
We look at the latest outbound tourism statistics. Home. ... 2021: 19,142,000: 2022: 70,950,000: 2023: ... £551.3 million was lost to credit, debit and payment card fraud in the UK in 2023. We look at the latest statistics on card fraud in the UK. Onmo Credit Card review: Features & costs scored.
UK residents spent £72.4 billion on visits abroad in 2023, an increase of £13.9 billion compared with 2022. This was a 16% increase when compared with 2019. The average spend per visit was £839 in 2023, which was 2% more than in 2022 and 25% higher than 2019 (£669).
Outbound travel trips as percentage of households in Singapore 2013-2021 Number of outbound visits from the United Kingdom (UK) 2011-2019, by mode of travel Outbound travel trips as percent of ...
Visits to the UK by overseas residents, visits abroad by UK residents and spending by travellers, using provisional passenger traffic data. Overseas travel and tourism: October 2021 provisional ...
11. The top outbound travel destination for UK residents in 2021 was followed by France, Portugal, and Greece. [Statista] The UK is actually the top inbound travel market for France, with 13 million visits recorded in 2018. 12. Great Britain is an important market for the Republic of Ireland, making up 42% of all overseas visits to the country.
Key Statistics. 31.2 million people visited the UK from overseas in 2022, a 388.7% increase from 2021 as a result of travel restrictions being lifted after COVID-19.; The UK's travel and tourism industry is worth an estimated £31.38 billion ($39.14 billion USD) and is expected to reach £33.41 billion ($41.67 billion USD) by 2027.; Overseas visitors spent £26.5 billion in the UK in 2022 ...
Data for the months within 2021 now correctly sum to annual totals published in other travel and tourism tables. As a result of a processing error, estimates of visits by overseas residents from Europe for July to September 2022 were overestimated by 1,000. We have now corrected this data.
Namely, in 2018, Europe accounted for the lion's share of outbound tourism expenditure, reaching £29.6 billion, whereas in North America it was much lower, estimated at £4.8 billion. 8. In 2019, the average spend per trip was £670. (Statista) The average spending abroad per trip for any purpose by UK residents was £670.
There were 3.0 million visits to the UK by overseas visitors in June 2022; an increase from 2.8 million visits in May 2022. Visits by overseas visitors to the UK in June 2022 are still lower than pre-coronavirus (COVID-19) pandemic levels, down 19% from 3.7 million in June 2019. Overseas residents spent £2.7 billion in the UK in June 2022.
Premium Statistic UK outbound travel: spending in Europe 2011-2019 ... Number of international tourist arrivals in India 2010-2021; ... Office for National Statistics (UK), Number of visits abroad ...
Leading outbound travel markets in the UK 2023, by growth in travel demand on Google ... Number of accommodation enterprises in the UK 2018-2021, by type ... Office for National Statistics (UK ...
In total, expenditure on visits abroad from the UK amounted to 72.44 billion British pounds in 2023. The annual rise in spending on outbound visits was mainly driven by a sharp increase in the ...