Slips, Trips, and Falls: 22 Work Injury Statistics for 2023

Marija Lazic
May 20, 2023
Table of contents

General Work Injury Statistics
Workplace death statistics, osha statistics, work injury statistics for the us, workplace injury statistics by state, most common workplace injuries according to osha.
A day’s work can be dangerous to well-being, no matter where you work or what you do. And while some jobs are generally safe, others can be quite hazardous. What are the actual numbers, however? Read our work injury statistics to find out just that.
Editor’s Choice
- The total number of injuries per 100 full-time workers remained unchanged at 2.8 in 2020.
- Workplace injury rates have been on the decline since 1972, dropping by 75%.
- Occupational fatalities increased by 2% in 2019.
- 40% of all occupational fatalities in 2019 were attributed to transportation incidents.
- Slips, trips, and falls, overexertion, bodily reactions, as well as contact with objects and equipment account for more than 84% of all non-fatal injuries involving days away from work.
- In the US, 36,840 injuries in workplaces were caused by exposure to harmful substances or environments in 2020.
- About 2.3 million people worldwide have work-related accidents every year.
1. Slips, trips, falls, overexertion, bodily reactions, and contact with objects and equipment account for more than 84% of all non-fatal injuries involving days away from work.
( Injury Facts )
2. About 2.3 million people worldwide have work-related accidents every year.
The International Labor Organization reports that every year, 2.3 million men and women experience accidents (injuries or exposure to diseases) while working. This translates into over 6,000 deaths every single day.
3. There are about 340 million occupational accidents and 160 million victims of work-related illnesses annually.
Occupational injuries are a commonplace occurrence, with 340 million occupational accidents happening every year. There are 160 million victims of work-related illnesses annually.
4. 40% of all occupational fatalities in 2019 were attributed to transportation incidents.
( Fit Small Business )
Transportation incidents were the leading cause of occupational fatalities in 2019, causing about 40% of the total number. The 2,122 deaths represent a 2% increase from the previous year’s numbers.
5. Latino workers experienced 3.7 fatal occupational injuries per 100,000 workers from 2018 to 2020.
( Statista )
Despite the number of fatal occupational injuries per 100,000 workers in the US falling from 4.2 in 2006 to 3.5 in 2018, Latino workers had a higher average death rate, experiencing 3.7 fatal occupational injuries per 100,000.
6. 20% of worker fatalities in 2019 in the US private sector were in construction.
Workplace fatality statistics by the Occupational Safety and Health Administration revealed that about 20% of worker fatalities in the private industry for the year 2019 were in construction.
7. In 2019, there were about 15 deaths every day or more than 100 each week in the US work industry.
( US Bureau of Labor Statistics )
More than 100 workers a week or 15 people per day were reported to have died in their workplace in 2019 on average.
8. A total of 111 workers were killed at work in Great Britain in 2019/20.
( DAC Beachcroft )
According to workplace injury statistics for 2020 gathered by the Health and Safety Executive, 111 workers died in their workplace in Great Britain in 2019/20; 38 less than in the previous year.
9. Hazardous substances alone are estimated to cause approximately 650,000 deaths per year.
According to an International Labor Organization report, diseases related to work cause the most deaths among workers. More than 650,000 deaths globally were caused by hazardous substances alone. The same report found that older and younger workers were at higher risk of workplace injuries.
10. $5.82 billion was appropriated for the Occupational Safety and Health Administration in the fiscal year 2020.
Federal appropriations for OSHA in 2020 amounted to $581,787,000. For 2019, $557,787,000 was appropriated.
11. There are 1,850 inspectors working for OSHA.
As of 2020, OSHA employs 1,850 inspectors responsible for the well-being of 130 million workers. They are employed at more than eight million worksites around the US. This means there is approximately one compliance officer for every 70,000 workers.
12. There were more than 33,000 OSHA federal inspections for the fiscal year of 2019.
There were 33,393 total federal inspections in 2019 and 42,063 total State Plan inspections.
13. The total number of injuries per 100 full-time workers remained unchanged at 2.8 in 2020.
(US Bureau of Labor Statistics)
According to the US Bureau of Labor Statistics’ Employer-Related Workplace Injuries and Illnesses News Release , as of November 2020, 2.8 of every 100 workers were injured at their workplace. This number has remained unchanged since 2018.
14. Occupational fatalities increased by 2% in 2019.
While there was a decline in workplace injuries, work accidents statistics for fatalities paint a grim picture: 5,333 workplace fatalities were recorded in 2019, representing a 2% increase in fatalities from 2018. As a matter of fact, since 2010, the number of fatalities has been on the rise.
15. US workplace injury rates have been on the decline since 1972, dropping by 75%.
As of 2019, the US recorded nearly 50 years of gradually reduced occupational hazards, as workplace injuries have decreased by 75% since 1972.
16. Direct costs of the top 10 most disabling US workplace injuries in 2020 amounted to $52.93 billion.
Workplace injury statistics by Statista inform us that the top 10 most disabling US workplace injuries had a total direct cost of $52.93 billion.
17. Overexertion involving outside sources was responsible for 23.5% of all workplace injuries in the US .
This made it the leading cause of most disabling US workplace injuries in 2020. In second place were the falls on the same level, responsible for 18.2% of all injuries. Being struck by an object or equipment and falling on a lower level accounted for 10.3% and 9.6% of disabling injuries, respectively.
18. Nearly 37,000 injuries in workplaces were caused by exposure to harmful substances or environments.
Exposure to harmful substances or environments was the sixth most common cause of occupational injuries in 2019 in the US, accounting for almost 37,000 injuries.
19. California and Texas had the highest number of workplace deaths for 2019: 451 and 608, respectively.
These two states also had the most workplace injuries - 3,799 in California and 1,876 in Texas. However, despite these high numbers, these states had relatively low rates of work-related fatalities. California had 2.3 fatalities per 100,000 full-time workers, and Texas had 3.8 per 100,000.
20. Alaska had the highest incidence and fatality rates for the number of accidents per 100 full-time workers.
While Alaska may not have had the highest number of injuries or fatalities, with 14.1 incidents and fatalities for the number of accidents per 100 full-time workers, it has the highest incidence and fatality rates in the US.
21. OSHA estimates that powered industrial trucks or forklifts are responsible for around 96,700 injuries every year.
( medexpress ), of these injuries, 35,000 are considered severe., 22. explosions and fires are responsible for 3% of workplace injuries..
( Thomas Marchese )
They also have the highest casualty rate of all probable workplace accidents.
It would seem as though completely eradicating workplace accidents is impossible. With so many high-risk industries such as construction, the chance that there could occasionally be an accident leading to serious injury or death is highly probable.
However, work injury statistics show that each year, the number of these accidents in the US is decreasing thanks to regulatory bodies such as OSHA and the Bureau of Labor Statistics, as well as increased compliance with work safety guidelines .
Frequently Asked Questions
What are some worker rights related to injury and illness reporting?
Workers have the right to report an injury and review a current log. They also have the right to review the summary of injuries and illnesses in the workplace.
What is the most common workplace injury?
According to workplace accidents statistics, the most common workplace injuries are slips, trips, and falls. Overexertion and bodily reaction are also among common workplace injuries.
How many workplace injuries are reported each year?
The International Labor Organization reports that every year, 2.3 million men and women experience accidents (injuries or exposure to diseases) in their workplace.
What is the #1 cause of work-related fatalities?
As of 2019, falls were the number one cause of work-related fatalities. Approximately 36.5% of all deaths in the workplace occur as a result of employees falling.
What industry has the highest injury rate?
According to work injury statistics, the industry with the highest injury rate is the protective services industry. The industry sector experiencing the highest fatality rates per 100,000 workers, on the other hand, is the sector of agriculture, forestry, fishing, and hunting.
What is the most common non-fatal injury in the workplace?
According to the Bureau of Labor Statistics, sprains, strains, and tears are the most common non-fatal workplace injury.
Recent Posts

How To Ask for a Divorce? The Do’s and Don’ts

Jenifer Kuadli
June 08, 2022

28 Types of Lawyers: The Options and the Practice
September 10, 2021

30 Mind-Blowing Interview Statistics to Get You Going in 2023
February 01, 2021

7 Rules for Success: Top Lawyers Share Their Insight

Branka Vuleta
April 03, 2022
We’ve Used the Latest Data Available to Compile These Work Injury Statistics in 2023
2023 non-fatal work injury statistics, 2023 fatal work injury statistics, fast facts: 5 most notable work injury statistics in 2023, what do all of these statistics mean for workers in the u.s., 5 most important facts for injured workers, 2023 work injury statistics: complete guide to the latest data available.

If you’re looking for 2023 work injury statistics, you’ve come to the right place. We’ve compiled the data available from the U.S. Bureau of Labor Statistics (BLS), U.S. Centers for Disease Control and Prevention (CDC), and numerous other sources. The numbers on this page reflect the latest data available from these sources as of January 2023.
While these are the latest data available for compiling workplace injury statistics in 2023, in some cases the most-recent data still reflect workplace accidents and injuries in 2020 and 2021. This is not uncommon, as it typically takes large government agencies like the BLS and CDC at least a couple of years to compile all of their data.
According to the BLS , there were 2.6 million reported non-fatal workplace injuries in the private sector in 2021 (the most recent year for which data are available in 2023). While this reflects a 1.8 percent decrease from 2020, the rate of workplace injuries (2.7 per 100 full-time equivalent (FTE) workers) remained unchanged. As a result, the drop in reported workplace injuries in 2021 reflects not an improvement in workplace safety, but instead a drop in the overall U.S. employment rate. Since the rate of workplace injuries did not change, the drop in workplace injuries must necessarily be attributable to a drop in workers.

This is consistent with what we’ve seen in the media over the past two years, and we aren’t surprised to see this type of work injury statistic in 2023. The unemployment rate has remained steadily high since the start of the COVID-19 pandemic in 2020. Yet, while companies’ payroll liabilities may be down, their revenues have been down as well (in many, but not all, cases), so many companies aren’t able to devote additional resources—or even the same resources—to workplace safety compared to what they have done in the past.
The BLS also suggests that the drop in non-fatal work injuries in 2021 was attributable, in part, to a drop in reported illnesses. This, too, is likely due to the impacts of the COVID-19 pandemic, as 2020 was much worse than 2021. The BLS reports :
“[P]rivate industry employers report[ed] 365,200 nonfatal illnesses in 2021, down from 544,600 in 2020, a drop of 32.9 percent. This decrease was driven by a 37.1 percent decrease in employer reported respiratory illness cases in 2021 at 269,600, down from 428,700 in 2020.”
Notably, with the number of workplace injuries declining in 2021, the overall reduction in non-fatal injury reports for the year actually reflects an increase in traumatic and repetitive stress injuries. As the BLS also reports, “[t]he rate of injury cases increased in 2021, with private industry employers reporting a rate of 2.3 cases per 100 FTE workers compared to 2.2 cases in 2020.”
Here is a look at the five-year trend for non-fatal work injury statistics, based on the most-recent data available in 2023:
- 2017: 8 Non-fatal work injuries per 100 FTE, including 1.5 resulting in time away from work, job restrictions, or job transfer
- 2018: 8 Non-fatal work injuries per 100 FTE, including 1.6 resulting in time away from work, job restrictions, or job transfer
- 2019: 8 Non-fatal work injuries per 100 FTE, including 1.5 resulting in time away from work, job restrictions, or job transfer
- 2020: 7 Non-fatal work injuries per 100 FTE, including 1.7 resulting in time away from work, job restrictions, or job transfer
- 2021: 7 Non-fatal work injuries per 100 FTE, including 1.7 resulting in time away from work, job restrictions, or job transfer
Based on these work injury statistics from the BLS, perhaps the most significant takeaway in 2023 is that employers do not appear to be prioritizing worker safety. With all of the resources and technology available in 2023, there is no excuse for still having virtually the same rate of work injuries as we had seven years ago. While many companies promote their commitment to “continuous improvement” and “zero defect” safety cultures, it is clear that there is still significant room for improvement across the board.
While the BLS’s data indicate that there were 2.6 reported non-fatal work injuries in the private sector in 2021, the National Safety Council (NSC) reports that the total number of non-fatal work injuries during the year was far higher. In 2023, the NSC is reporting a total of 4.26 million “work-related medically consulted injuries” two years ago. This is a huge difference, and it highlights the fact that far too many work injuries go unreported. This is a longstanding trend, and it is a trend we expect to see continue in 2023’s workplace injury statistics when they become available.
Here are some more 2023 work injury statistics from the BLS and CDC regarding non-fatal accidents in the workplace (based on the most-recent data available as of January 2023):
- Industry with the Highest Number of Non-Fatal Workplace Injuries: Healthcare (453,200)
- Industries with Next-Highest Numbers of Non-Fatal Workplace Injuries: Retail trade (352,800); Manufacturing (334,500); Transportation and Warehousing (235,200); Accommodation and Food Services (182,500); Construction (162,500)
- Industry with the Highest Rate of Non-Fatal Workplace Injuries: Transportation and Warehousing (4.3 per 100 FTE); Agriculture, Forestry, Fishing, and Hunting (4.3 per 100 FTE)
- Industries with Next-Highest Rates of Non-Fatal Workplace Injuries: (Arts, Entertainment, and Recreation (3.4 per 100 FTE); Healthcare and Social Assistance (3.1 per 100 FTE); Retail Trade (3.1 per 100 FTE); Manufacturing (2.8 per 100 FTE)
- State with the Highest Number of Non-Fatal Workplace Injuries and Illnesses: California (349,100)
- States with the Next-Highest Numbers of Non-Fatal Workplace Injuries and Illnesses: Texas (178,900); New York (125,500); Pennsylvania (117,100); Illinois (102,000); Michigan (86,700); Ohio (78,000)
- Number of Work Injuries Requiring Emergency Room Treatment Per Year: Approximately 1.8 Million
- Most Common Cause of Non-Fatal Injuries Resulting in Days Missed from Work: Slips, Trips, and Falls (18 percent)
- Next Most Common Causes of Non-Fatal Injuries Resulting in Days Missed from Work: Contact with Objects and Equipment; Overexertion and Bodily Reactions; Slips and Trips Without Falls
- Worker Age Group with the Highest Rate of Work Injuries Requiring Medical Care: Age 25 and Under
- Worker Gender with the Highest Rate of Work Injuries Requiring Medical Care: Male (66 percent of All Workers Seeking Emergency Room Treatment)
The NSC has also published data on the average cost of work-related accidents and injuries. According to the organization’s most-recent statistics in 2023, the most-expensive accidents for workers are:
- Motor Vehicle Accidents - $85,311 average cost per work accident
- Burns - $54,173 average cost per work accident
- Falls - $48,575 average cost per work accident
- Caught By/Between - $44,588 average cost per work accident
- Struck By Object - $39,977
Overall, the organization reports that the average cost of work-related accidents is $41,353. Notably, however, this includes only the costs covered by workers’ compensation (i.e., medical bills and lost wages). It does not cover pain and suffering or any of the forms of non-financial loss that injured workers may be entitled to recover outside of workers’ comp.
The same is true of the NSC’s data on the average cost of work injuries. Based on the latest work injury statistics available in 2023, the most-expensive injuries for workers are:
- Amputation - $118,837 average cost per work injury
- Fracture or Dislocation - $60,934 average cost per work injury
- Other Trauma - $60,228 average cost per work injury
- Burns - $48,671 average cost per work injury
- Infection or Inflammation - $37,498 average cost per work injury
- Sprain or Strain - $33,589 average cost per work injury
- Carpal Tunnel Syndrome - $33,477 average cost per work injury
- Lacerations, Punctures, and Ruptures - $33,348 average cost per work injury
- Concussions - $33,151 average cost per work injury
- Occupational Diseases and Degeneration - $16,696 average cost per work injury or illness
Non-fatal workplace injuries aren’t the only ones on the rise. According to the BLS, CDC, and other sources, fatal workplace injuries have also been increasing based on the most-recent data available in 2023. For example, in December 2022, the BLS reported :
“There were 5,190 fatal work injuries recorded in the United States in 2021, an 8.9-percent increase from 4,764 in 2020. . . . The fatal work injury rate was 3.6 fatalities per 100,000 [FTE] workers, up from 3.4 per 100,000 FTE in 2020 and up from the 2019 pre-pandemic rate of 3.5.”
Why is the case? The simple answer is: There is no good explanation. With workforce numbers down, on-the-job fatalities should not be increasing. Yet, they are, and the latest work injury statistics in 2023 show that certain jobs in particular continue to be far more dangerous than they should be. For example, the NSC reports that the following industries continue to having the highest numbers of work-related fatalities:
- Construction (946 worker deaths in 2021)
- Transportation and Warehousing (900 worker deaths in 2021)
- Agriculture, Forestry, Fishing, and Hunting (435 worker deaths in 2021)
- Manufacturing (347 worker deaths in 2021)
- Government (311 worker deaths in 2021)
But, as with the non-fatal workplace injury statistics above, these fatal workplace injury statistics only tell part of the story. In addition to looking at the total death figures, we also have to look at the rates of death to determine which industries present the greatest risks for workers. Based on the most-recent work injury statistics in 2023, the industries with the highest rates of workplace fatalities are:
- Agriculture, Forestry, Fishing and Hunting (18.9 deaths per 100,000 workers)
- Mining (14.5 deaths per 100,000 workers)
- Transportation and Warehousing (13.3 deaths per 100,000 workers)
- Construction (9.0 deaths per 100,000 workers)
- Wholesale trade (4.3 deaths per 100,000 workers)
Here are some more of the most-current work injury statistics in 2023 based on data from the BLS:
- Causes of Death on the Job – The leading cause of death on the job is transportation accidents (1,982 fatalities in 2021). This is followed by falls (850), exposure to harmful substances and environments (798), violence and animal attacks (761), contact with objects and equipment (705), and fires and explosions (76)
- Wage and Salary vs. Self-Employed – Of the 5,190 workers who died on the job in 2021, 4,284 (82.5 percent) were employees who received a wage or salary.
- Worker Fatalities By Age – Workers between the ages of 55 and 64 suffered the highest number of fatal work injuries in 2021 (1,140). This was followed by the 45-54 age group (1,087), the 35-44 age group (977), and the 25-34 age group (882).
- Worker Fatalities By Gender – Women have a higher rate of death on the job resulting from roadway accidents and harmful exposure. Men have a higher rate of death on the job resulting from falls and contact with objects and equipment. The BLS has not published comparative data for deaths caused by fires and explosions.
- States with the Most Workplace Deaths – Texas had the most reported workplace deaths in 2021 (533). This was followed by California (462), Florida (315), New York (247), and Georgia (187).
That’s a lot of information, so what are the most notable work injury statistics in 2023? Here are five fast facts about the most-recent data on non-fatal and fatal workplace injuries in the United States:
Fast Fact #1: Workplace injuries are on the rise.
Despite the current unemployment figures, the data show that workplace injuries are on the rise. This is true for both fatal and non-fatal injuries.
Fast Fact #2: Men and women face different, but similar, risks.
While men have a slightly higher rate of job-related injuries than women overall, women have higher rates of injury and death from certain risks (i.e., vehicle collisions and harmful exposure).
Fast Fact #3: Workers in all age groups face risks for serious and fatal injuries.
The risk of suffering a serious or fatal injury on the job is a concern among all age groups. While workers between the ages of 55 and 64 face the highest risk, it isn’t that much higher than the risk for most other age groups.
Fast Fact #4: Transportation, retail, warehousing, healthcare, construction, agriculture, and mining continue to be among the most-dangerous occupations in the U.S.
This has been the case for several years, and it isn’t likely to change any time soon.
Fast Fact #5: California, Texas, and New York are among the most dangerous states for workers.
California, Texas, and New York consistently have the highest numbers of workplace injuries and fatalities. Based on the 2023 work injury statistics, this trend is likely to continue as well.
As a worker, what do 2023’s workplace injury statistics mean for you? The simple answer is: You need to take responsibility for your own safety. While companies should be doing more to protect their workers, as the data make clear, non-fatal and fatal workplace injuries remain far too common. In particular, workers should be cautious of the following risks, which account for the greatest percentage of non-fatal and fatal workplace injuries and illnesses based on the most-recent data available:
- Collisions with objects and equipment
- Equipment and machinery accidents
- Exposure to harmful substances and environments
- Slips, trips, and falls
- Vehicle collisions
Let’s say you’ve been injured on the job. What do you need to know about protecting your health and enforcing your legal rights? Here are the five most important facts for injured workers in the U.S.:
1. Injured Workers in the U.S. Have Clear Legal Rights
Most workers in the U.S. are eligible to receive workers’ compensation benefits when they get injured on the job. This applies in both the public and private sectors. State workers’ compensation laws require most private employers to carry workers’ compensation coverage, while federal laws apply to government employers and private employers in certain high-risk industries. Since workers’ compensation is a “no fault” system, eligible employees can file for benefits even when their employers aren’t responsible for their injuries.
2. Filing for Workers’ Compensation Isn’t the Only Option (In Many Cases)
While some employees will be limited to filing for workers’ compensation benefits, many injured workers will have other options as well. For example, injured workers will be able to file personal injury claims in many cases. Many workers are also eligible to file for Social Security disability (SSD) and other government benefits when they get injured on the job.
3. Strict Rules and Deadlines Apply to Work Injury Claims
Whether you have a workers’ compensation claim, a personal injury claim, or any other type of claim for your work injury, struct rules and deadlines apply. If you wait too long to file your claim—or make any other mistakes—you could end up without the compensation you deserve. As a result, it’s best to hire a lawyer to help you.
4. If You’ve Been Injured on the Job, You Are Not Alone
As these 2023 work injury statistics show, if you’ve been injured on the job, you are not alone. Workers like you file claims for financial compensation every day, and those who hire a lawyer to help them have the best chance of recovering the full financial compensation they deserve.
5. You Can Hire a Work Injury Lawyer at No Out-of-Pocket Cost
When you get injured on the job, one of the most important steps you can take is to hire a lawyer to represent you. From making sure you see a doctor to filing your claim on time (and dealing with your employer’s insurance company on your behalf), there are many ways an experienced lawyer can help you. If you need legal help after suffering a work-related injury, you can get started with a free claim assessment online 24/7 .
So, those are the most current work injury statistics in 2023. As you can see, workplace injuries remain common—far too common—and far to many workers continue to suffer serious injuries and lose their lives on the job each year. If you know someone who would find these statistics useful, we encourage you to share them; and, if you need help recovering from a work injury, we encourage you to contact a local lawyer through WorkInjurySource.com as soon as possible.
Discover the Advantages of Our Legal Expertise
Empowering You with Expert Legal Insights and Advice to Champion Your Legal Challenges. Unleash Your Inner Hero at Law!
Legal Empowerment
Gaining the Knowledge and Confidence to Advocate for Your Rights
Expert Guidance
Unlocking the Wisdom of Legal Professionals to Navigate Complex Cases
Staying Informed
Stay Ahead of Legal Changes and Trends for Informed Decision-Making
Time & Money Savings
Our Expert Insights Assist in Informed Decisions to Avoid Costly Legal Pitfalls
Related Articles

Maximizing Your Workers’ Comp Claim: The Role of Local Lawyers
Gain valuable insights from local workers’ comp attorneys to maximize your claim. Consult experienced local workers comp lawyers for expert legal advice today.

What is BLS – Work Injury Source
What is BLS Bureau of Labor StatisticsThe Bureau of Labor Statistics (BLS)….

Does Surgery Increase a Workers’ Comp Settlement?
Do you need surgery for a work-related injury? Find out how much….

Workplace Safety Measures in the Post-COVID Era
While it has become commonplace to refer to the present as the….

How Long Does It Take Workers’ Comp To Approve Surgery?
Many types of work-related injuries require surgery. From broken bones to soft….

Are you entitled to financial compensation for your work injury? Click the button below to find out in 60 seconds or less!
Get Free Legal Advice for Your Workers' Comp Claim 24/7
Are you entitled to a workers’ comp settlement for your foot injury? To find out, discuss your claim with an experienced attorney near you. Fill the form below to get started with a free work injury claim assessment 24/7.
Explore Jobs
- Jobs Near Me
- Remote Jobs
- Full Time Jobs
- Part Time Jobs
- Entry Level Jobs
- Work From Home Jobs
Find Specific Jobs
- $15 Per Hour Jobs
- $20 Per Hour Jobs
- Hiring Immediately Jobs
- High School Jobs
- H1b Visa Jobs
Explore Careers
- Business And Financial
- Architecture And Engineering
- Computer And Mathematical
Explore Professions
- What They Do
- Certifications
- Demographics
Best Companies
- Health Care
- Fortune 500
Explore Companies
- CEO And Executies
- Resume Builder
- Career Advice
- Explore Majors
- Questions And Answers
- Interview Questions
30 Shocking Workplace Injury Statistics [2023]: Slips, Trips, And Falls In The Workplace

- Time Management Statistics
- Employee Wellness Statistics
- Employment Discrimination Statistics
- Employee Recognition Statistics
- Employee Referral Statistics
- Workplace Violence Statistics
- Gamification Statistics
- Employee Feedback Statistics
- Agile Statistics
- Productivity Statistics
- Meeting Statistics
- Cell Phones At Work Statistics
- Social Media At Work Statistics
- Workplace Injury Statistics
- Workplace Stress Statistics
- Leadership Statistics
- Workplace Collaboration Statistics
- Job Satisfaction Statistics
- Paid Holiday Statistics
- Communication In The Workplace Statistics
- Wasting Time At Work Statistics
- 4-day Workweek Statistics
Research Summary. In recent years, workplace safety initiatives and regulations have been implemented in nearly every industry across the United States. Still, some illnesses and injuries, both nonfatal and fatal, continue to occur at job sites in the U.S. After extensive research, our data analysis team concluded:
There are about 2.6 million nonfatal workplace accidents and injuries in the United States’ private industry each year.
Sprains, strains, and tares are the most common workplace injury in the US, with 266,530 occurring in 2020.
Overexertion and bodily reaction, slips, trips, and falls, and contact with objects and equipment are the highest causes of workplace injury in the US, accounting for 84% of all nonfatal injuries at work.
Nursing assistants have the highest chance of injury, with 370 injuries per every 10,000 full-time workers .
There were 5,190 fatal occupational injuries in the U.S. in 2021.
The agriculture, forestry, fishing, and hunting industry has the highest number of on-the-job fatalities, with 23.4 fatalities per 100,000 employees.
Workplace injuries and illnesses cost the US an estimated $250 billion each year.

Workplace Injury General Statistics
On average, 2.8 out of 100 workers in the U.S are injured in workplace accidents every year.
With 2.6 million nonfatal workplace accidents and injuries occurring yearly across the nation’s private employment industry, about 2.8 people out of 100 get injured at work, according to the U.S. Bureau of Labor Statistics. This number, recorded in 2019, is the same rate reported in both 2018 and 2017.
OSHA has a 2022 budget of $591,787,000.
The federal agency’s budget increased by 10 million since 2020 when their yearly budget stood at $581,787,000. OSHA’s annual budget in 2019 was valued at $557,787,000.
Between OSHA’s federal branch and its state partners, there are 1,850 OSHA inspectors responsible for the safety of 130 million American workers.
Although Federal OSHA has only ten regional offices and 85 local offices, the organization’s state partners have more than 8 million total worksites across the nation. With 1,850 federal and state OSHA inspectors, there is approximately one inspector for every 70,000 U.S. workers.
In 2019, OSHA conducted 33,393 federal inspections and 42,063 state inspections.
Workplace Injury by Industry Statistics
15% of workplace injuries in America occur in manufacturing jobs.
According to BLS data, among private industries in the United States, manufacturing jobs have the highest rate of workplace injuries. In 2019, manufacturing worksites recorded 3.3 cases of reportable non-fatal injuries or illnesses per every 100 employees, amounting to 421,400 people who either got hurt or got sick at work.
Of the 421,400 employees involved in workplace accidents, 64,640 of them missed at least one day of work due to the injury or illness sustained on shift. 28%, or 32,470, of those who missed work, sustained a sprain, strain, or tare, while 14.5%, or 16,790, had soreness or pain, and 13.3%, or 15,380, had a cut, laceration, or puncture.
By industry, construction has some of the highest on-the-job fatality rates in the United States.
Data published by OSHA, or the Occupational Safety and Health Administration, shows that in 2019 20% of employee fatalities in the private industry occurred on construction sites. According to the federal report, 1,061 construction workers died in 2019, accounting for one in every five worker deaths in the U.S. that year.
5,190 U.S. workers died on the job in 2021. When broken down, there were about 15 workplace deaths per day across the nation. Thus, approximately three construction workers died on the job every day of the year.
Line cooks have the highest risk of falling ill with COVID-19 while on the job.
According to a recent study from the University of California, San Francisco, when it comes to contracting COVID-19 at work, line cooks are the most at risk. In addition to contracting the contagious virus, line cooks also have the highest risk of dying during the pandemic from an illness contracted on the job site.
The study found that line cooks had a 60% increase in mortality during the height of the pandemic. The global pandemic also pushed mortality rates above 50% for cooks, line workers in warehouses, agricultural workers, bakers, and construction laborers.
79,660 people were injured at construction sites in 2019.
According to data published by the U.S. Bureau Of Labor Statistics, almost 9% of workplace injuries in 2019 occurred at construction sites, resulting in 21,170 sprains, strains, and tears, 13,190 fractures, and 10,950 cuts, lacerations, and punctures.
Men’s workplace injury rates are 7% higher in the private sector than male employees working in government positions.
According to BLS data, of all the workplace injuries that occurred in the private sector in 2019, 60% of cases were male, and 40% were female. When looking at government employees injured on the job during the same period, however, 53% of injuries were sustained by men while 47% were sustained by women.
Top Causes of Workplace Injuries
Faulty fall protection, respiratory protection, and ladders are among the top three most commonly violated OSHA standards.
Although some of the top 10 most frequently violated OSHA standards in 2021 were specific to the construction industry — like standards surrounding ladder safety, scaffolding requirements, and fall protection on construction sites — most were observed in general industries.
The top general industry violations cited by OSHA in 2021 included lack of respiratory protection, poor hazard communication, improper control of hazardous energy, hazards related to powered industrial trucks and machinery and machine guarding, and lack of training on fall protection measures.
In the United States, 84% of all nonfatal injuries resulting in time away from work are caused by overexertion and bodily reaction, slips, trips, falls, and contact with objects and equipment.
Instances involving excessive physical activity — like strenuous heavy lifting, pushing and straining repetitive motions — as well as slips, trips, and equipment accidents account for the majority of nonfatal workplace injuries across the country.
Data shows that the injury rate per every 10,000 full-time workers is 27 for overexertion and bodily reaction, 23.9 for falls, slips, and trips, and 22.4 for contact with objects and equipment.
Employees aged 45 to 55 are most susceptible to injuries caused by overexertion, bodily reaction, falls, slips, and trips, while people aged 16 to 24 are most at risk for injuries from contact with objects and equipment.
In 2019, approximately 27.4% of nonfatal workplace injuries that occurred in the private industry were due to slips, trips, and falls.
According to the U.S. Bureau of Labor Statistics, of the 888,220 workplace injuries that were recorded in 2019 that resulted in time away from work, 244,000 were from falls, slips, and trips, resulting in 75,420 sprains, strains, and tears, 46,800 fractures, and 6,740 cuts, lacerations, and punctures.
Of the three most common causes of workplace injury in the U.S., overexertion and bodily reaction and falls, slips, and trips result in the longest time away from work.
The number one and number two leading causes of workplace injury across the country — overexertion and bodily reaction and falls, slips, and trips — typically result in 13 days away from work.
This is compared to the country’s third leading cause of workplace injury — contact with objects and equipment — which usually results in 5 days away from work.
Workplace Injury Trends
Workplace deaths in the United States are down by more than 60%.
According to OSHA, workplace deaths across the country were down by 60.53% in 2019, compared to 1970. In just about 50 years, the nation’s on-the-job fatalities, on average across all industries, dropped from 38 per day in 1970 to 15 per day in 2019.
The U.S. workplace injury and illness rate has dropped by about 74% in a 47-year period.
Data released by the United States Occupational Safety and Health Administration shows that workers were getting hurt or sick on the job 74.3% less often in 2019 than they were in 1972.
According to research, there were approximately 10.9 incidents per every 100 workers in 1972. In 2019, there were roughly 2.8 incidents per every 100 workers.
Workplace Injury Demographic Statistics
On average, men are injured on the job 17.3% more often than women.
According to BLS data, in the private industry, 91.7 out of 10,000 full-time male employees sustained injuries that resulted in time away from work in 2019, compared to just 80.4 out of 10,000 full-time female employees , thus making men 17.3% more likely to get injured at work.
The injury rates for both men and women decreased, however, between 2018 and 2019. In 2018, 94.3 men and 83.4 women per 10,000 full-time employees sustained on-the-job injuries.
When workplace injuries occur, people 65 years of age and older typically stay home from work for double the amount of time than the national average.
While people in the United States miss, on average, eight days of work after being injured or involved in an accident at work, employees 65 years and older stay home from work, on average, for 16 days due to workplace injuries and illnesses.
21.3% of people who missed work because of on-the-job injuries in 2019 were between 25 and 34 years old.
According to data released by the U.S. Bureau of Labor Statistics, of the 888,220 people who were injured at work and missed at least one day of work because of that injury, 189,310 of them were between 25 and 34 years old and 184,850, or 20.8%, were between 45 and 54 years old.
Employees aged 14 to 15 had the least injuries, followed by those 16 to 19 years old, those 65 and older, and those 20 to 24 years old.
In 2019, California and Texas had the highest number of workplace deaths compared to any other state in the country.
According to labor statistics, 488 people died while working in Texas in 2019, and 422 people died while working in California in 2019. Although the fatality rates were high in both states, California recorded an incident rate of 2.3 per 100,000 full-time employees, and Texas recorded an incident rate of 3.8 per 100,000 full-time employees .
Other states with higher than average fatal workplace incident rates included Wyoming , Alaska, North Dakota , West Virginia, South Dakota , and Mississippi , with incident rates of 11.5, 9.9, 9.6, 7.9, 6.9, and 6.7 per 100,000 full-time workers.
Arkansas, Delaware, and Georgia are considered the top three least dangerous states, with workplace injury rates below the national average.
Other states with nonfatal workplace illness and injury rates below the national average of 2.8% include Louisiana , Massachusetts, New Jersey , New York, North Carolina , Ohio, South Carolina , Texas, and Virginia .
Alabama, Illinois , Maryland, Missouri , New Mexico, Tennessee , and Utah have workplace injury rates similar to the national average.
On average, people injured on the job miss eight days of work.
In the private industry in 2019, the median number of days people spent away from work due to an on-the-job accident or injury was eight. Some industries, however, recorded higher than average time away from work because of workplace injuries.
For instance, workplace injuries in 2019 caused heavy and tractor-trailer truck drivers to miss an average of 19 days of work, light truck drivers to miss an average of 20 days of work, and material movers and maintenance, repair, freight, and stock workers to miss an average of 12 days of work.
Less than half of all employees injured on the job in 2019 missed work because of their workplace injury or illness.
According to the Department of Labor, of the 2.8 million workers injured in 2019, only 888,220 of them missed at least one day of work because of their injury or illness. The data showed that .9 people per every 100 workers in the U.S.’s private industry sustained a workplace injury that caused them to miss at least one day of work.
Workplace Injury FAQ
What is workers’ comp?
Workers’ compensation, or workers’ comp for short, is a type of social insurance available to employees who are injured or become ill while at work. Workers’ comp provides state-mandated medical coverage and wage benefits to laborers who sustain on-the-job injuries or illnesses.
In addition to providing employees with compensation for medical expenses and lost wages, workers’ comp also typically protects businesses from civil lawsuits.
What does OSHA mean?
OSHA stands for the Occupational Safety and Health Administration. It’s a federal branch of the United States Department of Labor that sets and enforces safety standards to foster healthy, safe, and efficient workplaces across the nation.
OSHA was established from the Occupational Safety and Health Act passed by congress in 1970 and now covers most private sector employers and employees and many public sector employers and employees across the 50 states and in certain U.S. territories and jurisdictions.
What is the number 1 cause of death in the workplace?
The number one cause of death in the workplace is falling, which accounts for 36.5% of all deaths. This can include falling off buildings, poles, ladders, construction areas, or downstairs, and partially explains why construction and other related fields are so dangerous.
Additionally, if falling yourself doesn’t kill you in the workplace, falling objects just might. In the US 10.1% of deaths occur due to swinging, falling, or misplaced objects.
What is the most frequently cited OSHA standards violation?
Fall Protection, construction is the most frequently cited standards violation by federal OSHA for all industries. Respiratory Protection, general industry is next, followed by Ladders, construction. OSHA publishes this list to help alert employers about these cited standards so they are able to take the necessary steps to precent it from happening.
What is the most common workplace injury?
The most common workplace injury are slips and falls. When a person falls they can hit their head or break a bone. In fact, 84% of all nonfatal injuries resulting in time away from work are caused by slips, trips, falls, overexertion and bodily reaction, and contact with objects and equipment.
While workplaces across the country have instituted new safety guidelines and regulations in recent years to significantly curb workplace injuries by more than 60% since 1970, accidents, both major and minor, do continue to occur at reduced rates in the United States.
With 2.6 million nonfatal workplace injuries and illnesses, and 5,190 workplace fatalities, annually, workplace incidents cost the U.S. an estimated $250 billion each year.
Although incidents can occur in any industry, agriculture, forestry, fishing, hunting, transportation and warehousing, and construction continues to rank among the most dangerous industries in the country.
United States Department Of Labor. “ OSHA Data Statistics: Commonly Used Statistics. ” Accessed on 8/14/2021.
U.S. Bureau Of Labor Statistics. “ News Release: Employer Reported Workplace Injuries And Illnesses — 2021. ” Accessed on 8/15/2021.
National Safety Council. “ Top Work-Related Injury Causes. ” Accessed on 8/16/2021.
U.S. Bureau Of Labor Statistics. “ Number Of Nonfatal Occupational Injuries And Illnesses Involving Days Away From Work By Event Of Exposure Leading To Injury Or Illness And Selected Natures Of Injury Or Illness, Private Industry, 2019. ” Accessed on 8/16/2021.
U.S. Bureau Of Labor Statistics. “ Number Of Nonfatal Occupational Injuries And Illnesses Involving Days Away From Work By Industry And Selected Natures Of Injury Or Illness, Private Industry, 2019. ” Accessed on 8/16/2021.
Work Injury Source. “ Workplace Injury Statistics — 2021 UPDATE: Data For Workplace Accidents, Injuries, And Deaths. ” Accessed on 8/16/2021.
CNBC. “ Line Cooks Have The Highest Risk Of Dying During Pandemic, Plus Other Riskiest Jobs: Study. ” Accessed on 8/16/2021.
U.S. Bureau Of Labor Statistics. “ Injuries, Illnesses, and Fatalities. ” Accessed on 4/3/2023.
United States Department Of Labor. “ The 10 Most Frequently Cited Standards. ” Accessed on 4/3/2023.
MercyCare. “ Common Workplace Injuries & How To Prevent Them. ” Accessed on 4/3/2023.
U.S. Bureau of Labor Statistics. “ Census of Fatal Occupational Injuries Summary, 2021. ” Accessed in 4/3/2023.
How useful was this post?
Click on a star to rate it!
Average rating / 5. Vote count:
No votes so far! Be the first to rate this post.

Elsie is an experienced writer, reporter, and content creator. As a leader in her field, Elsie is best known for her work as a Reporter for The Southampton Press, but she can also be credited with contributions to Long Island Pulse Magazine and Hamptons Online. She holds a Bachelor of Arts degree in journalism from Stony Brook University and currently resides in Franklin, Tennessee.

Related posts
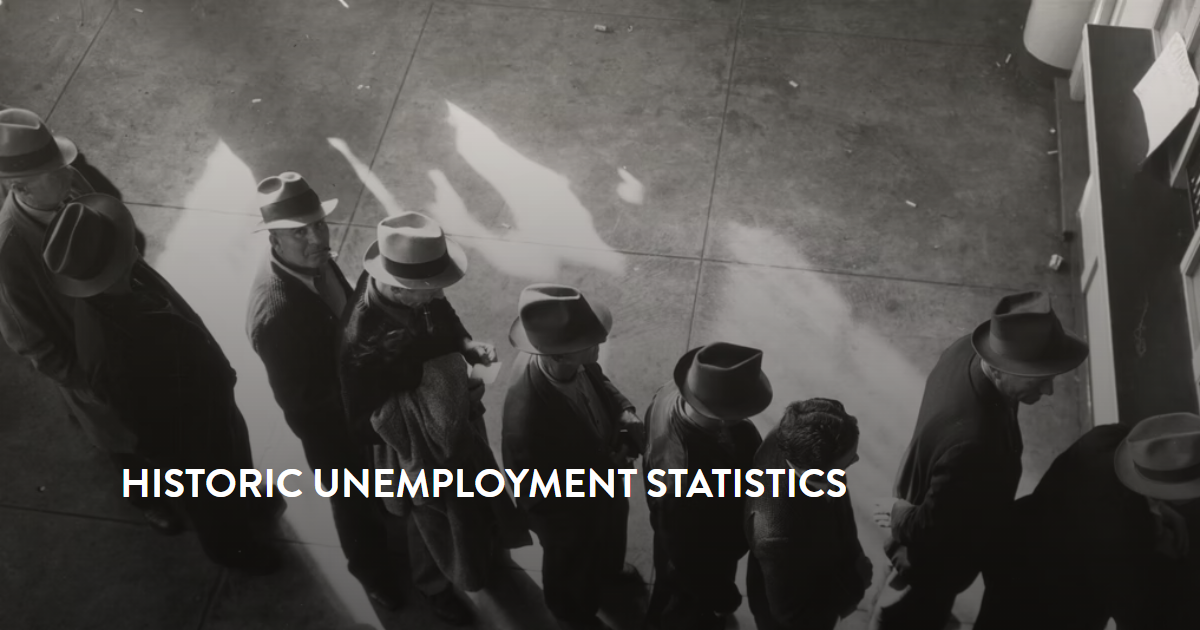
40 Historic United States Unemployment Statistics [2023]

25 Critical Crowdfunding Statistics [2023]: How Many Crowdfunding Platforms Are There

United States Unemployment Rate Over The Past 10 Years

17 Essential Startup Statistics [2023]: Reasons For Failure, Profitability, And More
- Career Advice >

Slips, Trips, and Falls Statistics

Understanding the Dangers of Slips, Trips, and Falls
Slips, trips, and falls might seem like common mishaps, but they can have far-reaching physical and legal consequences. What might seem like a minor problem is actually one of the l eading causes of emergency room visits in the United States.
In 2024, these incidents continue to rank among the primary causes of injuries, harming individuals in various settings, from workplaces to public spaces. We will take you through the latest slips, trips, and falls statistics in 2024, so you can protect yourself from these dangerous accidents.
With more than 1 million people impacted by these incidents, they account for a large number of personal injury claims. If you or a loved one were injured in a slip, trip, or fall accident due to someone else’s negligence, you may qualify for significant compensation.
The Smith Law Center has been serving personal injury victims for over seventy years. We have a long history of representing people in premises liability claims, having won the largest slip-and-fall verdict ever awarded in Virginia. Contact us online or call (757) 244-7000 to learn more.
There’s no such thing as a simple slip and fall. What might appear like a harmless accident at first glance has actually cost many their physical health and, for some, even their lives.
Slips, Trips, and Falls Statistics in 2024
Despite ongoing efforts by organizations to raise awareness about the hazards of slips, trips, and falls, these incidents remain a significant and persistent problem. Places like workplaces, retail stores, and construction sites are hotspots for these accidents, where an ordinary day can quickly turn to tragedy.
How Many Emergency Room Visits Do Slips, Trips, and Falls Account For?
While you might associate the emergency room with catastrophic accidents like car crashes, slips, trips, and falls are significant contributors to ER visits.
In 2023, falls resulted in over 8 million trips to the emergency room, making them the leading case of ER visits, accounting for 21.3% of all visits. Among these, slips and falls were a major factor, leading to over 1 million ER admissions , or 12% of all fall-related visits.
Seniors are at a heightened risk of slips and falls, with emergency departments recording 3 million visits for older adults because of fall injuries.
Leading Cause Of Slips, Trips, and Falls
Poor lighting, cluttered walkways, and stepladders are just a few of the common causes of slips, trips, and falls.
However, the leading cause of slips, trips, and falls are uneven or wet surfaces , contributing to 55% of these incidents. Uneven or wet surfaces may include:
- Freshly waxed or mopped floors.
- Cracks or potholes.
- Icy, greasy, oily, or soiled ground or floors.
- Loose flooring, carpeting, or mats.
Workplace Slips, Trips, And Falls Statistics
Slips, trips, and falls are by far the most common hazards on the job. They put workers at risk of severe injuries, such as:
- Lacerations
- Traumatic Brain Injuries (TBIs)
- Back and spinal cord injuries
Slips, trips, and falls ranked third among the top employer-related workplace injuries and are the primary cause of lost days from work. According to the Bureau of Labor Statistics (BLS), slips, trips, and falls led to 450,540 work injuries and 865 work-related deaths.
Furthermore, slips, trips, and falls make up about 15% of workers’ compensation claims.

Construction sites are especially prone to slips, trips, and fall incidents. In 2021, the construction industry saw nearly 1 in 5 workplace deaths , with over one-third caused by slips, trips, and falls. Almost all of these fatalities resulted from falls to a lower level, making up 46.2% of all fatal slips, trips, and falls that year.
Slips, trips, and falls are severe and should never be underestimated. These incidents result in awful, even life-threatening injuries, as evidenced by the slips, trips, and falls statistics in 2024. The Smith Law Center takes slips, trips, and fall claims seriously, giving clients the resources and attention they deserve. If you’ve suffered an injury in one of these incidents, contact us online or call (757) 244-7000 to find out if you qualify for compensation.
How Many People Die From Tripping and Falling?
Not only do slips, trips, and falls lead to grave injuries, they can prove fatal. In 2022, slips, trips, and falls resulted in 46,653 deaths in occupational and non-occupational settings in the United States.
Falls are the second leading cause of unintentional injury deaths worldwide, with an estimated 684,000 individuals dying from falls globally each year. Additionally, adults 60 years or older suffer from the highest number of fatal falls.
Concerningly, fatal falls do not always involve great heights. Even falls from the same level can prove deadly, as evidenced by the tragic statistic that 144 workers lost their lives in falls on the same level in 2022.
What Demographics Are Most at Risk of Dying from Slips, Trips, or Falls?
Slips, trips, and falls statistics reveal a concerning trend: approximately 30% of people age 65 or older experience fall incidents, with a significant portion being repeat incidents.
Among older adults, slip-and-fall accidents rank as the second leading cause of injury-related deaths for people aged 65-84. However, for those 85 and older, slip-and-fall accidents claim the top spot.
How Can an Attorney Help My Slip, Trip, and Fall Accident Case?
In slip, trip, and fall cases, proving that a property owner was responsible for your injuries can be tough but necessary to win your case.
Property owners have a duty to keep their premises safe, but demonstrating their negligence in failing to do so can be complicated. That’s where a premises liability lawyer steps in to help.
Enlisting the assistance of a lawyer can not only improve your chances of proving negligence but also ensure you get fair compensation for medical bills, lost wages, and other expenses.
How The Smith Law Center Can Support You
At The Smith Law Center, we’re more than just lawyers. We’re a team of people who have made it their life’s work to be there for people who have been wrongly injured. We are truly passionate about helping people recover and move forward in the face of tragedy.
A lawsuit is an opportunity to get the financial support you need to be able to focus on healing and rebuilding your life following a slip, trip, and fall accident.
Our team of experienced lawyers has recovered over a billion dollars for our clients, including a half-million-dollar result for a client who suffered a mild head injury in a slip-and-fall accident inside a Home Depot.
Contact us online or call (757) 244-7000 if you’ve been injured in a slip, trip, or fall incident to discover if you’re eligible for compensation.
Related Resources
If you found this slip, trip, and fall content helpful, please view the related topics below:
- Experienced Deck Collapse Lawyers
- Swimming Pool Accidents and Injuries in Virginia
- Accidents and Injuries at Virginia Hotels
Contact us if you have specific questions on the matter or if you’d like to schedule a free consultation.

About Smith Law Center
No fees unless we win, need legal help tap below. , speak to us now for free, delivering results since 1949, if we don’t win, you don’t pay, speak to a lawyer now.
Click on the link below to connect with our Legal team for a free consultation, we’ll respond within 1 hour during business hours. Or call us 24/7 at (757) 244-7000 .
Contact Info
Quick links, main practice areas.
© 2024 The Smith Law Center. All Rights Reserved.

An official website of the United States government.
Here’s how you know
The .gov means it’s official. Federal government websites often end in .gov or .mil. Before sharing sensitive information, make sure you’re on a federal government site.
The site is secure. The https:// ensures that you are connecting to the official website and that any information you provide is encrypted and transmitted securely.
Occupational Safety and Health Administration
- 中文(简体) (Chinese-Simplified)
- 繁體中文 (Chinese-Traditional)
- Kreyòl ayisyen (Haitian Creole)
- 한국어 (Korean)
- Español (Spanish)
- Filipino/Tagalog
- Tiếng Việt (Vietnamese)
- Data & Statistics
- Workplace Injury, Illness and Fatality Statistics
Workplace Injury, Illness and Fatality Statistics * Source
Injury/illness incidence rates.
- Industry Injury and Illness Data
- State Occupational Injuries and Illnesses
Injury/Illness Characteristics
- Case and Demographic Characteristics for Work-related Injuries and Illnesses Involving Days Away From Work
- OSHA Weekly Fatalities and Catastrophes (FAT/CAT) Reports
- BLS Census of Fatal Occupational Injuries, 1992-Present
BLS (Bureau of Labor Statistics)
- BLS Safety and Health Statistics Home Page
- Keyword Search of Available BLS Injury/Illness and Fatality Data, and Publications
* Source material, data, and tables are provided by the Bureau of Labor Statistics, Department of Labor, and OSHA's Area Offices. OSHA-specific statistics on data and time-series information is monitored through the OSHA Office of Statistics; fatalities in Federal states are compiled by the OSHA Directorate of Enforcement Programs; and fatalities in State Plan states are compiled by the OSHA Directorate of Cooperative and State Programs. Information contained on this site which is specific to OSHA-related labor statistics can be answered through OSHA. All other labor statistics questions and or comments should be addressed through the Bureau of Labor Statistics ( http://www.bls.gov/iif/ ).
A .gov website belongs to an official government organization in the United States.
A lock ( ) or https:// means you've safely connected to the .gov website. Share sensitive information only on official, secure websites.
- Older Adult Fall Prevention
- Falls Facts
- Fall Prevention Resources
- Falls Interventions
Related Topics:
- Still Going Strong
- STEADI - Older Adult Fall Prevention
[cdc_image image_type="basic" dep_image_url="/falls/images/STEADI-banner-2020-b.jpg" image_size="original" image_title="STEADI-banner-2020-b" box_style="header_main_primary" alignment="center" image_alt="STEADI%20falls%20rate%202020" image_margin_position="top,right,bottom,left" image_border="none" overlay_alignment="bottom" overlay_width="50" overlay_margin="large" overlay_padding="standard" overlay_title_size="standard" overlay_button_position="left" image_link="/steadi/index.html" more_link_color="main|primary" image_padding="none" image_padding_position="top,right,bottom,left" cs_rule="inherit" mp_action="none" /] -->
Older Adult Falls Data
At a glance.
Falls are the leading cause of injury for adults ages 65 years and older. Older adult falls are common, costly, and preventable.
Falls are the leading cause of injury for adults ages 65 years and older. 1 Over 14 million, or 1 in 4 older adults report falling every year. 2 This chart shows the number of older adult fall-related deaths by month and year, including the most recent provisional data available. You can access the full interactive chart by clicking on the link below.
View older adult fall trends
Falls among adults aged 65 and older are common, costly, and preventable. Falls are the leading cause of fatal and nonfatal injuries among older adults. 1
Keep reading to learn more about the falls and fall death rates in your state.
Older adult falls reported by state
In the United States, over 14 million, or one in four, adults ages 65 and older (older adults), report falling each year. 2 While not all falls result in an injury, about 37% of those who fall reported an injury that required medical treatment or restricted their activity for at least one day, resulting in an estimated nine million fall injuries. 3
While older adult falls are common across all states, there is variability. 2
Select a year from the drop down to change the map information.
Data source: Centers for Disease Control and Prevention. Behavioral Risk Factor Surveillance System (BRFSS) – https://www.cdc.gov/brfss/annual_data/annual_2020.html
*Age-adjusted percentages standardized to the 2000 U.S. population with age groups 65–74, 75–84, and ≥85 years using the direct method.
Note for grayed-out states on the 2012 map: In the 2012 BRFSS survey, Michigan, Oregon, and Wisconsin used a different falls question from the rest of the states. Therefore, the 2012 falls estimates could not be calculated for these states.
Deaths from older adult falls
Falls are the leading cause of injury-related death among adults ages 65 and older, and the fall death rate is increasing. 4 The age-adjusted fall death rate increased by 41% from 55.3 per 100,000 older adults in 2012 to 78.0 per 100,000 older adults in 2021. 5
The rising number of deaths from falls among older adults can be addressed by screening for fall risk and intervening to address risk factors such as use of medicines that may increase fall risk, or poor strength and balance.
For more information on how to screen, assess, and intervene to reduce fall risk, visit www.cdc.gov/STEADI .
Data source: Centers for Disease Control and Prevention. National Center for Health Statistics. National Vital Statistics System, Mortality 1999–2021 on CDC WONDER Online Database. Accessed January 24, 2023. https://wonder.cdc.gov/ucd-icd10.html
*Age-adjusted death rates standardized to the 2000 U.S. population with age groups 65–74, 75–84, and ≥85 years using the direct method.
**Rates are marked as "unreliable" when the death count is less than 20.
- Centers for Disease Control and Prevention, National Center for Injury Prevention and Control. Web–based Injury Statistics Query and Reporting System (WISQARS) [online].
- Kakara R, Bergen G, Burns E, Stevens M. Nonfatal and Fatal Falls Among Adults Aged ≥65 Years—United States, 2020–2021 . MMWR Morbidity and Mortality Weekly Report. 2023;72:938–943. DOI: 10.15585/mmwr.mm7235a1.
- Moreland B, Kakara R, Henry A. Trends in Nonfatal Falls and Fall-Related Injuries Among Adults Aged ≥65 Years—United States, 2012–2018 . MMWR Morbidity and Mortality Weekly Report. 2020 July 10;69(27):875–881. DOI: 10.15585/mmwr.mm6927a5.
- Kakara RS, Lee R, Eckstrom EN. Cause-Specific Mortality Among Adults Aged ≥65 Years in the United States, 1999 Through 2020 . Public Health Reports. 2023 March;139(1):54–58. DOI: 10.1177/00333549231155869.
- Centers for Disease Control and Prevention, National Center for Health Statistics. National Vital Statistics System, Mortality 1999–2020 on CDC WONDER Online Database , released in 2021. Data are from the Multiple Cause of Death Files, 1999–2020, as compiled from data provided by the 57 vital statistics jurisdictions through the Vital Statistics Cooperative Program. Accessed February 9, 2023.
Falls—and the injuries and deaths they cause—are increasing, but falls can be prevented. Learn more about Older Adult Fall Prevention.
The Problem of Falls from Elevation in Construction and Prevention Resources
The current situation with falls.
In 2022 falls from elevation represented approximately 81% of all fatal and 20% of all nonfatal slips, trips, and falls for all industry workers (BLS 2023a, BLS 2023b). Many of these falls occurred in the construction industry, and significantly impact construction employers, workers, and their families. In fact, construction workers made up nearly half (49%) of all fatal occupational slips, trips, and falls (BLS 2023). Since 2013, construction workers have suffered approximately 300 fatal and 20,000 nonfatal fall-related injuries per year (CPWR 2024). Four out of 10 of the Occupational Safety and Health Administration’s (OSHA) top citations involved falls, including general fall protection, ladders, scaffolding, and fall protection training.
Roofing contractors, residential building construction, and commercial/institutional building construction had the highest number of fatalities in 2022 compared to previous years and other industries (CPWR 2024). In addition, approximately 70% of all fatal falls in construction occurred to those working for employers with less than 10 employees (CPWR 2024).
Causes of Falls
The causes of construction workers’ falls from elevation are complex and multifaceted. There are many different factors at play. In 2021, CPWR conducted a fall experience survey that found that insufficient or ineffective planning is a key underlying cause of falls.
In addition, lack of planning was associated with reduced likelihood of using fall protection. Using fall protection was 71% lower for workers whose employer did not do any planning. Approximately half (49%) of survey respondents said that no fall protection was being used at the time of the fall. Lack of fall protection is particularly problematic for small residential construction firms with fewer than 10 employees (CPWR 2022).
Ladders and Ladder Safety
Falls from ladders are a common cause of injury for construction workers (CPWR 2024). Employers should be familiar with safety and regulatory requirements before using a ladder, including:
Planning work tasks to eliminate or reduce the need to work at elevation.
Providing the right equipment. This includes alternative equipment for extended work periods at elevation, such as aerial lifts, supported scaffolds, or mast climbing platforms. If a ladder must be used, properly select the ladder for the location and height of the task and the weight of the worker. Ensure it is thoroughly inspected before each use.
Training all workers in a language they understand on the proper use, care, and inspection of each type of ladder being used.
A recent webinar hosted by CPWR – The Center for Construction Research and Training (CPWR) discussed ladder safety and ways to improve ladder design, usage, and training. The webinar included a panel of experts who conduct laboratory research on ways to prevent common ladder fall injuries, such as slipping off a ladder and falling with the ladder. The audio from the webinar is also available in Spanish .
Ladder Safety Resources
Ladder Safety App
National Ladder Safety Month website
ALI Training
ANSI blog on 5 most common causes of ladder incidents based on ALI study
OSHA Stairways and Ladders
OSHA Letter of Interpretation on three points of contact
Rescue Planning
Falls can occur quickly, even when all precautions are taken and using proper fall prevention and protection methods. Personal Fall Arrest Systems are a critical option to keep workers safe when performing tasks at heights, but rescue planning is essential.
If a fall occurs and a worker is suspended in a harness for more than a few minutes, a lack of circulation can cause unconsciousness, suspension trauma, and even death.
Every fall protection plan must include a rescue strategy to help workers after a fall and reduce fall-related injuries including suspension trauma even when using a Personal Fall Arrest System. Another finding from CPWR’s fall experience survey was that the odds of a fall being fatal were 76% lower for those who had self-rescue training compared to those who did not have this training. The rescue plan should be tailored to each jobsite and prioritize methods to preserve blood circulation for the worker. Ensure equipment for self-rescue is available, such as trauma straps and self-rescue harness units. The rescue plan should ensure other equipment is available, ready to be used, and in good condition, such as a ladder, aerial lift, or bucket truck.
Rescue Planning Resources
CPWR General Fall Protection Plan (English)
CPWR General Fall Protection Plan (Spanish)
OSHA Model Fall Protection Plan
OSHA Standard Interpretations – Rescue of a suspended worker following a fall event
CPWR Fall Rescue Planning Tipsheet
CPWR Fall Rescue Planning Tipsheet (Spanish)
The National Safety Stand-Down to Prevent Falls in Construction
The National Campaign to Prevent Falls in Construction (Falls Campaign) began in 2012 and was followed in 2014 by the National Safety Stand-Down to Prevent Falls in Construction (Stand-Down). The Falls Campaign idea originated with the National Occupational Research Agenda (NORA) Construction Sector Council. The Sector Council consists of industry experts on health and safety representing contractors, trade associations, labor, government, and academia. The National Institute for Occupational Safety and Health (NIOSH), OSHA, and CPWR are the Falls Campaign organizing partners. The Falls Campaign and Stand-Down are important events because of the high burden falls place on construction workers and their families.
Safety stand-downs originated in the military and are a time to focus on worker safety by stopping work and reinforcing the importance of fall prevention and fall protection.
This year’s Stand-Down will take place May 6-10, 2024. CPWR, NIOSH, and OSHA are hosting a virtual event on Tuesday May 7 th at 2 pm (Eastern Time) to educate employers and crew leaders on how rescue planning can save lives. Click here to register and submit a question in advance. Attendees will learn more about identifying a competent person to lead fall prevention and rescue planning, incorporating key components of a rescue plan into the pre-job planning process, and using FREE resources and templates to tailor your plans to each unique jobsite. The webinar will be in English with simultaneous translation into Spanish available.
On May 8 th at 2pm (Eastern Time) a second Stand-Down webinar presented entirely in Spanish will be hosted. Click here to register and submit a question in advance.
Hosting a Stand-Down
Thousands of companies have held fall safety stand-downs , reaching millions of workers across all 50 states and internationally. Industry and business leaders, universities, labor organizations, and community groups have all participated. In 2023, there were 3,554 stand-downs reaching more than 463,000 workers.
Construction employers and workers are invited to host a Safety Stand-Down or join one.
Your involvement can be as simple as sharing NIOSH, OSHA, or CPWR resources at your worksite. If you would like to host or join a free event that is open to the public, contact your Regional Stand-Down Coordinator . You can find resources to host a Stand-Down and activities at CPWR’s Promotion and Planning Page .
If you do participate in the Stand-Down, make sure you get a Certificate of Participation from OSHA. The certificates provide recognition for your event(s). After removing all personal information, CPWR used the data to evaluate and improve the Falls Campaign and Stand-Down every year. Previous evaluation reports and factsheets can be found on the Stop Construction Falls Evaluation page .
Stand-down Resources
About the Campaign
CPWR’S Planning and Promotion Page on StopConstructionFalls.com
Suggestions to prepare successful Stand-Downs
Highlights from previous Stand-Downs
OSHA Regional Stand-Down Coordinators
OSHA Certificates of Participation
Additional Tools and Resources
National Falls Campaign & Safety Stand-Down Website
CPWR Data Bulletin
Bilingual Fall Hazards & Prevention YouTube Playlist
Spanish Fall Safety YouTube Playlist (Prevención de caídas)
Christina Socias-Morales, DrPH is a Research Epidemiologist in the NIOSH Office of Construction Safety and Health.
Scott Earnest, PhD, PE, CSP, is the Associate Director for the NIOSH Office of Construction Safety and Health.
Jessica Bunting, MPH, is the Research to Practice Director at the Center for Construction Research and Training (CPWR).
Rosa Greenberg, MPH, is a Research Analyst in Research to Practice at CPWR
Scott Breloff, Ph.D. is a Senior Biomechanical Research Engineer in the Division of Field Studies & Engineering and the Co-Coordinator for the Construction Program in the Office of Construction Safety and Health at NIOSH.
Asha Brogan, MS, is a Heath Communication Fellow in the NIOSH Division of Field Studies & Engineering.
Douglas Trout, MD, MHS, is Deputy Director, Office of Construction Safety and Health at NIOSH.
Bureau of Labor Statistics (2023a). News Release National Census of Fatal Occupational Injuries in 2022. USDL-23-2615. December 19, 2023. Available from: https://www.bls.gov/news.release/pdf/cfoi.pdf .
Bureau of Labor Statistics (2023b). Number of nonfatal occupational injuries and illnesses involving days away from work, restricted activity, or job transfer (DART), days away from work (DAFW), and days of restricted work activity, or job transfer (DJTR) by event or exposure leading to injury or illness and industry sector, private industry, 2021-2022 (TABLE R64). November 8, 2023. Available from: https://www.bls.gov/iif/nonfatal-injuries-and-illnesses-tables/case-and-demographic-characteristics-table-r64-2021-2022.xlsx
CPWR (2024). Data Bulletin: Fatal and Nonfatal Falls in the US Construction Industry. The Center for Construction Research and Training. Silver Spring, MD. March 2024. https://www.cpwr.com/wp-content/uploads/DataBulletin-March2024.pdf.
CPWR (2022). Underlying Causes of Falls from Heights (Highlighted Findings from a CPWR Survey). The Center for Construction Research and Training. Silver Spring, MD. March 2022. https://www.cpwr.com/wp-content/uploads/RR-falls_experience_survey.pdf.
One comment on “The Problem of Falls from Elevation in Construction and Prevention Resources”
Comments listed below are posted by individuals not associated with CDC, unless otherwise stated. These comments do not represent the official views of CDC, and CDC does not guarantee that any information posted by individuals on this site is correct, and disclaims any liability for any loss or damage resulting from reliance on any such information. Read more about our comment policy » .
Preventing falls from elevation in construction requires a multifaceted approach involving proper planning, training, equipment, and adherence to safety regulations. Utilizing the available resources and staying updated on best practices can significantly reduce the risk of falls and improve overall safety in the construction industry.
Post a Comment
Cancel reply.
Your email address will not be published. Required fields are marked *
- 3D Printing/Additive Manufacturing
- 50th Anniversary Blog Series
- Aging Workers
- Agriculture
- Animal/Livestock hazards
- Artificial Intelligence
- Back Injury
- Bloodborne pathogens
- Cardiovascular Disease
- cold stress
- commercial fishing
- Communication
- Construction
- Cross Cultural Communication
- Dermal Exposure
- Education and Research Centers
- Electrical Safety
- Emergency Response/Public Sector
- Engineering Control
- Environment/Green Jobs
- Epidemiology
- Fire Fighting
- Food Service
- Future of Work and OSH
- Healthy Work Design
- Hearing Loss
- Heat Stress
- Holiday Themes
- Hydraulic Fracturing
- Infectious Disease Resources
- International
- Landscaping
- Law Enforcement
- Manufacturing
- Manufacturing Mondays Series
- Mental Health
- Motor Vehicle Safety
- Musculoskeletal Disorders
- Nanotechnology
- National Occupational Research Agenda
- Needlestick Prevention
- NIOSH-funded Research
- Nonstandard Work Arrangements
- Observances
- Occupational Health Equity
- Oil and Gas
- Outdoor Work
- Partnership
- Personal Protective Equipment
- Physical activity
- Policy and Programs
- Prevention Through Design
- Prioritizing Research
- Reproductive Health
- Research to practice r2p
- Researcher Spotlights
- Respirators
- Respiratory Health
- Risk Assessment
- Safety and Health Data
- Service Sector
- Small Business
- Social Determinants of Health
- Spanish translations
- Sports and Entertainment
- Strategic Foresight
- Struck-by injuries
- Student Training
- Substance Use Disorder
- Surveillance
- Synthetic Biology
- Systematic review
- Take Home Exposures
- Teachers/School Workers
- Temporary/Contingent Workers
- Total Worker Health
- Translations (other than Spanish)
- Transportation
- Uncategorized
- Veterinarians
- Wearable Technologies
- Wholesale and Retail Trade
- Work Schedules
- Workers' Compensation
- Workplace Medical Mystery
- Workplace Supported Recovery
- World Trade Center Health Program
- Young Workers
To receive email updates about this page, enter your email address:
IMAGES
VIDEO
COMMENTS
OSHA has released 2023 data collected under its new regulation to improve tracking of workplace injuries and illnesses. The data include summary and individual records of more than 375,000 establishments, but not the specific information on slips, trips and falls.
General Work Injury Statistics. 1. Slips, trips, falls, overexertion, bodily reactions, and contact with objects and equipment account for more than 84% of all non-fatal injuries involving days away from work. (Injury Facts) 2. About 2.3 million people worldwide have work-related accidents every year. (ILO)
The same is true of the NSC's data on the average cost of work injuries. Based on the latest work injury statistics available in 2023, the most-expensive injuries for workers are: Amputation - $118,837 average cost per work injury. Fracture or Dislocation - $60,934 average cost per work injury. Other Trauma - $60,228 average cost per work ...
Learn about the latest data on workplace injuries and illnesses in the U.S., including the most common causes, industries, and trends. Find out how slips, trips, and falls rank among the top causes of nonfatal and fatal accidents at work.
According to the Bureau of Labor Statistics (BLS), slips, trips, and falls led to 450,540 work injuries and 865 work-related deaths. Furthermore, slips, trips, and falls make up about 15% of workers' compensation claims. Construction sites are especially prone to slips, trips, and fall incidents. In 2021, the construction industry saw nearly ...
Hazards in the Workplace. In 2022, 865 workers died in falls, and hundreds of thousands were injured badly enough to require days off of work. A worker doesn't have fall from a high level to suffer fatal injuries; 144 workers were killed in falls on the same level in 2022, according to Injury Facts. Construction workers are most at risk for ...
Keyword Search of Available BLS Injury/Illness and Fatality Data, and Publications. * Source material, data, and tables are provided by the Bureau of Labor Statistics, Department of Labor, and OSHA's Area Offices. OSHA-specific statistics on data and time-series information is monitored through the OSHA Office of Statistics; fatalities in ...
Resources and data on slips, trips and falls curated by NSC experts. Here you'll find training, articles on fall hazards, technology resources for working safely at heights and much more. ... Statistics & Data. White Papers & Research. Books & Publications. Observance Calendar. ... 2023 Slips, Trips and Falls Roundtable Series (Member exclusive ...
That means preventing slips, trips, and falls is an ongoing process that relies heavily on employees being able to recognize related hazards. What Are OSHA's Trip Hazard Regulations? OSHA's primary standard for slip, trip, and fall hazards is the General Industry Walking-Working Surface standard (29 CFR 1910 Subpart D, which includes §1910.21-30).
The U.S. Bureau of Labor Statistics (BLS) has transitioned from an annual to a biennial (every two years) publication schedule. ... falls, slips, trips with 674,100 cases, and exposure to harmful substances or environments with 658,240 cases. Notably, 96.3% of the total exposure to harmful substances or environments cases (634,080 of the ...
Older adult falls reported by state. In the United States, over 14 million, or one in four, adults ages 65 and older (older adults), report falling each year. 2 While not all falls result in an injury, about 37% of those who fall reported an injury that required medical treatment or restricted their activity for at least one day, resulting in an estimated nine million fall injuries. 3
The Current Situation with Falls. In 2022 falls from elevation represented approximately 81% of all fatal and 20% of all nonfatal slips, trips, and falls for all industry workers (BLS 2023a, BLS 2023b). Many of these falls occurred in the construction industry, and significantly impact construction employers, workers, and their families.
The US Bureau of Labor Statistics (BLS) reports alarming rates of slip, trip, and fall incidents in 2022. Their most recent data show that slips, trips, and falls are among the top causes of fatal and non-fatal injuries in the workplace: ... Non-Fatal Injuries - Slips, trips, and falls cases ranked third among the top employer-reported ...
The injury rate was 21.7 per 10,000 full-time employees. The 55-plus age group was the most affected by slips, falls, and trips at work. The percentage accounted for 18% out of the total 84% of this data. The industries where this happened the most were agriculture, warehousing, and transportation.
Statistics show slipping and tripping to be the single most common cause of major injury in UK workplaces and they are often the initiators of accidents attributed to other causes, such as some machinery accidents, scalding and falls from height. See the latest slips and trips accident statistics. Statistics show slipping and tripping to be the ...
The Occupational Safety and Health Administration, with support from the National Safety Council and dozens of other groups, asks employers to take a few minutes to discuss fall protection and safety when working from heights during the 2024 National Safety Stand-down May 6-10.. Falls from elevation is the second leading cause of unintentional injury-related death for workers after highway ...
Slips, Trips & Falls July 2023. SLIPS, TRIPS & FALLS:15% OF ALL WORKPLACE ACCIDENTS SLIPS, TRIPS & FALLS on the same level are the 2nd LEADING CAUSE OF INJURY 25,000 Slip, Trip & Fall ACCIDENTS occur DAILY According to the Bureau of Labor Statistics,over 1,000 workers die each year as a result of a slip, trip or fall and countless other mild or ...
Here are some other statistics related to slips, trips, and falls while on the job: 57% of deaths from ladders occur in the construction industry. 43% of deaths from slips, trips, and falls occur in the construction industry. 20% of falls on the same level are due to trips and 13% are due to slips . 11% of falls to a lower level happen when ...
[Federal Register Volume 89, Number 173 (Friday, September 6, 2024)] [Proposed Rules] [Pages 72796-72819] From the Federal Register Online via the Government Publishing Office [www.gpo.gov] [FR Doc No: 2024-19892] [[Page 72796]] ----- DEPARTMENT OF COMMERCE National Oceanic and Atmospheric Administration 50 CFR Part 635 [Docket No. 240829-0229] RIN 0648-BM23 Atlantic Highly Migratory Species ...